Reminder: Custom Rate Survey

Shannon Dill, Principal Agriculture Agent
University of Maryland Extension, Talbot County

Attention Custom Rate Operators or those who use custom farming services!

We need your assistance in securing up-to-date information about farm custom work rates, machinery rental rates and hired labor costs in Maryland. This information is being updated and published by the University of Maryland Extension. It is widely used by farmers across the state, so we need the best information available.

Please respond even if you know only a few rates. We want information on actual rates, either what you PAID TO HIRE work or what you CHARGED TO PERFORM custom work. Custom Rates should include all ownership costs of implement & tractor (if needed), operator labor, fuel and lube.

Reported rates will be summarized in the Custom Rate Survey to show a range and averages for the state. NO individual names or rates will be published in the Custom Rate Survey.

You can complete this survey online at: https://go.umd.edu/customrate2021. Please complete the survey by January 15, 2021.

The results will be available online at www.extension.umd.edu/grainmarketing. We hope this publication will be beneficial to you as a custom farm operator and thank you for your cooperation with this effort.

2020 Custom Farming Rate Survey

Shannon Dill, Principal Agriculture Agent
University of Maryland Extension, Talbot County

Attention custom farming operators!

We need your assistance in securing up-to-date information about farm custom work rates, machinery rental rates and hired labor costs in Maryland. This information is being updated and published by the University of Maryland Extension. It is widely used by farmers across the state and the region, so we need the best information available.

Please respond even if you know only a few rates. We want information on actual rates, either what you paid to hire work or what you charged if you perform custom work. Custom Rates should include all ownership costs of implement & tractor (if needed), operator labor, fuel and lube.

Reported rates will be summarized in the Custom Rate Survey to show a range and averages for the state. NO individual names or rates will be published in the Custom Rate Survey.

You can complete this survey online at: https://go.umd.edu/customrate2021 or you may request a hard copy from Shannon Dill (sdill@umd.edu). Please return by: December 31, 2020. We hope these publications will be beneficial to you as a custom farm operator as well as farmers who use custom operators to perform various tasks on their farm.

The results will be available online at www.extension.umd.edu/grainmarketing. We hope this publication will be beneficial to you as a custom farm operator and thank you for your cooperation with this effort.

If you have any questions or comments regarding the survey please contact me at 410-822-1244 or sdill@umd.edu.

November 2020 WASDE Report

Dale Johnson, Farm Management Specialist
University of Maryland

Information from USDA WASDE report

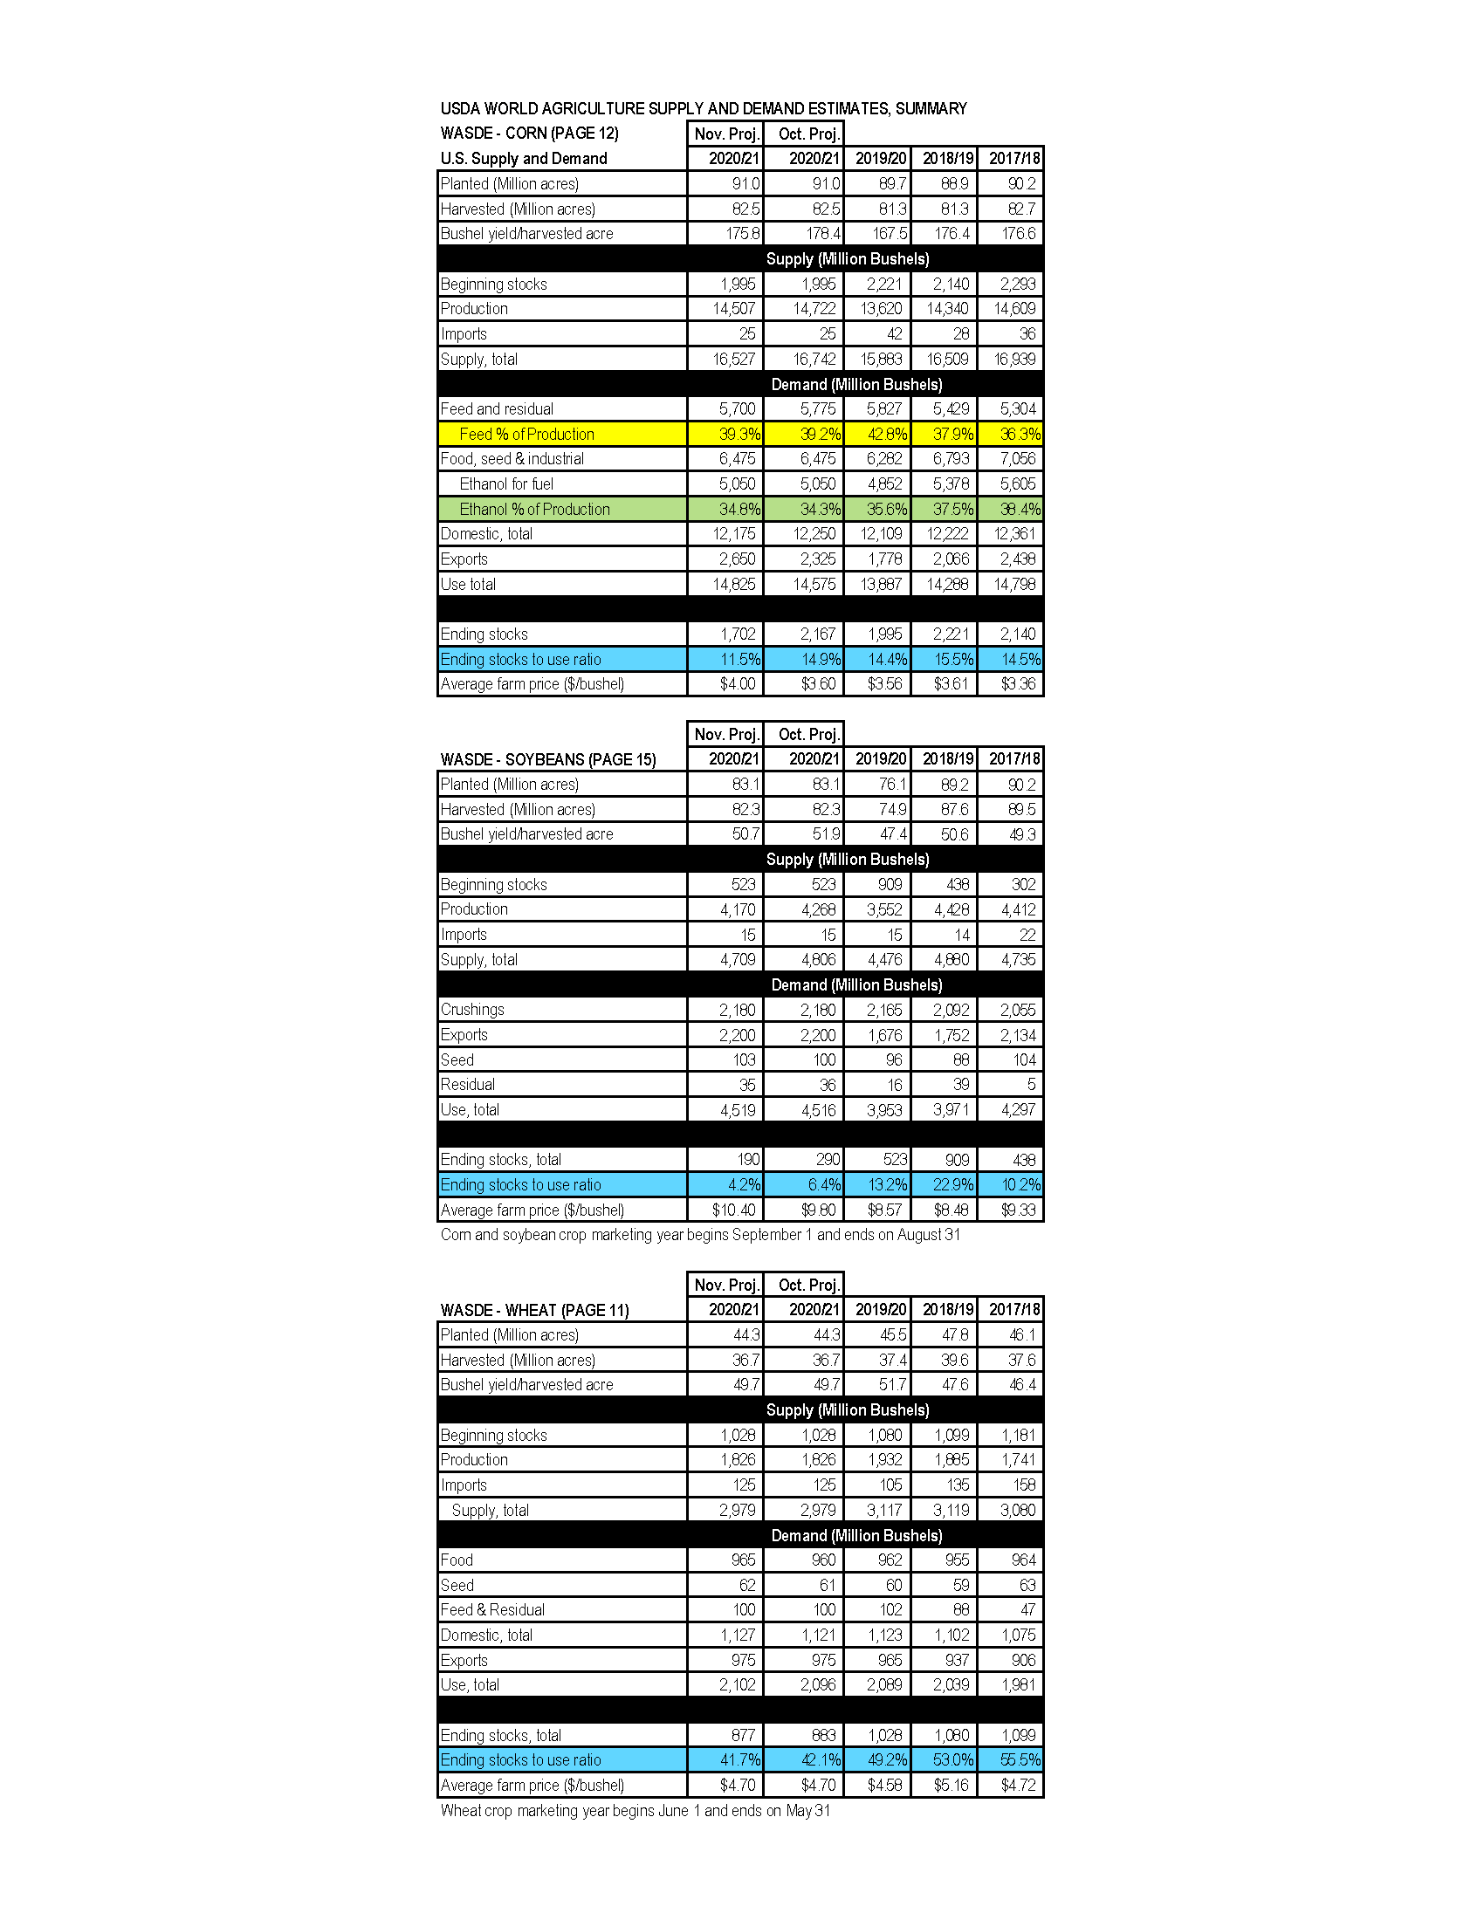
Attached is the summary for the November 10 WASDE.

Corn

Yield estimate was adjusted down a significant 2.6 bushels per acre from 178.4 to 175.8. This decreased production calculation and total supply 215 million bushel. Domestic demand estimate was decreased by 75 million bushels but the export estimate was increased 325 million bushels for an increase in the total demand estimate of 250 million bushel. The net effect of supply and demand decreased ending stocks 465 million bushels and the stocks-to-use ratio from 14.9% to 11.5%. This is the lowest stock-to-use ratio since the 2013/14 marketing year. These changes have been reflected in the market as December futures price for corn has increased $1.00/bu. from $3.23/bu. on August 11 to a high of $4.23/bu. on November 10.

Soybeans

Yield estimate was adjusted down 1.2 bushels per acre from 51.9 to 50.7. This resulted in a decrease of 97 million bushel in estimated 2020/21 supply. On the demand side, minor adjustment in seed and residual resulted in an increase of 3 million bushels in the total demand estimate. The resulting estimate of ending stocks was decreased by 100 million bushels decreasing the stocks-to-use ratio to a very low 4.2% from 10.4% two months ago. This is the lowest stock-to-use ratio since the 2013/14 marketing year. The November futures price for soybeans has spiked $2.55/bu. in the past three months from $8.83/bu. on August 11 to a high of $11.38/bu. on November 10.

Wheat

There were no adjustments in the supply side estimates. The demand estimate was increased by 6 million bushel so the ending stock estimate was adjusted down 6 million bushels and the stocks-to-use ratio decreased from 42.1% in October to 41.7.1% in October. Wheat futures prices (December) increased from $5.94/bu. on October 9 to $6.09/bu. on November 10.

2020 Cover Crop Planting Deadline Extended–Again

The Maryland Department of Agriculture has extended the Cover Crop Program planting deadline to December 1st. Due to the continued rainfall and excessively wet field conditions across the state. Qualifying cover crops include wheat, spelt, rye, and triticale.
If you plant cover crops between November 13 and December 1, you will still qualify for financial support, but suppression/kill down may not take place before May 1, 2021.
The planting extension is only available to farmers who use the following planting methods: no till, conventional, or broadcast with light minimum, or vertical tillage.
Cover crop planting should be reported within one week of planting and no later than December 8th.
Contact your local soil conservation district for questions.
Read the full press release here.

2020 Soybean Fungicide Trials

Alyssa Koehler, Extension Field Crops Pathologist
University of Delaware

Carvel Research and Education Center Georgetown, DE

2020 Soybean Foliar Fungicide Trial


Variety: CZ 3930GTLL treated with Poncho/VoTiVo + Ilevo | Planting Date: 5/11/20

Plant Population: 150,000 sd/a | Harvest Date: 10/22/20

Treatmentz % Green Stems at Harvesty Test Weight Moisture Yieldx Avg. Purple Seed Stainw Avg. Diaporthe/Phomopsis Seed Decayv
Control 6.2 a 55.0 a 15.8 a 67.2 ab 2.4 ab 1.2 a
Revytek (R3)

8 oz/a

8.3 a 55.4 a 15.6 a 69.7 ab 1.6 ab 0.4 a
Priaxor  (R3)

4 oz/a

4.9 a 55.5 a 15.6 a 65.4 b 0.8 ab 0.6 a
Veltyma (R3)

7 oz/a

10.0 a 55.2 a 15.6 a 75.7 ab 1.8 ab 1.0 a
USF0411 (R3)

8 oz/a

6.2 a 55.3 a 15.5 a 68.8 ab 1.6 ab 0.6 a
Delaro (R3)

8 oz/a

8.5 a 55.2 a 15.5 a 78.7 a 1.0 ab 0.8 a
Topguard EQ (R3)

5 oz/a

6.2 a 55.1 a 15.8 a 68.2 ab 1.8 ab 0.6 a
Lucento (R3)

5 oz/a

7.1 a 54.9 a 15.6 a 71.5 ab 1.8 ab 1.2 a
Miravis Neo (R3)

13.7 oz/a

4.4 a 55.5 a 15.2 a 71.2 ab 0.6 b 1.0 a
Miravis Top (R3)

13.7 oz/a

5.8 a 55.5 a 15.2 a 71.0 ab 1.0 ab 0.6 a
Quadris Top SBX (R3) 8 oz/a 8.7 a 55.5 a 15.3 a 74.9 ab 0.6 b 0.6 a
Miravis Neo (R5)

13.7 oz/a

6.9 a 55.1 a 15.4 a 71.9 ab 3.0 a 1.0 a
Miravis Top (R5)

13.7 oz/a

7.0 a 55.0 a 15.4 a 70.7 ab 0.8 ab 0.4 a
Miravis Neo (R3) fb Trivapro (R5)

13.7 + 13.7 oz/a

7.4 a 55.3 a 15.6 a 66.3 ab 0.8 ab 0.4 a
p-value 0.184 0.141 0.30 0.04 0.017 0.844
LSD (α=0.05) 3.654 0.452 0.491 7.52 1.35 1.05

zR3 treatments applied 7/30/20, R5 8/12/20 using a Co2 pressurized backpack sprayer equipped with extended range 8002VS flat fan nozzles calibrated to deliver 20 GPA at 40 psi. Plots were set up in a randomized complete block design with five replications. All treatments included 0.125% non-ionic surfactant, Induce.

y Percent of green stems out of total stems in rows 2 and 3 of each plot the day of harvest. Means followed by the same letter are not significantly different based on Fisher’s Least Significant Difference (LSD; α=0.05).

x Yield was calculated from the center two rows of each plot and adjusted to 13% moisture.

w Avg. number of seeds in 10g subsample from each plot with purple discoloration.

v Avg. number of seeds in 10g subsample from each plot with white/chalky appearance.

2020 Corn Fungicide Trials

Alyssa Koehler, Extension Field Crops Pathologist
University of Delaware

Carvel Research and Education Center Georgetown, DE

2020 Irrigated Corn Fungicide Trial – Rotated Field


Variety: Hubner H6187RCSS | Planting Date: 5/14/20 | Harvest Date: 9/15/20 | Planting Population: 32,000 sd/A   


Treatmentz

% GLS Incidence 14 daay % GLS Severity 14daax % GLS Severity 28 daa % GLS Severity 42 daa Canopeo green canopy cover

49 daa

Moisture Test Weight Yieldw
Veltyma (R1)

7 oz/a

24.0 ab 0.24 ab 0.48 ab 1.10 abc 47.2 ab 22.8 a 52.5 abc 227.2 a
Headline AMP (R1)

10 oz/a

22.0 ab 0.22 ab 0.52 bc 1.48 d 43.4 bc 22.8 a 52.7 bc 232.3 a
Priaxor  (R1)

4 oz/a

24.0 ab 0.24 ab 0.50 ab 1.36 bcd 43.7 abc 22.9 a 52.6 bc 227.8 a
USF0411 (R1)

8 oz/a

30.0 b 0.30 b 0.54 b 0.88 a 49.8 a 23.3 a 52.5 abc 228.6 a
Topguard EQ(R1)

5 oz/a

22.0 ab 0.24 ab 0.52 ab 1.30 bcd 46.0 ab 23.0 a 52.6 bc 229.4 a
Lucento (R1)

5 oz/a

22.0 ab 0.22 ab 0.48 ab 1.04 ab 48.0 ab 23.0 a 52.3 ab 231.8 a
Trivapro (V8) fb Miravis Neo (R1)

13.7 +13.7  oz/a

16.0 a 0.18 ab 0.50 ab 1.36 bcd 48.3 ab 23.6 a 52.2 ab 230.1 a
Trivapro (R1)

13.7 oz/a

24.0 ab 0.24 ab 0.52 ab 1.34 bcd 43.7 abc 23.1 a 52.5 abc 230.0 a
Trivapro (V8) (3 reps) 13.7 oz/a 30.0 b 0.30 b 0.50 ab 1.23 a-d 38.8 c 22.8 a 52.8 c 220.2 a
Miravis Neo (V8)

13.7 oz/a

20.0 ab 0.20 ab 0.52 ab 1.42 cd 39.3 c 22.8 a 52.8 c 224.8 a
Miravis Neo (R1)

13.7 oz/a

14.0 a 0.14 a 0.46 a 1.30 bcd 46.2 ab 23.3 a 52. 1 a 228.4 a
Control 86.0 c 0.88 c 0.70 c 2.50 e 39.5 c 22.7 a 52.9 c 218.1 a
p-value 0.0001 0.0001 0.0001 0.0001 0.007 0.108 0.05 0.315
LSD (α=0.05) 12.16 0.13 0.07 0.36 6.05 0.57 0.47 10.75

z V8 applied 6/24/20, R1 applied 7/14/20 using a Co2 pressurized backpack sprayer equipped with TP8002-VS flat fan nozzle nozzles calibrated to deliver 20 GPA at 40 psi with plots set up in RCBD with five replications. All treatments included 0.125% non-ionic surfactant, Induce.

 y Disease incidence was rated as percentage of 10 ear leaves with grey leaf spot lesions caused by Cercospora zeae-maydis. Means followed by the same letter are not significantly different based on Fisher’s Least Significant Difference (LSD; α=0.05).

x Grey leaf spot severity was visually assessed as the average % ear leaf covered in lesions per plot; means of 10 leaves per plot were used for analysis.

 w Yield was calculated from the center two rows of each plot and adjusted to 15.5% moisture.


Warrington Irrigation Farm: 2020

Irrigated Corn Fungicide Trial – Corn on Corn


Variety: Axis 64K24 | Planting Date: 5/11/20 | Harvest Date: 10/6/20 | Planting Population: 34,000 sd/A

Treatmentz Avg % GLS Incidence 14 daay Avg % GLS Severity 14daax Avg % GLS Severity

28 daa

Avg % GLS Severity

42 daa

Avg % Curvularia Severity

42 daaw

Canopeo green canopy cover

42 daa

% Lodging

72 daa

Test Weight Moisture Yieldv
Veltyma (R1)

7 oz/a

8.0 a 0.08 a 0.88 a 2.28 c 8.87 abcd 42.4 cd 6.0 ab 57.0 ab 20.26 abcd 218.8 a
Headline AMP (R1)

10 oz/a

18.0 abc 0.18 abc 1.00 a 2.02 abc 9.22 bcd 44.0 bcd 6.0 ab 57.0 ab 19.90 bcd 228.4 a
Priaxor  (R1)

4 oz/a

14.0 ab 0.14 ab 0.98 a 2.18 bc 9.14 bcd 40.9 d 8.0 ab 57.2 ab 19.80 de 220.9 a
Revytek (R1)

8 oz/a

16.0 abc 0.16 ab 0.84 a 1.56 abc 7.72 a 47.7 abcd 2.0 ab 56.2 c 20.38 ab 228.7 a
USF0411 (R1)

8 oz/a

16.0 abc 0.16 ab 0.86 a 1.20 a 7.60 a 51.8 a 0.0 a 56.7 bc 20.42 a 225.8 a
Delaro (R1)

8 oz/a

14.0 ab 0.14 ab 0.96 a 1.76 abc 9.50 bcd 41.4 d 2.0 ab 57.1 ab 19.86 cde 221.5 a
Topguard EQ (R1)

5 oz/a

12.0 ab 0.12 ab 1.02 a 1.82 abc 8.40 ab 46.8 abcd 10.0 b 57.0 ab 20.16 abcd 233.9 a
Lucento (R1)

5 oz/a

20.0 bc 0.20 bc 0.78 a 1.60 abc 7.76 a 49.2 ab 0.0 a 56.6 bc 20.26 abcd 227.0 a
Trivapro (R1)

13.7 oz/a

26.0 c 0.28 c 0.84 a 1.90 abc 9.08 bcd 46.3 abcd 2.0 ab 57.0 ab 20.12 abcd 226.7 a
Miravis Neo (R1)

13.7 oz/a

12.0 ab 0.12 ab 0.70 a 1.42 ab 8.58 abc 48.7 abc 4.0 ab 56.8 bc 20.32 abc 226.3 a
Quilt Xcel (R1)

10.5 oz/a

20.0 bc 0.20 bc 1.08 a 2.00 abc 9.74 cd 46.3 abcd 8.0 ab 56.8 bc 20.22 abcd 219.7 a
Control 98 d 1.18 d 2.7 b 11.18 d 9.90 d 32.5 e 26.0 c 57.5 a 19.38 e 205.2 a
p-value 0.0001 0.0001 0.0001 0.0001 0.004 0.0001 0.0003 0.05 0.005 0.33
LSD (α=0.05) 10.45 0.12 0.50 0.84 1.29 6.8 9.77 0.65 0.50 19.0

zAll treatments applied 7/14/20 using a Co2 pressurized backpack sprayer equipped with TP8002-VS flat fan nozzles calibrated to deliver 20 GPA at 40 psi with plots set up in RCBD with five replications. All treatments included 0.125% non-ionic surfactant, Induce.

y GLS incidence was rated as percentage of 10 ear leaves with grey leaf spot lesions caused by Cercospora zeae-maydis. Means followed by the same letter are not significantly different based on Fisher’s Least Significant Difference (LSD; α=0.05).

x GLS severity was visually assessed as the avg % ear leaf covered in GLS lesions per plot; means of 10 leaves per plot were used for analysis.

w Curvularia severity was visually assessed as avg % ear leaf covered in Curvularia lesions per plot; means of 10 leaves per plot were used for analysis.

v Yield was calculated from the center two rows of each plot and adjusted to 15.5% moisture.
 

2020 Forage Variety Trial Update

Amanda Grev, Pasture and Forage Specialist
University of Maryland Extension

As new forage varieties continue to be developed and released, the efficacy and performance of these varieties needs to be evaluated. Similarly, as forage and livestock producers are making decisions on which forage species and variety to establish, it is helpful to compare performance data from a number of available varieties. To this end, the University of Maryland Extension Forage Team is in the process of establishing a series of forage variety trials.

In September 2019, an orchardgrass variety trial was established at the Western Maryland Research and Education Center (WMREC) in Keedysville, MD in order to evaluate select orchardgrass varieties based on forage production and quality. Plots were arranged in a randomized complete block design with each individual entry replicated four times. All varieties were planted at a rate of 25 pounds per acre; seed was broadcast and then cultipacked to establish good seed-to-soil contact. The varieties planted included: Alpine, Bounty II, Extend, HLR Blend, Inavale, Olathe, Pennlate, and Rushmore II.

Data collection began when the majority of forage varieties reached the boot stage of development (prior to seed head emergence). The first cutting occurred on May 18, 2020; this was followed by a second cutting on August 3, 2020 and a third and final cutting on September 28, 2020. At each cutting, forage biomass was collected along a 3 ft. by 20 ft. strip from the center of each plot using a forage harvester set to a cutting height of 4 inches. Collected biomass was weighed, dried in a forced air oven, and weighed again for dry matter and forage yield determination. Sub-samples were also taken from each plot and sent to a commercial laboratory for forage quality analysis.

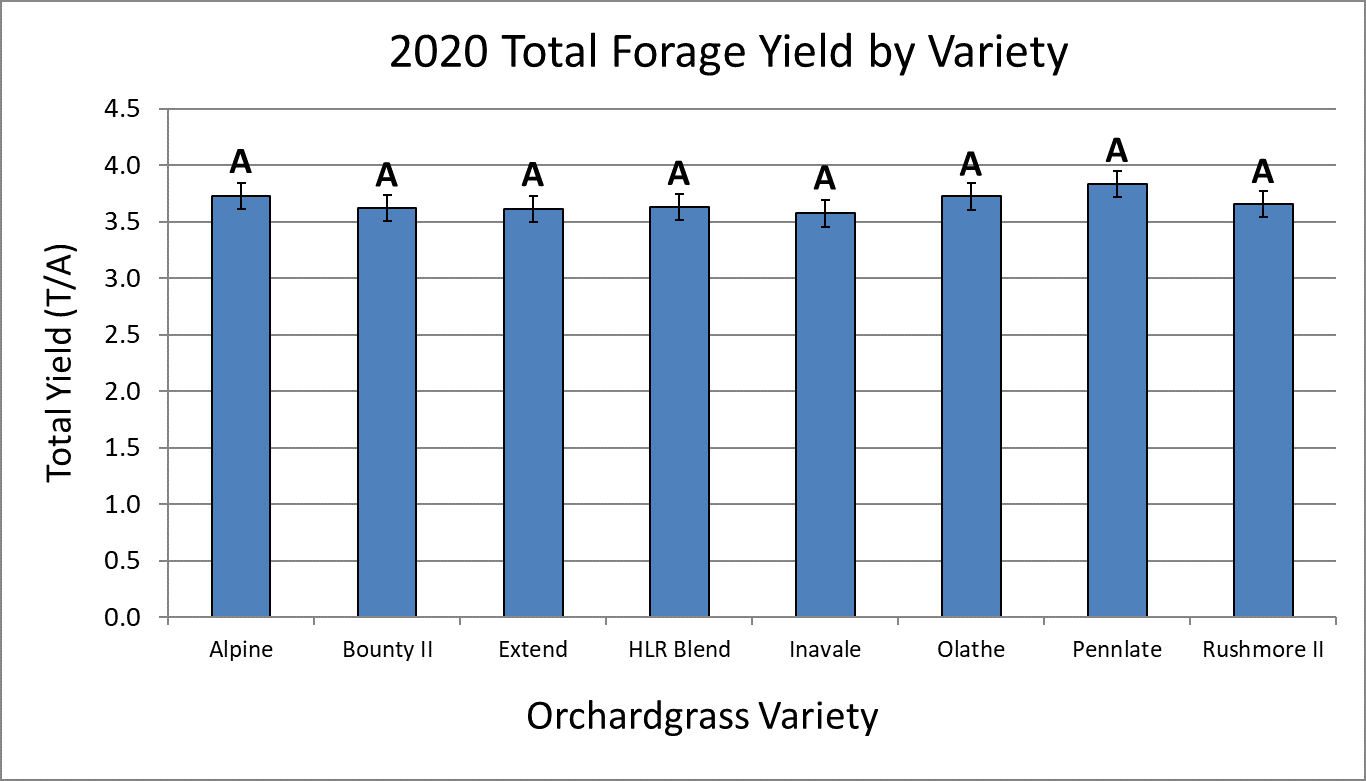
Seasonal cumulative yield for all orchardgrass varieties ranged from 3.6 to 3.8 tons per acre (Figure 1). Statistical analysis indicates no significant difference in forage yield among any of the varieties for the 2020 growing season. Forage quality analysis is underway; forage quality results will be shared once the analysis is complete.

A big thank you to Jeff Semler and the entire WMREC crew for their assistance in getting this trial started and their help with harvest and data collection. Seed for this study was donated by DLF Pickseed, Seedway, and Kings Agriseeds. These plots will continue to be evaluated for yield, quality, and additional performance parameters in the coming years. We hope to expand the trial to include multiple locations, as well as additional forage species and varieties.

Figure 1. Orchardgrass forage variety trial yield results for 2020, presented as total seasonal yield in tons per acre. Varieties marked by a common letter indicate similar yield production (i.e. no significant difference).

2020 Mid-Atlantic Crop Management School Registration Closes November 9, 2020

Registration will close on Monday, November 9, 2020 at 11:59 pm ET for the 2020 Mid-Atlantic Crop Management School. Registration is $150. This year’s school will be presented virtually online November 16-20, 2020. Talks will be given from 8:30-12:30 each day that week and CCA credits will be available in nutrient, crop, and pest management, as well as soil and water. There will also be nutrient and pest management credits available for West Virginia, Virginia, Maryland, Delaware and Pennsylvania. PLUS, all registered attendees will be provided access to view recorded sessions at your leisure via Google Classrooms with continuing education credits available until December 11th.  If you have already registered, thank you.

To see the schedule and register, please visit either link:

Registration Option 1 – https://app.certain.com/profile/3209842

Registration Option 2 – https://go.umd.edu/crop20registration

Please contact Jarrod Miller (jarrod@udel.ed), Amy Shober (ashober@udel.edu), or Nicole Fiorellino (nfiorell@umd.edu) with any questions about options and credits.