Ag Commodity Markets: Review and Outlook

Mark Townsend, Agriculture Agent Associate | mtownsen@umd.edu
University of Maryland Extension, Frederick County

Grain markets have slid significantly from the highs posted last summer that followed the perceived drought in the Midwest.

Image Credit: Barchart: December ‘24 Corn Contract from June 2023 to April 3, 2024.

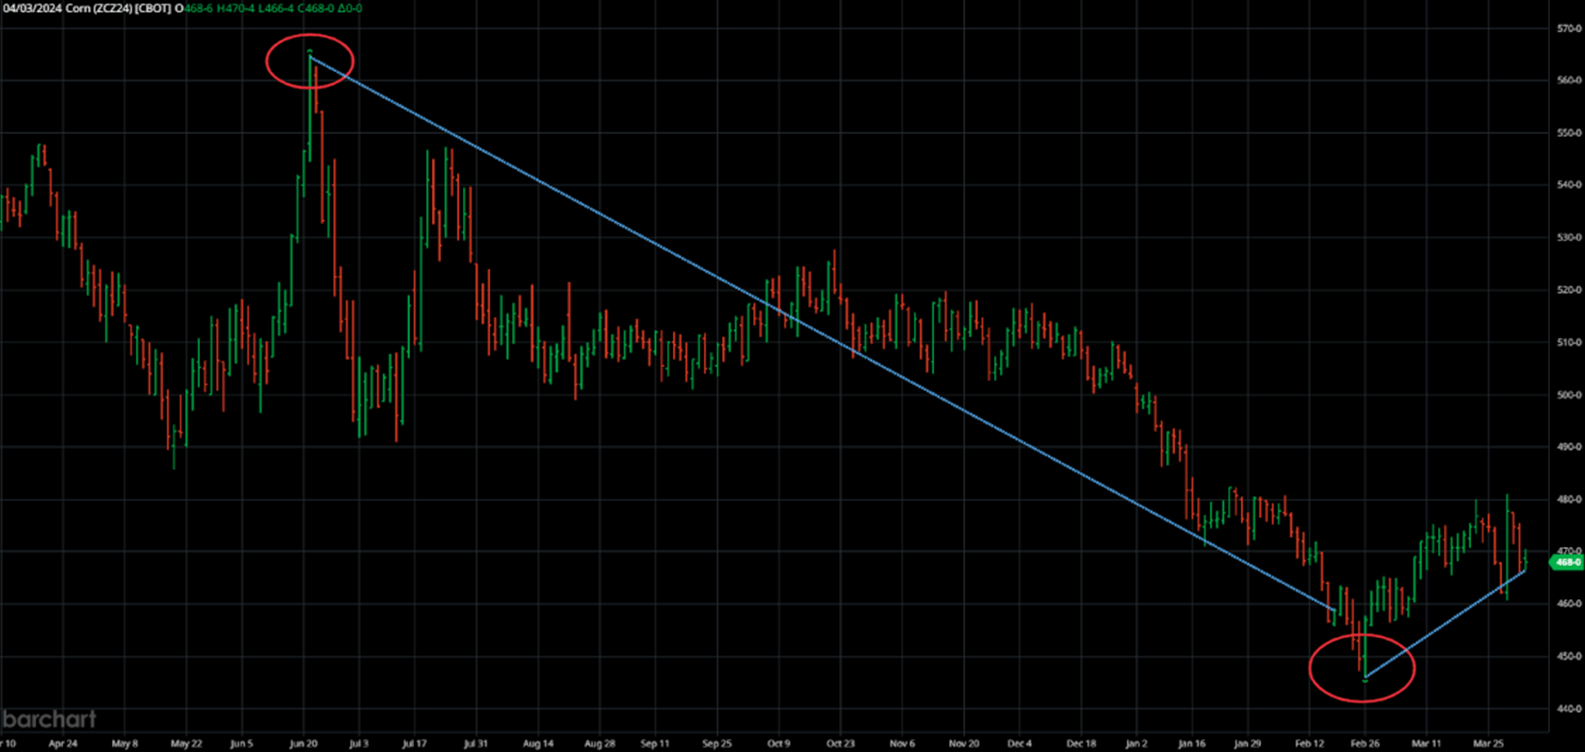
Unfortunately, these drought concerns were generally unfounded as key growing areas received timely rains to keep yields from suffering in the corn belt. In fact, the U.S. set a new corn production record at 15.234 billion bushels topping the previous record set in 2016 at 15.148 billion bushels. The trifecta of a record large U.S. crop, a large Brazilian corn crop, as well as underwhelming domestic and export demand sent prices spiraling lower from August 2023 to February 2024. The March ‘24 Corn contract traded at three-year lows on February 26th dipping below $4 following 11 consecutive week-over-week price declines.

Soybeans were unfortunately no better, falling $2.90 from their summer high ($14.18) to their low ($11.28) in the March ‘24 contract. Much of the same stories plagued this market including an unrealized weather rally and outstandingly large South American production that punished U.S. export demand.

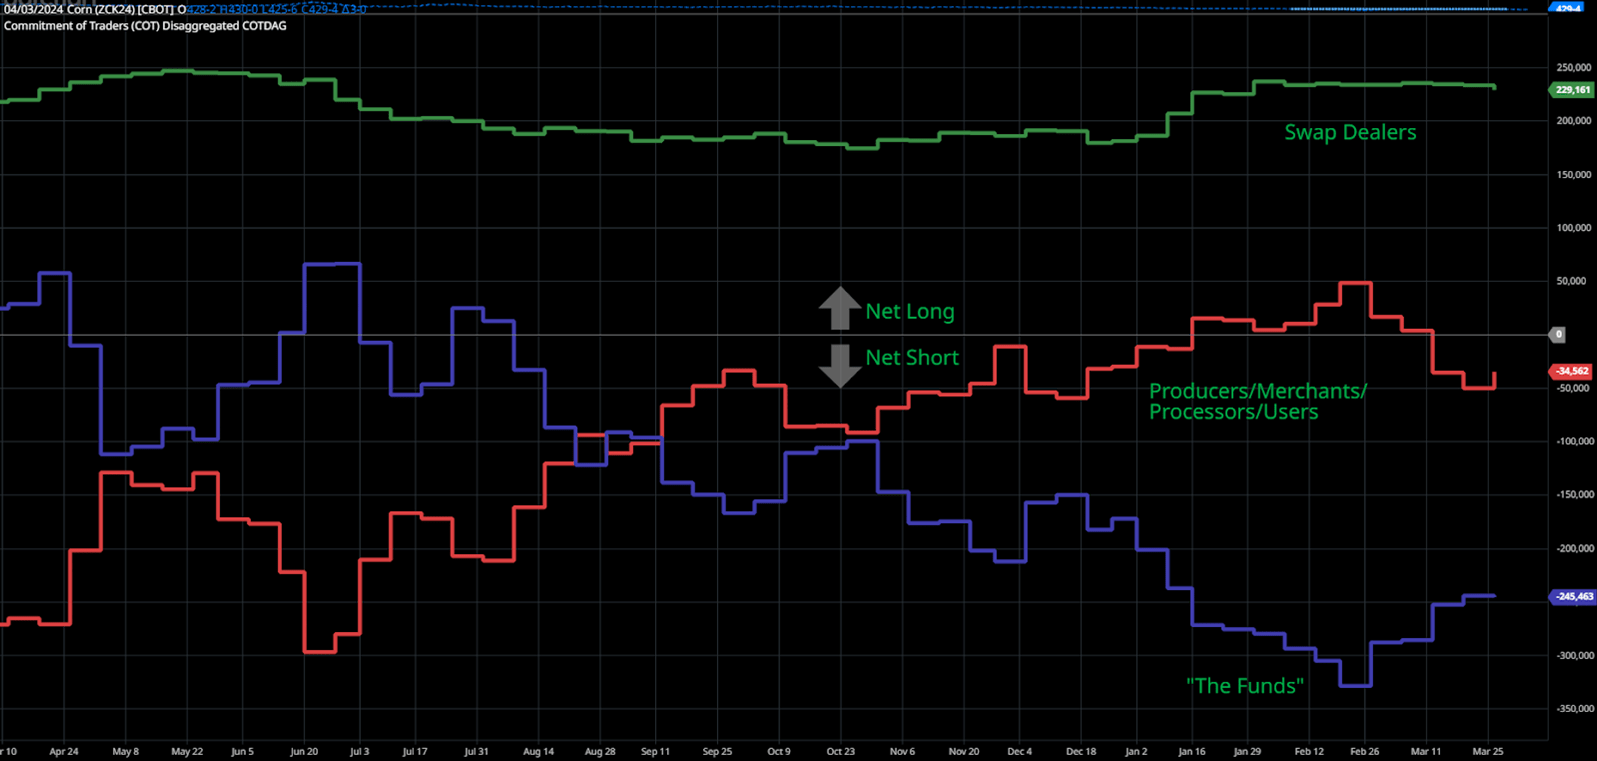
To add insult to injury, “the Funds”—traders in the market who manage money for clients as either hedges or other investment strategies hit a record 340,732 net short position in the corn market on February 20th. Simply stated, these traders placed the largest-ever bet on corn prices continuing to decline, which has placed a metaphorical wet-blanket on any hopes of a rally.

Today

Grains have rallied from the end of February and throughout March. The inflection point was the last day of notice for March hedge-to-arrive (HTA) contracts. To that point, sellers (farmers, dealers, etc.) had the choice of pricing corn at current prices or “rolling” the contract to the May contract. The bleak outlook forced many hands and stimulated selling which pulled prices lower until the selling pressure was over.

Since then, both the corn and soybean markets have rallied off the lows and recovered to price levels previously seen in early February. The upward momentum has been driven by a phenomenon known as “short covering” that creates a positive feedback loop–the more it happens, the more it happens. As prices rise, “The Funds” in their net short position lose money as their bet has turned against them. To stop this, they must exit their position by buying a contract to offset the one they previously sold1. The buying stimulates further price increases that induce another fund manager having to offset their short position. At its extreme, this feedback loop can throw prices to astronomical levels2. In this case, the bump is a welcomed change but is unlikely to send us much higher for now.

More recently, the USDA released its Prospective Plantings Report compiled from surveys asking farmers their planting intentions this season. The report suggests growers will plant 90 million acres of corn and 86 million acres of soybeans, indicating that growers are shifting acres away from corn to soybeans. This was unsurprising, however traders found this as good news as the nearby contracts in both markets traded higher the day of the report. However, traders are generally wary of this recent report given the low farmer response rate and the tendency for acreage figures to climb with subsequent USDA planting reports.
Season Outlook:

The saying, “all models are wrong, but some are useful” may hold true for commodity market predictions as well; there is a significant degree of uncertainty in any market that can render any forecast absolutely incorrect. As such, this is not meant to be a forecast but more of an observation of trends and conditions that may prove useful.

Supply and Demand Fundamentals

Image Credit: Barchart. CFTC Commitment of Traders in the Corn Market (all contracts).

Every market most fundamentally relies on the interplay between supply and demand. Currently in the grains, supply has outstripped demand. Following last year’s record crop, U.S. corn supply is almost burdensome.

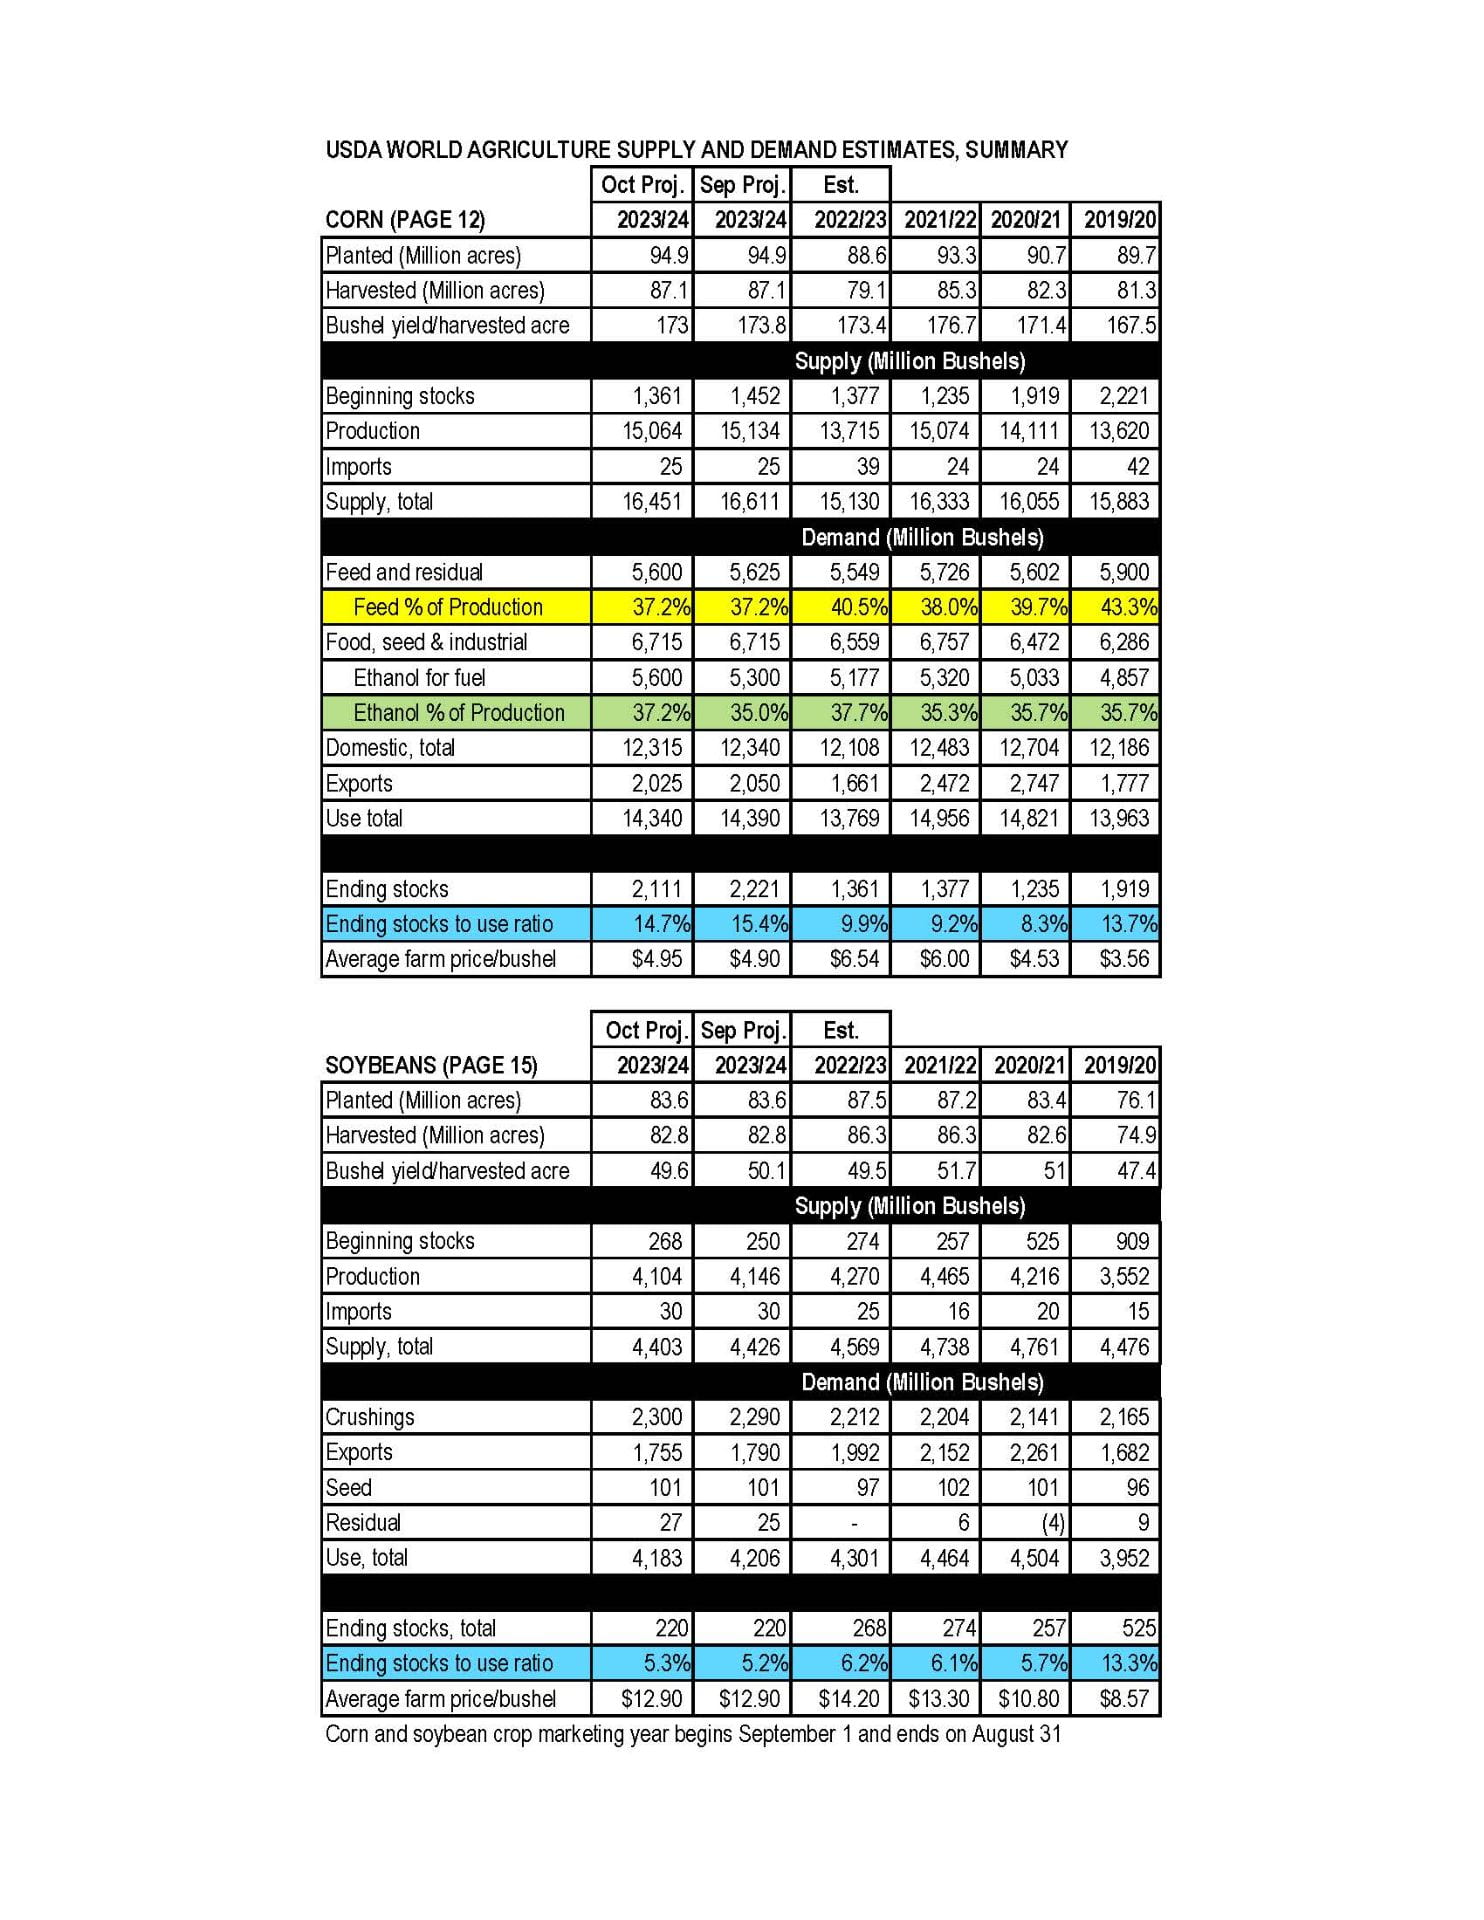
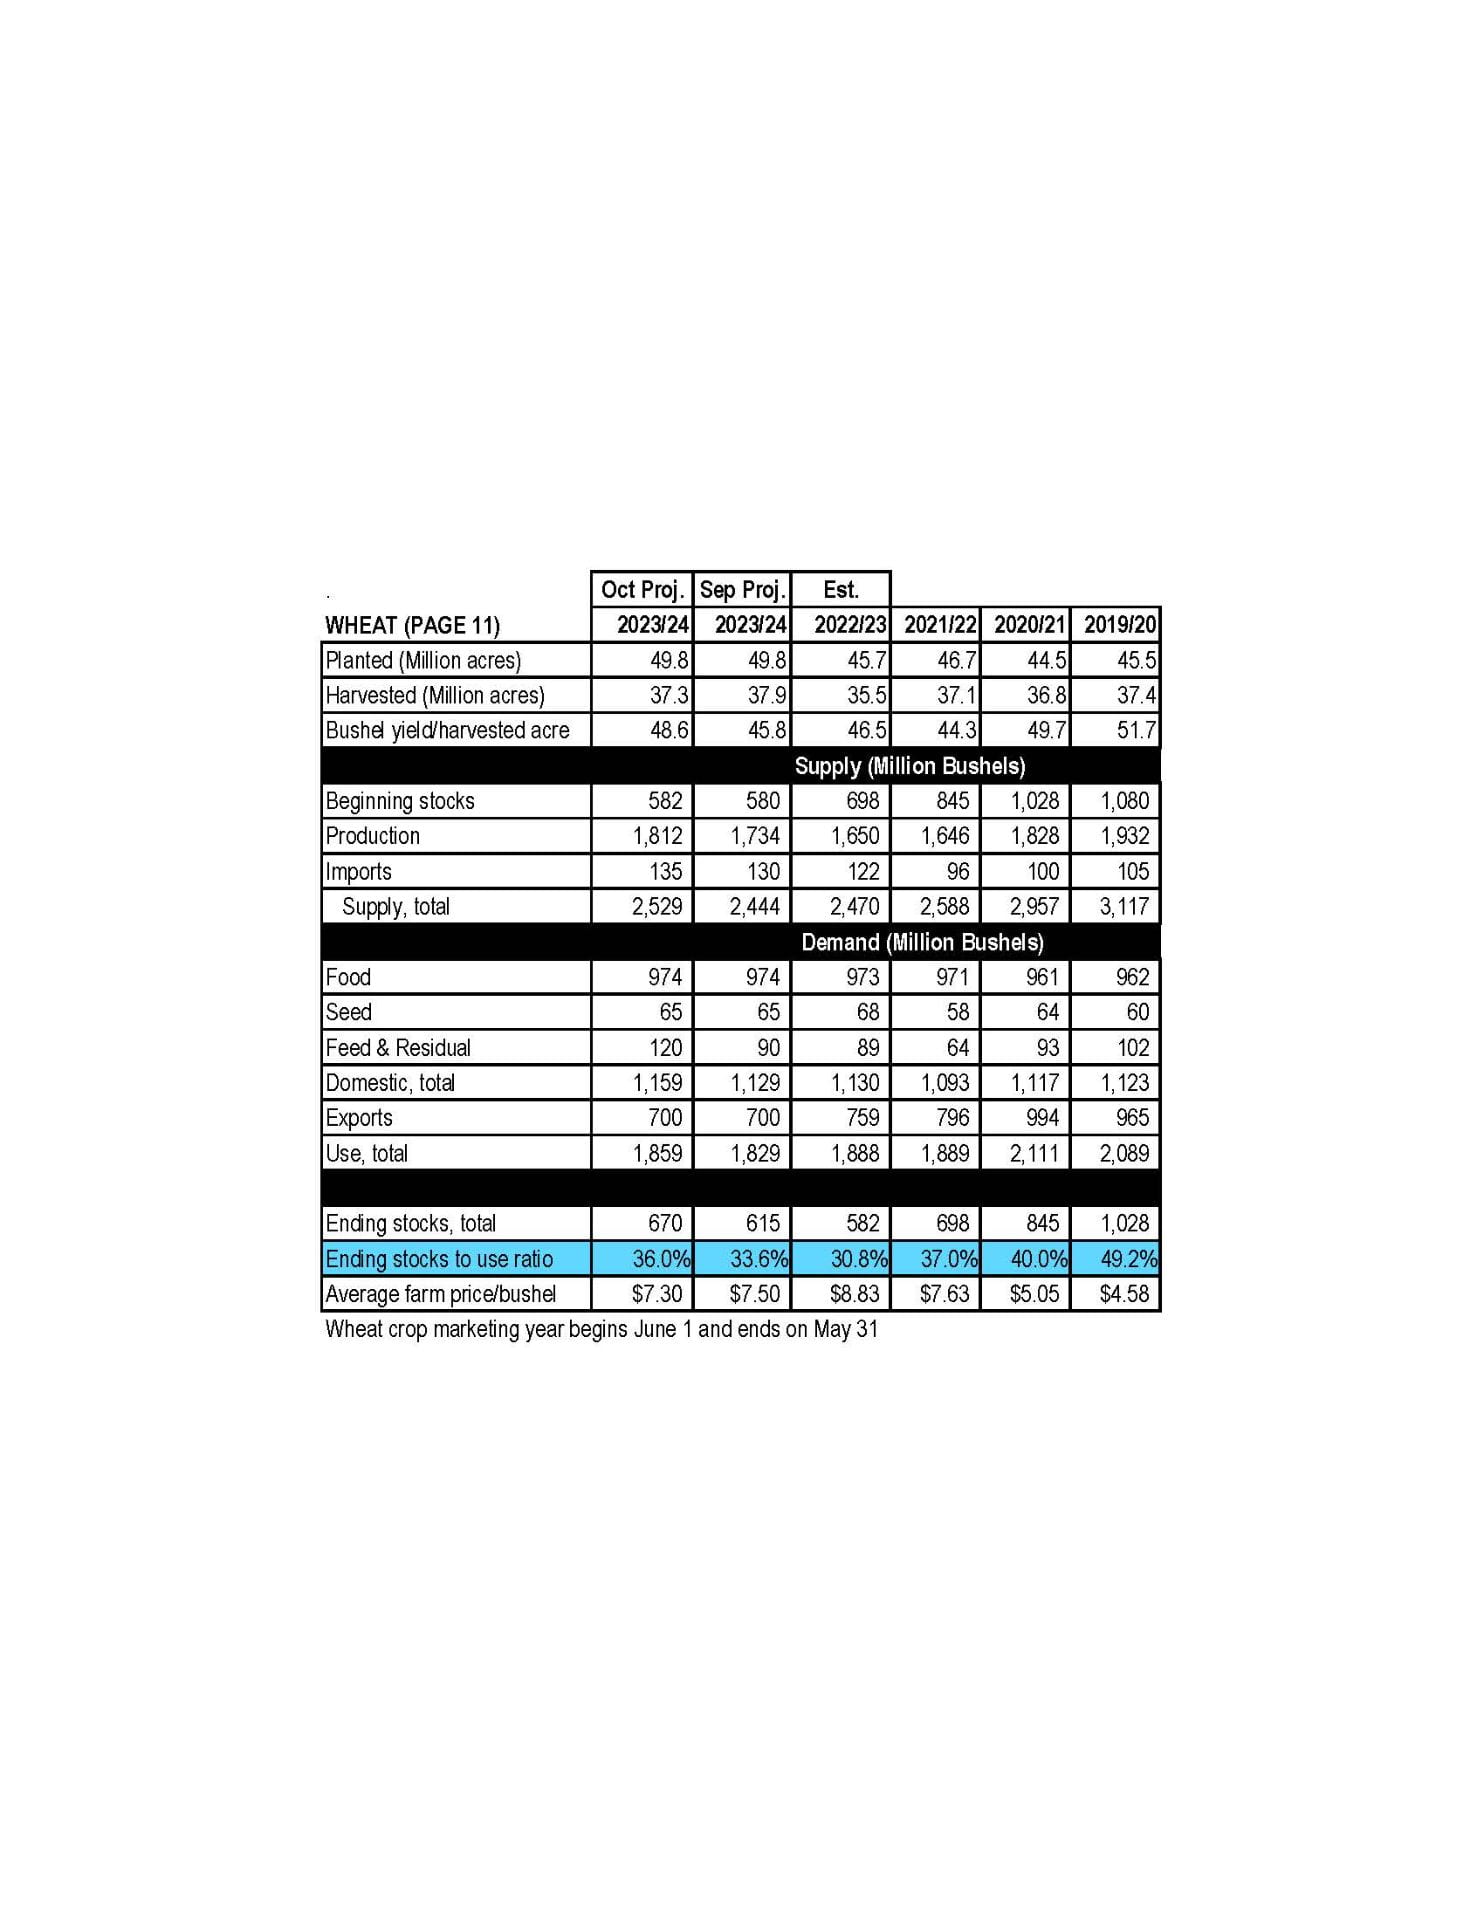
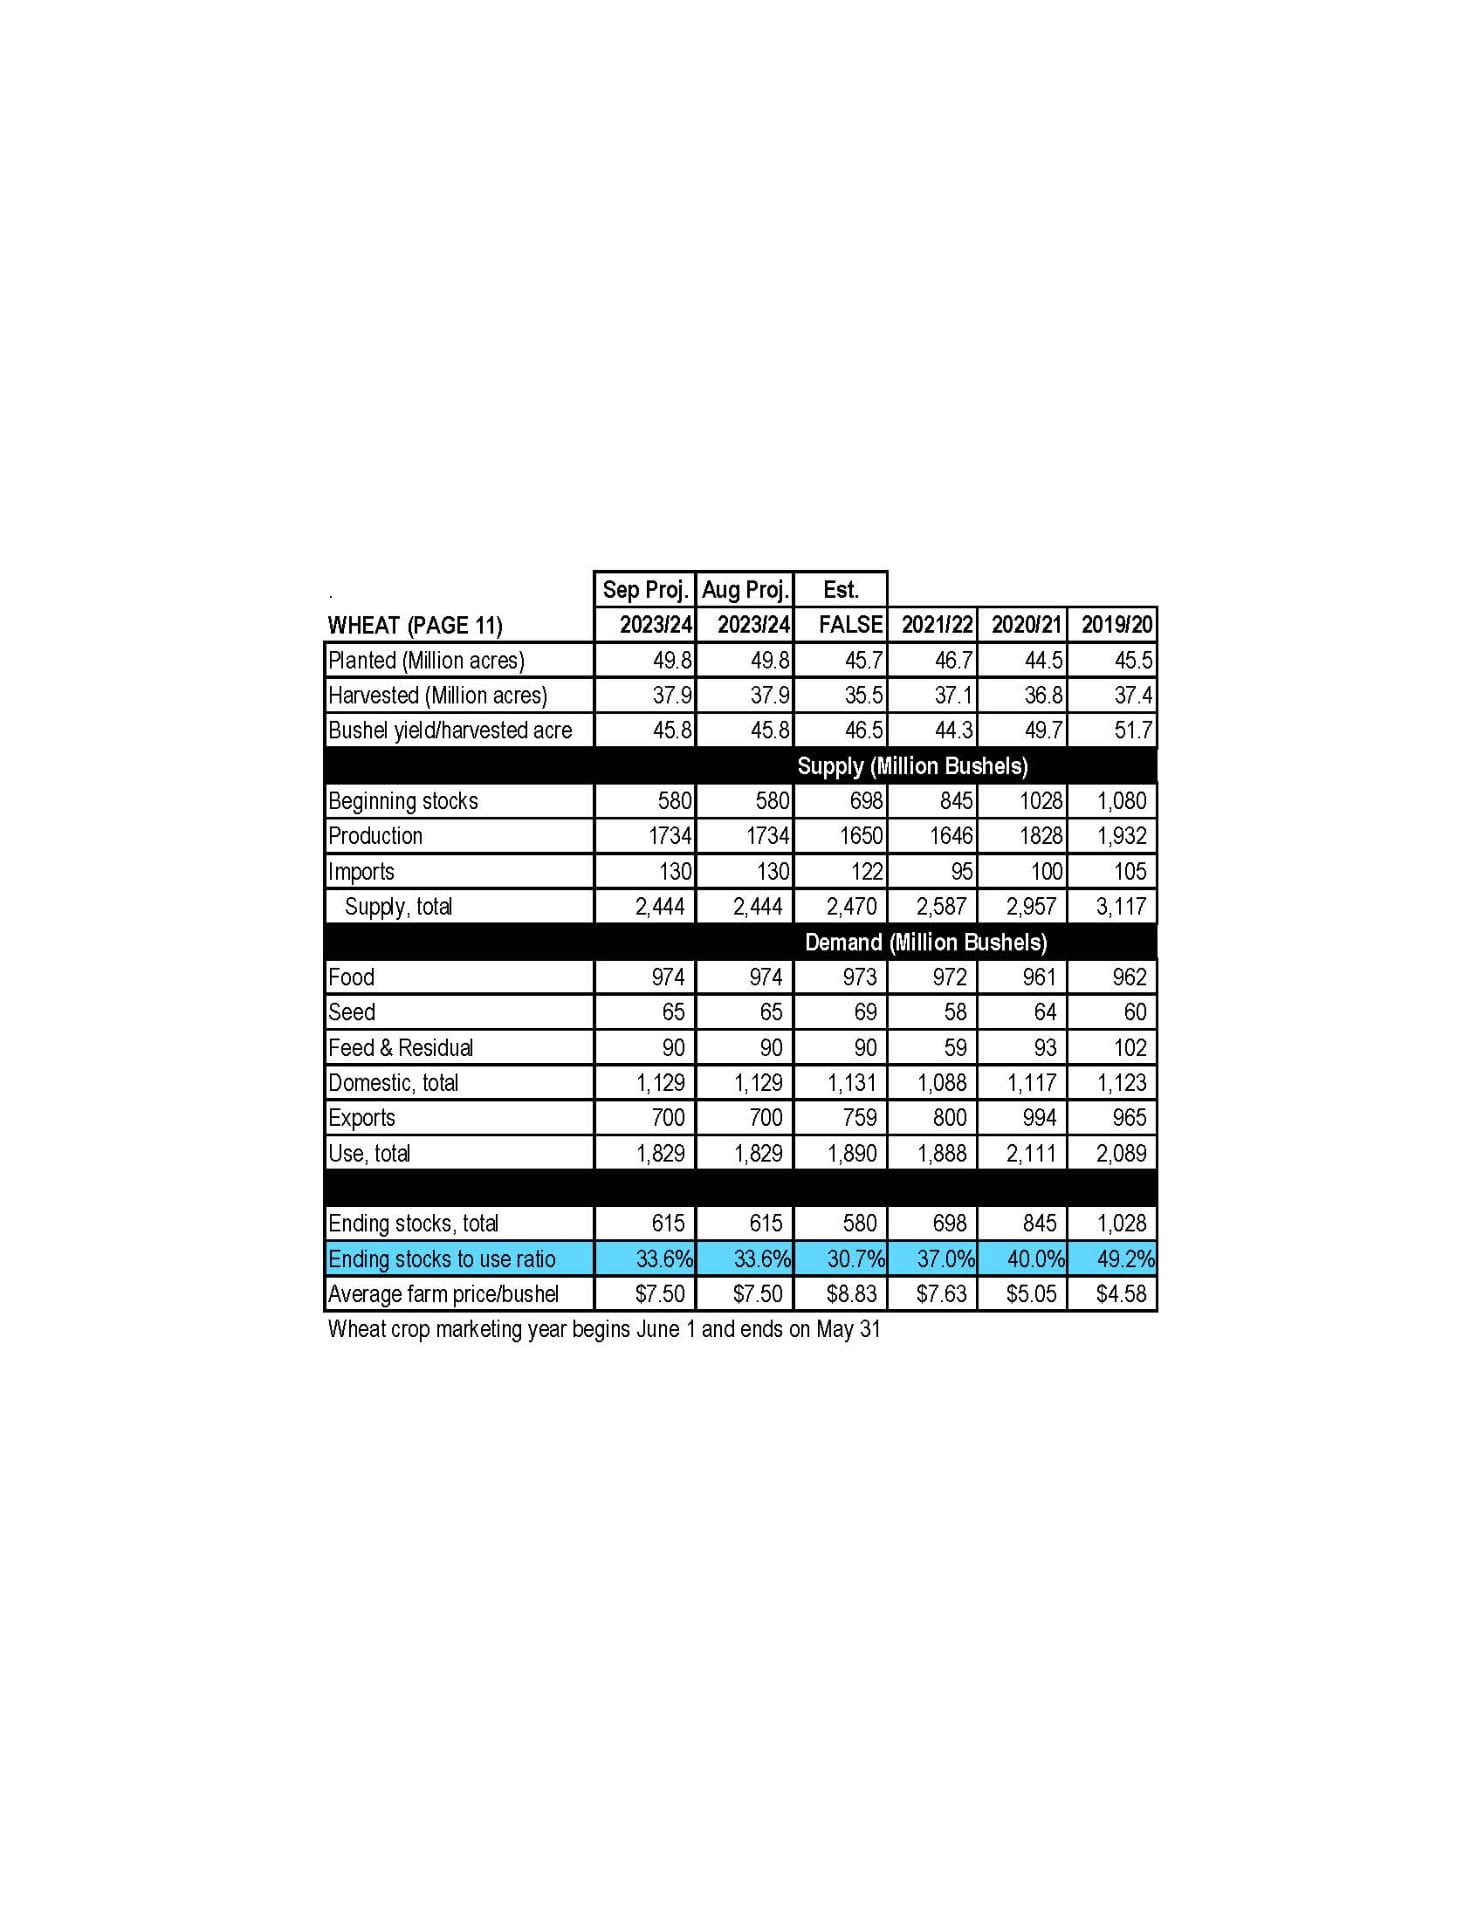
A common metric that evaluates how efficiently we use the crop we grow is the Ending Stocks-to-Use (S/U) ratio derived from the USDA World Agricultural Supply and Demand Estimate (WASDE) each month. Currently, the USDA projects the 2024/25 ending stocks (that which we will not use from the crop we’re about to plant) at 2.53 billion bushels and an S/U ratio of 17.2%–a level we have not seen since the 2006 when corn traded at an average price of $2.62/bu. This current 2023/24 marketing year (ending Sept. 1, 2024) is currently pegged at 14.9% S/U ratio–well higher than the 7-10% range of the last three years and the 12.6% historical average.

The soybean side of things is only marginally better and certainly not rosy by any stretch. The current S/U ratio projection for this year’s crop is 9.9% with the current marketing year sitting at 7.6%. Both these figures are a far cry from the burdensome supplies we accrued during the 2018-2019 trade war with China (22.9% S/U) yet they signal a surplus of soybeans.

Market Movers

With the current fundamentals dreary at best, it’s pleasant to think of those things that could actually help prices higher.

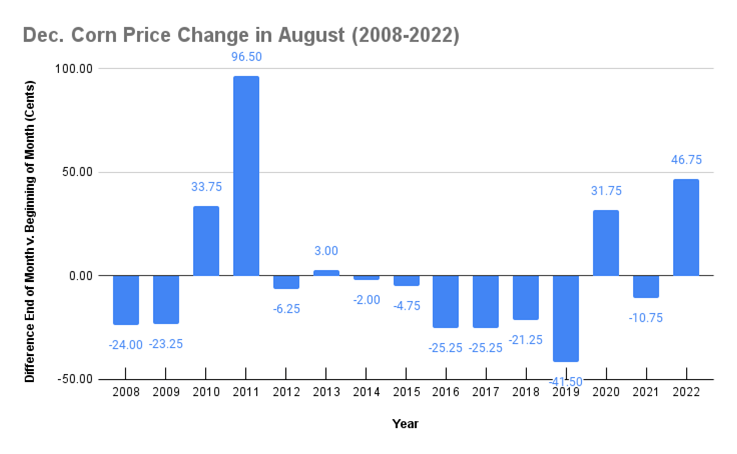
  1. Midwestern drought conditions continue to worsen throughout the growing season. US weather conditions are a significant driver of price action in the growing season–as exemplified by last year. Currently, some of the Midwest is experiencing a moderate drought, with some agronomists questioning the subsoil moisture levels before planting. Importantly, drought conditions would have to persist throughout the growing season well past planting. Generally, drought is bearish to corn in April and May as Midwest growers can plant at a breakneck pace just in time for timely rains that pull yields higher and prices lower. As evidenced by last year, corn did not rally until late-May over weather concerns and in 2012, corn did not rally until mid-June. Both these years indicate that prices will likely stay mixed until real concern over crop condition emerges during the growing season.
  2. The South American (Brazil + Argentina) soybean production is lower than expected, improving export demand for U.S. soybeans. Soybean harvest in Brazil is nearing completion, however final production estimates remain volatile. The same is true with South American corn production: a supply-side shock could support U.S. corn prices. Brazil has completed corn planting this last week of its large safrinha corn crop. Currently, much of the key corn growing regions are in a minor drought or have experiences greater than normal rainfall. More serious and persistent crop-damaging weather events could certainly be a boon to the U.S. market.
  3. Recently, the Federal Reserve signaled that it will likely keep the Federal Funds rate higher for longer–increasing borrowing costs. If this holds true, investors may find themselves less attracted to debt and equity markets as companies may have a more difficult time generating earnings. Instead, investors may revert back to commodities–a market often seen as a hedge against inflation–as they did in 2022. As mentioned above, this may trigger a significant unwinding of short positions which could carry the market to higher prices. Unfortunately, this is likely the most unlikely scenario for increasing commodity prices as equities soar to all time highs in recent weeks.

So What Can We Do About It? 

Marketing grain in 2024 will likely be challenging on all fronts. Put another way, given the current outlook, it is incredibly unlikely that selling grain in the fall at harvest prices will be a winning strategy. Similarly, it’s unlikely that an unhedged, unpriced JFM ‘25 sale will offer anything better as there are additional storage costs involved. That said, developing a preharvest marketing strategy may very well be a key to success this marketing season. Betting on the aforementioned weather stories is hardly a marketing plan.

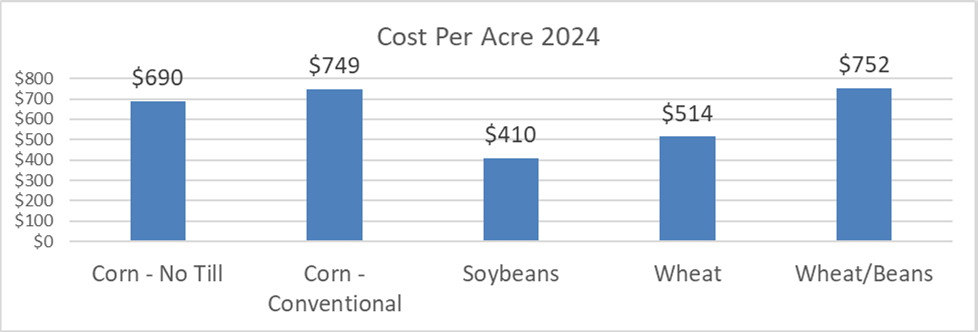
Like every year the first step is knowing your cost of production inside and out. Marketing opportunities will present themselves, but it will take knowing what is and what is not a good price. With today’s relatively high input costs, “yielding your way out” of low prices is more challenging than previous years. Therefore it may be more crucial than ever to make judicious agronomic decisions.

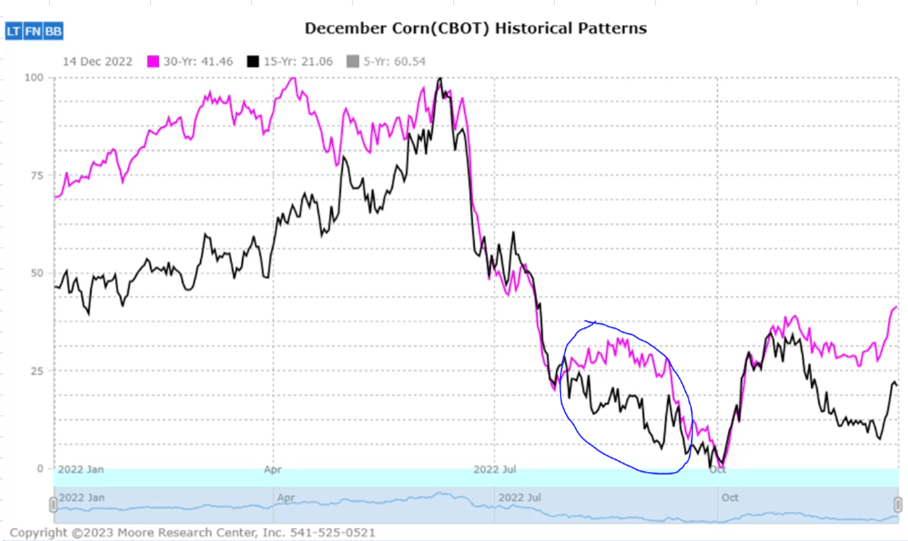
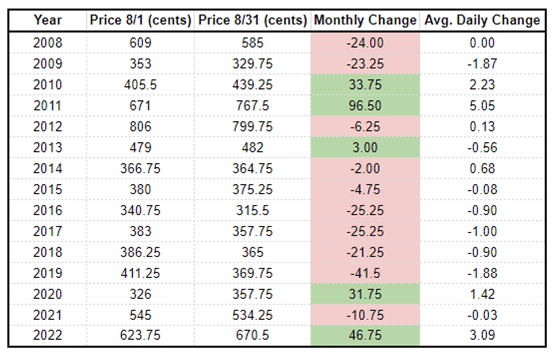
Take advantage of seasonal market patterns. Generally speaking, we see 3-6% increase in corn and soybean prices between mid-March and late-May from their post-harvest lows in January. As old crop marketing wanes, and concerns over the current year’s crop emerges (like the weather), prices rise slowly during this time. It may be best to price some grain sooner rather than later to take advantage of this general trend. Put it more directly; from May 1st to October 1st, corn prices fall more than $0.30, 74% of the time. Would you bet on something weighted 75% against you?

Track local basis. Generally, basis tends to follow broader market conditions especially when it comes to spreads between nearby and more distant contracts. Seasonal trends in basis also exist with harvest often being the low point and spring generally higher.

Keep a watchful eye on the markets this season. It may be such that prices are favorable for a day or two before they fall back lower.

Please also consider attending a University of Maryland Extension grain marketing meeting. These meetings are filled with all the above strategies, general information, and more that could help you with your marketing decisions.

Best of luck to you all. Here’s to blue skies and high prices!

Footnotes & References:

1 This may seem counter-intuitive. For a review on futures contracts please visit CME’s Self Study Guide to Hedging with Grain and Oilseed Futures and Options.

2 https://en.wikipedia.org/wiki/GameStop_short_squeeze

UMD Grain Marketing Site Updated for 2024: Field Crop Budgets

Shannon Dill, Principal Agriculture Agent | sdill@umd.edu
University of Maryland Extension, Talbot County

The University of Maryland Extension has updated www.go.umd.edu/grainmarketing site with new input data and spray programs for the 2024 field crop budgets.

Crop Budgets

Cost of production is very important when making decisions related to your farm enterprise and grain marketing. Preliminary surveys from 2024 UME Winter Crop Production meetings report 66% of farmers believe input costs are the greatest challenges facing their farm operation. Enterprise budgets provide valuable information regarding individual enterprises on the farm. This tool enables farm managers to make decisions regarding enterprises and plan for the coming production year. An enterprise budget uses farm revenue, variable cost, fixed cost, and net income to provide a clear picture of the financial health of each farm enterprise.

The 2024 Maryland enterprise budgets were developed using average yields and estimated input costs based on producer and farm supplier data. Fertilizer prices, pesticide availability, and fuel expenses have fluctuated greatly. The figures presented are averages and vary greatly from one farm and region to the other. It is, therefore, crucial to input actual farm data when completing enterprise budgets for your farm.

Cost Per Acre, 2024
Year Corn

No Till

Corn

Conventional

Soybeans Wheat Wheat/Beans
2021 $540 $592 $346 $401 $608
2023 $736 $800 $423 $538 $800
2024 $690 $749 $410 $514 $752
Difference 23-24 -$46 -$51 -$13 -$24 -$48
Percent Change -6% -6% -3% -4% -6%

How to Use University Enterprise Budgets

The enterprise budgets can be used as a baseline for your operation, and you can change these budgets to include your production techniques, inputs, and overall management. The budgets are available electronically in PDF or Excel. Use this document as a start or reference to create your crop budgets. Contact information is on the website if you have problems downloading any information.

2024 Crop Summary

Cost per acre expenses for 2024 have decreased a small amount from 2023 record highs. Based on estimates received cost of production includes: corn no-till costs $690 per acre, corn conventional $749 per acre, soybeans $410 per acre and wheat $514 per acre. While these are slightly (3-6%) lower than 2023 they are still 16%-22% higher than prices just 3 years ago (2021).

Optimizing Early Season Pest Management for Maryland Field Corn

Maria Cramer, PhD Candidate and Kelly Hamby, Entomology Extension Specialist
Department of Entomology, University of Maryland

Background

Research Questions

  1. Are the NST Poncho 250® and the in-furrow pyrethroid Capture LFR® effective at controlling pests and increasing yield in high-input (Bt) or low-input (non-Bt) field corn in Maryland?
  2. Do Poncho and Capture hurt slug predators and flare up slug damage?

Study Design

In order to capture the range of pest pressures and growing conditions in Maryland, we replicated our study across 3 UMD research farms (Keedysville, Beltsville, and Queenstown) and over 3 years (2020-2022). At each location we planted one field of a Bt hybrid and one field of a similarly-yielding non-Bt hybrid as early as possible in the growing season (Table 1). In 2020 our Bt hybrid was LC1196 VT2P (Local Seed, Memphis, TN) which expresses Cry1A.105/Cry2Ab2 proteins. In 2021 and 2022 we planted P1197YHR (Pioneer Hi-bred International. Johnston, IA) which contains Cry1Ab and Cry1F proteins. We planted P1197LR (Pioneer Hi-bred International, Inc. Johnston, IA) for our non-Bt hybrid all three years. All hybrids had excellent yield potential and were grown with standard no-till practices. In each field we established 3 replicates of 3 treatments at planting: 1) an untreated control, with bare seed and no in-furrow product, 2) an in-furrow pyrethroid treatment using Capture LFR® (active ingredient: bifenthrin, rate: 13.6 fl oz/acre), and 3) an NST treatment using Poncho® (active ingredient: clothianidin, rate: 0.25 mg/seed). Each replicate consisted of 24 rows of corn at 30 inch row spacing, and was 200 feet long.

Year Location Planting date Sampling dates
2020 Keedysville May 18 June 8
Beltsville May 21 June 10
Queenstown May 13 June 3 and 4
2021 Keedysville May 14 June 1 and 3
Beltsville May 17 June 2
Queenstown May 4 May 25 and 26
2022 Keedysville May 26 June 10
Beltsville June 2 June 21
Queenstown May 12 May 31

Question 1: Are the NST Poncho 250® and the in-furrow pyrethroid Capture LFR® effective at controlling pests and increasing yield in high-input (Bt) or low-input (non-Bt) field corn in Maryland?

Data Collection

In order to evaluate how the treatments affected pest pressure, we visually sampled V2-V3 corn for types of pest damage (Figure 1), recording the number of plants and area damaged. We counted the number of healthy and stunted plants to determine if the treatments impacted stand. Because neonicotinoids can sometimes stimulate plant growth unrelated to pest damage7,8, we measured plant height to determine if plant growth was impacted by either treatment. At the end of the growing season, we measured stand again and harvested the corn to collect yield data.

Figure 1. Diagnostic seedling pest damage: a) soil pest, b) cutworm, c) armyworm, d) slug, e) stinkbug, f) miscellaneous feeding damage from a spotted cucumber beetle.

Results and Takeaways for Question 1

Poncho reduced insect damage more consistently than Capture LFR (in both Bt and non-Bt corn) and increased Bt corn stand. Capture LFR sometimes reduced insect damage (in non-Bt corn), but never improved stand.

We compared the number of seedlings with any type of pest damage between treatments and found that Poncho decreased damage about 62% in Bt corn and about 66% in non-Bt corn (Figure 2a and 2b). Compared to the control, Capture did not reduce damage in the Bt corn, but did reduce damage by about half in the non-Bt. Poncho increased stand about 8% compared to control in the Bt corn (25,731 ± 456 plants per acre and 23,623 ± 714 plants per acre, respectively), but did not improve it for non-Bt. Capture did not impact stand for either Bt or non-Bt corn.

Figure 2. Mean % ± SE of seedling A) Bt and B) non-Bt corn plants damaged by pests. Data were collected across three UMD research farms from 2020-2022. Within each graph, treatment bars with different letter above them are significantly different from each other.

There were no yield benefits from using either insecticide in either corn. This was likely due to a lack of economic pest pressure.

Non-Bt and Bt yields were the same across treatments (Figure 3A and 3B). This was probably because pest pressure was so low. Even though Poncho and Capture decreased pest damage, pests were below treatment thresholds—for example, armyworm damage in the control ranged from 0% to 5.4% of Bt plants, and 0% to 22.9% of non-Bt plants, in both cases below the treatment threshold of 35%9. Cutworm damage was similarly low ranging from 1% to 6.3% in Bt control and 0.5% to 3.8% in non-Bt control, also below the treatment threshold of 10% feeding damage9.

Figure 3. Mean yield ± standard error in bushels per acre corrected to 15.5% moisture of A) Bt corn and B) non-Bt corn. Yield data from 2020-2022 across three UMD research farms. Treatments did not significantly impact yield.

Takeaway: Pest pressure and yield were similar between the Bt and non-Bt varieties, and non-Bt yielded well without any insecticides. In general, without pre-existing pest problems in a given field, at-planting insecticides are unlikely to pay off in Maryland.

Question 2: Do Poncho and Capture hurt slug predators and flare up slug damage?

Data Collection

To assess the effect of treatments on slug biocontrol agents, we measured slug predatory ground beetles and predation. We measured predatory beetles with pitfall traps for three consecutive weeks. Because the predators that eat slugs also attack caterpillars, we used sentinel caterpillars to see how much predation was occurring (Figure 4). We placed sentinel caterpillars in the plots overnight, collected them the following morning, and assessed signs of damage from predators. To determine if slugs were flared up by the treatments, we measured slug abundance once a week for 6 weeks beginning between 14 to 21 days after planting and measured slug-damaged seedlings during V2-V3.

Figure 4. Sentinel caterpillars placed in field overnight and collected in the morning to determine predator activity.

Results and Takeaways for Question 2

Predation on sentinel caterpillars was not decreased by insecticides.

We measured the percent of sentinel prey that were damaged by predators overnight (Figure 5) and saw no relationship between treatment and predation rates (Figure 6). This suggests that the insecticides did not decrease predator activity in treated plots. We did generally see some level of predation all weeks at our locations, indicating that predators are usually present in seedling corn.

Figure 5. Top: predators feeding on sentinel prey. Bottom: examples of damaged prey proportions. Images: M. Cramer, University of Maryland.
Figure 6. Mean ± SE % sentinel prey caterpillars consumed across three UMD research farms from 2020-2022. Control, Capture, and Poncho did not significantly differ.

Predator abundance was not altered by insecticides.

When we measured the weekly counts of ground beetles, we found similar results between treatments. This was true when we looked at all ground beetles (predators, omnivores, and seed-eaters), as well as when we looked only at predatory beetles (Figure 7A and 7B).

Figure 7. Mean ± SE count of A) all ground beetles, and B) specifically predatory ground beetles, caught per week in pitfall traps across three UMD research farms from 2020-2022. No significant differences.

Slug natural enemies did occur throughout the study, suggesting that biocontrol could be more intentionally leveraged.

The two most abundant ground beetle species in our study were both predators. One of these species, Chlaenius tricolor (Figure 8) is a slug predator that consumes slugs in agricultural ecosystems5,10. Although its abundance was not affected by treatments, it was present at all locations in all years, suggesting that it is a particularly important slug natural enemy in Maryland crops.

Figure 8. Chlaenius tricolor, a slug predator that was found throughout the study. Photo credit: ©Molanic 2023: https://www.inaturalist.org/photos/314013175.

Neither insecticide increased slug abundance or slug damage.

If treatments had negatively affected predators, we would expect to see more slugs and damage in the insecticide plots. However, when we compared slug counts between treatments, we found that the insecticide treatments were not different from the control (Figure 9). Slug damage to the seedling corn was also similar across the control and insecticide treatments (Figure 10).

Figure 9. Mean number of slugs per replicate plot ± SE the week closest to seedling sampling across three UMD research farms from 2020-2022. No significant differences.
Figure 10. Mean ± SE % of corn seedlings damaged by slugs across three UMD research farms from 2020-2022. Control. No significant differences.

While slugs can be damaging in many crops, the worst slug damage in our study did not affect corn stand or yield, suggesting that corn is generally tolerant of slug damage at the levels we observed in this study.

Slug damage was scarce across years and locations except in 2021 at Keedysville. Even in that case where a high proportion of seedlings (42% ± 4% on average) were damaged by slugs, we did not see an associated decrease in stand or yield. Corn seedlings were able to outgrow the slug damage as the weather warmed, even when they appeared severely defoliated. The seedling resilience we observed is supported by work on hail damage in corn which shows that as long as the growing point is intact, corn can regrow from complete defoliation11.

Even though we did not see non-target effects in this study, both pyrethroids and neonicotinoids can decrease natural enemies in crop fields6,12–14.

Acknowledgments

We would like to thank the farm managers and staff of WYEREC, WMREC, and CMREC Beltsville for their expertise and assistance. We would also like to thank the Hamby lab’s many undergraduate researchers for helping complete this project with all their hard work.

Sources:

  1. Kullik, S. A., Sears, M. K. & Schaafsma, A. W. Sublethal Effects of Cry 1F Bt Corn and Clothianidin on Black Cutworm (Lepidoptera: Noctuidae) Larval Development. J. Econ. Entomol. 104, 484–493 (2011).
  2. North, J. H. et al. Value of neonicotinoid insecticide seed treatments in mid-south corn (Zea mays) production systems. J. Econ. Entomol. 111, 187–192 (2018).
  3. Reisig, D. & Goldsworthy, E. Efficacy of Insecticidal Seed Treatments and Bifenthrin In-Furrow for Annual White Grub, 2016. Arthropod Manag. Tests 43, 1–2 (2017).
  4. Sappington, T. W., Hesler, L. S., Clint Allen, K., Luttrell, R. G. & Papiernik, S. K. Prevalence of sporadic insect pests of seedling corn and factors affecting risk of infestation. J. Integr. Pest Manag. 9, (2018).
  5. Douglas, M. R., Rohr, J. R. & Tooker, J. F. Neonicotinoid insecticide travels through a soil food chain, disrupting biological control of non-target pests and decreasing soya bean yield. J. Appl. Ecol. 52, 250–260 (2015).
  6. Dubey, A., Lewis, M. T., Dively, G. P. & Hamby, K. A. Ecological impacts of pesticide seed treatments on arthropod communities in a grain crop rotation. J. Appl. Ecol. 57, 936–951 (2020).
  7. Ding, J. et al. Thiamethoxam, clothianidin, and imidacloprid seed treatments effectively control thrips on corn under field conditions. J. Insect Sci. 18, (2018).
  8. Preetha, G. & Stanley, J. Influence of neonicotinoid insecticides on the plant growth attributes of cotton and okra. J. Plant Nutr. 35, 1234–1245 (2012).
  9. Flessner, M. & Taylor, S. V. 2021 Field Crops Pest Management Guide. Virginia Cooperative Extension (2021) doi:10.1016/B978-0-12-394807-6.00031-9.
  10. Eskelson, M. J., Chapman, E. G., Archbold, D. D., Obrycki, J. J. & Harwood, J. D. Molecular identification of predation by carabid beetles on exotic and native slugs in a strawberry agroecosystem. Biol. Control 56, 245–253 (2011).
  11. Thomason, W. & Battaglia, M. Early defoliation effects on corn plant stands and grain yield. Agron. J. 5024–5032 (2020) doi:10.1002/agj2.20402.
  12. Disque, H. H., Hamby, K. A., Dubey, A., Taylor, C. & Dively, G. P. Effects of clothianidin-treated seed on the arthropod community in a mid-Atlantic no-till corn agroecosystem. Pest Manag. Sci. 75, 969–978 (2019).
  13. Bhatti, M. A. et al. Field Evaluation of the Impact of Corn Rootworm (Coleoptera: Chrysomelidae)–Protected <I>Bt</I> Corn on Foliage-Dwelling Arthropods. Environ. Entomol. 34, 1336–1345 (2006).
  14. Taravati, S., Mannion, C., McKenzie, C. & Osborne, L. Lethal and Sublethal Effects of Selected Systemic and Contact Insecticides on Nephaspis oculata (Coleoptera: Coccinellidae), in a Tri-Trophic System. J. Econ. Entomol. 112, 543–548 (2018).

2023 Maryland Corn Hybrid Trial Results

Nicole Fiorellino, Extension Agronomist | nfiorell@umd.edu
University of Maryland, College Park

Please find attached a copy of the 2023 Corn Hybrid Trials results performed annually at multiple UMD Research and Education Centers. The factsheet can also be downloaded from the MD Crops website at https://psla.umd.edu/extension/md-crops. Many thanks to Louis Thorne and Joe Crank for their leadership and management of the trials, from seed organization, to planting, to harvest. These trials could not be completed without them.

We are grateful for the funding provided by Maryland Grain Producers Utilization Board to support these trials. MGPUB provides our program with checkoff funding to support applied agricultural research and generate results that directly benefit Maryland producers.

For more information on how to interpret and utilize hybrid/variety trial data, check out our fact sheet, What do the numbers really mean? Interpreting variety trial results.

Click here to download the 2023 corn hybrid results

October 2023 Grain Market Update

Information from USDA WASDE report

Attached is the summary for the October 2023 WASDE.

Corn

This month’s 2023/24 U.S. corn outlook is for reduced supplies, lower feed and residual use and exports, and smaller ending stocks. Corn production is forecast at 15.064 billion bushels, down 70 million on a cut in yield to 173.0 bushels per acre. Corn supplies are forecast at 16.451 billion bushels, a decline of 160 million bushels from last month, with lower production and beginning stocks. Exports are reduced by 25 million bushels reflecting smaller supplies and slow early-season demand. Feed and residual use is down 25 million bushels based on lower supply. With supply falling more than use, corn ending stocks for 2023/24 are lowered 110 million bushels. The season-average corn price received by producers is raised 5 cents to $4.95 per bushel.

Soybean

Soybean production is forecast at 4.1 billion bushels, down 42 million on lower yields. Harvested area is unchanged at 82.8 million acres. The soybean yield is projected at 49.6 bushels per acre, down 0.5 bushels from the September forecast. The largest production changes are for Kansas, Michigan, and Nebraska. With lower production partly offset by higher beginning stocks, supplies are reduced 24 million bushels. Soybean exports are reduced 35 million bushels to 1.76 billion with increased competition from South America. Soybean crush is projected at 2.3 billion bushels, up 10 million, driven by higher soybean meal exports and soybean oil domestic demand. Soybean oil domestic use is raised in line with an increase for 2022/23. With lower exports partly offset by increased crush, ending stocks are unchanged from last month at 220 million bushels. 

Wheat

The outlook for 2023/24 U.S. wheat this month is for higher supplies, increased domestic use, unchanged exports, and higher ending stocks. Supplies are raised 85 million bushels, primarily on higher production as reported in the NASS Small Grains Annual Summary, released September 29. Domestic use is raised 30 million bushels, all on higher feed and residual use. The NASS Grain Stocks report released September 29 indicated a higher year-to-year increase for first quarter (June-August) domestic disappearance than previously expected. Exports remain at 700 million bushels with several offsetting by-class changes. Projected ending stocks are raised by 55 million bushels to 670 million, up 15 percent from last year. The season average farm price is reduced $0.20 per bushel to $7.30 on higher projected stocks and expectations for futures and cash prices for the remainder of the marketing year.

Tar Spot Confirmed in Additional Counties in Maryland

Andrew Kness, Senior Agriculture Agent | akness@umd.edu
University of Maryland Extension, Harford County

During the month of September we have confirmed the presence of tar spot of corn in four additional counties in Maryland. Fields with tar spot in Queen Anne’s and Kent County were found on September 19, Baltimore County on September 22, and Caroline County on September 25, and Dorchester County on October 6. This brings the confirmed distribution from Carroll County east to Cecil and south on the shore to Dorchester County (Figure 1). In my scouting travels a few weeks ago on the eastern shore, I was able to find tar spot in two out of a dozen fields that I visited.

Figure 1. Tar spot confirmed distribution as of October 9, 2023. Map downloaded from https://corn.ipmpipe.org/tarspot/.

Note that this is the confirmed distribution—this is not to say that you will not find it outside of these reported counties; as a matter of fact, I’d be surprised if it’s not out there in several other areas across the state. As you harvest corn this fall, it might not be a bad idea to hop out of the cab and check around. Tar spot can still be visible on dry, senesced tissue. The signs of tar spot are dark black, raised spots that resemble spattered black paint (Figure 2). These spots are the reproductive structures of the fungus, Phyllachora maydis. These structures, called stromata, are embedded in the leaf tissue, are slightly raised (visible under a hand lens), and cannot be rubbed or scratched off the leaf.

Figure 2. Signs of tar spot on corn.

When you are scouting you may notice several look-alikes that can fool you. Insect frass (poop) is one that looks very similar but you can wipe the spots off the leaf. You may also notice other fungi present on senesced tissue, giving the leaves a black appearance. These fungi are not tar spot but are instead secondary decomposers—i.e. they colonize dead plant tissue. You can distinguish these fungi from tar spot by looking closely at the spots. Tar spot will be strikingly dark black against the dead tissue and slightly raised, whereas these secondary fungi are less distinct and not raised (Figure 3). Also, tar spot infections start on green tissue that is still alive, so check the few green leaves that are still present for signs.

Figure 3. Tar spot on a senesced corn leaf vs. look-a-likes. Stromata are still easily visible on dead leaves. Dull, faded/blurred spots are not tar spot.

As far as management considerations for this year and moving into 2024: tillage has varied success and generally has very little effect on tar spot. While tar spot does overwinter on old crop residue and tillage can help accelerate residue decomposition, research from the Midwest has shown highly inconsistent responses to tillage for managing tar spot. A couple of reasons for this is because tar spot can be wind-blown short distances; and with the concentration of corn fields present in many areas of the state, inoculum can blow into “clean” fields from nearby infected fields. Another reason that tillage doesn’t have a major effect is because most tillage equipment (besides a moldboard plow) leaves at least some residue on the soil surface. Those exposed crop residues can be enough to get an infection started the following year.

A more effective management tactic to consider is hybrid genetics. While there is no complete resistance to tar spot, there are hybrids that tolerate it much better than others. Using more resistant hybrids next year can help manage this disease, especially in fields where you suspect that tar spot could be an issue. In addition, you can use planting date and hybrid maturity to your advantage. The combination of early planting and a early-maturing hybrids can be used to “avoid” tar spot infections by having corn beyond its critical growth stages (VT-R2) before cooler weather sets in later in the season, which is favorable to tar spot infection.

If you find tar spot in your fields, please report it by emailing akness@umd.edu or submitting a report at https://corn.ipmpipe.org/reporting-form/.

September 2023 Grain Market Update

Dale Johnson, Farm Management Specialist
University of Maryland

Information from USDA WASDE report

Attached is the summary for the September 2023 WASDE.

Corn

This month’s 2023/24 U.S. corn outlook is for slightly larger supplies and ending stocks. Projected beginning stocks for 2023/24 are 5 million bushels lower based on mostly offsetting trade and corn used for ethanol changes for 2022/23. Corn production for 2023/24 is forecast at 15.1 billion bushels, up 23 million from last month as greater harvested area more than offsets a reduction in yield. The national average yield is forecast at 173.8 bushels per acre, down 1.3 bushels. Harvested area for grain is forecast at 87.1 million acres, up 0.8 million. Total U.S. corn use is unchanged at 14.4 billion. With supply rising slightly and use unchanged, ending stocks are up 19 million bushels to 2.2 billion. The season-average corn price received by producers is unchanged at $4.90 per bushel.

Soybeans

U.S. soybean supply and use changes for 2023/24 include lower beginning stocks, production, crush, exports, and ending stocks. Lower beginning stocks reflect an increase for exports in 2022/23. Soybean production is projected at 4.1 billion bushels, down 59 million with higher harvested area offset by a lower yield. Harvested area is raised 0.1 million acres from the August forecast. The soybean yield of 50.1 bushels per acre is down 0.8 bushels from last month. The soybean crush forecast is reduced 10 million bushels and the export forecast is reduced 35 million bushels on lower supplies. Ending stocks are projected at 220 million bushels, down 25 million from last month. The U.S. season-average soybean price is forecast at $12.90 per bushel, up $0.20 from last month. The soybean meal price is unchanged at $380 per short ton and the soybean oil price is raised 1.0 cent to 63.0 cents per pound. Other changes this month include higher peanut and lower cottonseed production.

Wheat

The 2023/24 U.S. all wheat outlook for supply and use is unchanged this month with offsetting by-class changes on exports. The projected 2023/24 season-average farm price is also unchanged at $7.50 per bushel.

Tar Spot Confirmed in Maryland for 2023

Andrew Kness, Senior Agriculture Agent | akness@umd.edu
University of Maryland Extension, Harford County

Figure 1. Regional map of tar spot of corn for the 2023 growing season. Map generated from ipmpipe.org/tarspot.

Tar spot of corn has been confirmed in Maryland for the 2023 growing season. The first report came from a field in Cecil county on August 22, followed by several additional reports in Harford and Carroll county (Figure 1).

Tar spot is a relatively new fugal disease of corn in the United States and it was confirmed for the first time in Maryland in August of 2022. As daytime and nighttime temperatures begin to decline, now is a good time to look for symptoms in your corn fields. Tar spot is favored by cooler temperatures (60-70s), as well as prolonged periods (7+ hours) of leaf wetness from rainfall, dew, or humidity. Tar spot can cause infected plants to senesce prematurely, which can adversely affect yield, especially if infection occurs early in the reproductive stages. Yield losses are not as severe if infection occurs later in the reproductive stages.

Tar spot spores overwinter in old corn crop residue and are deposited onto corn leaves via splashing rain or wind (spores are only wind-blown for very short distances). Once a spore lands on corn tissue, it will germinate and infect the plant as long as the environmental conditions remain conducive. After an incubation period of about 14-21 days, black reproductive structures, called stroma, are visible on the leaf surface (Figure 2). These structures resemble black paint or tar, hence the name “tar spot.”

Figure 2. Symptoms of tar spot on corn leaf. Black specks are the reproductive structures of the fungus.

If you find tar spot in your field, you may want to take precautions to try to prevent its spread during harvest, as you could potentially inoculate new fields by bringing infected residue into the next harvested field. If you’re harvesting an infested field, it would be a good idea to try to remove as much corn fodder off of the equipment before moving to the next field.

Preparations for managing tar spot in 2024 should start in the winter with good seed selection. If possible, choose hybrids with good tar spot resistance (there is no complete resistance); seed companies are starting to rate hybrids for their tar spot resistance/tolerance.

If you find tar spot in your field, I would be interested in knowing about it. We have a grant from the Maryland Grain Producer’s Utilization Board and one objective of the study is to determine the distribution of tar spot in Maryland. Call (410-638-3255) or email me (akness@umd.edu); or submit a report at corn.ipmpipe.org.

When Does Corn Rally in August?

Mark Townsend, Agriculture Agent Associate | mtownsen@umd.edu
University of Maryland Extension, Frederick County

All eyes have been on news headlines coming from the Black Sea for the last two to three weeks since the termination of the previous agreement between Russia and Ukraine. The escalation in the war between these two nations has seen drone strikes, missile engagements, and major destruction of Black Sea ports like Odessa in Ukraine. Traders have watched these headlines and acted accordingly in the market place as the price of corn and wheat retraced previous months losses.

However, a bull market needs a continuous stream of bullish news to continue the price momentum. Traders have since lost some interest in these headlines as there appeared to be a break in the action in the middle of last week. No less, the slow in headlines corresponded with a wetter weather outlook for many areas of the Midwest. The December corn market has fallen back to the low $5.00 mark; a price level seen in Mid-July following the rather bearish USDA planted acreage report.

With much of the US corn crop “made”, the trade may be moving beyond the volatile weather market observed these last two months. However the future is not so rosy either; August is typically a rather turbid month for the December Corn contract with traders seeking headlines of yield prospects, South American harvest updates, and South American planting intentions. With this, the goal of this excerpt is to help answer the question, “when does the corn market rally in August?”

Figure 1. Illustrating the general historical pattern of the December Corn contract. Credit: Moore Research Center, Inc.

As circled in blue, August tends to be rather choppy with rapid price movements throughout the month. Additionally, one can also observe a slight downward trend during this time period.

In evaluating December Corn historical price data, 10 of the last 15 years saw a decline in the corn price from the beginning of the month to the end of the month. On average, these years saw an average decline of $0.18 during this period, as well as a daily price change of about -$0.005/day.

Of the five years when corn did rise in August, three of which appear to be induced by the same phenomenon. The years 2011, 2013, and 2022 saw an August WASDE report indicating a lower corn yield than the July report of the same year. The August reports lowered the yield estimates by 5.7, 2.1, and 1.6 bu/ac respectively for 2010, 2013, and 2022.

The other year’s increase was the result of a catastrophic drought in Russia (2010) and a dramatic increase in export sales to China (2020).

With this being said, historically the USDA often changes the corn yield number in its August WASDE report. Last month’s report reduced the corn yield estimate by 4 bu/ac–an infrequent occurrence for the USDA to revise downward in July. In this, there may exist reason to believe that the August 2023 WASDE corn yield estimate will revise downward once more.

So to answer the question at hand, August rallies appear to come on the heels of pretty significant news: extreme crop failures, unprecedented demand, and lower than expected yields. Given our currently lackluster export demand and relatively high prices, a run on US corn appears rather unlikely. And though the Ukraine/Russia War appears to have disturbed the global supply chain for commodities, traders do not appear to trade these headlines for much longer. Currently, the US Corn crop ratings are the second worst observed since 2012 given the widespread drought across the corn belt. With this, pay close attention to the Aug 11, 2023 report as there could be a price movement with a potential yield revision.