Effect of Potash Fertility on Orchardgrass Yield

Andrew Kness, Senior Agriculture Agent | akness@umd.edu and Erika Crowl, Senior Agriculture Agent Associate
University of Maryland Extension

Orchardgrass is a popular pasture and hay forage species and it requires relatively high fertility levels, especially in a hay system where nutrients are being exported from the field. To test and demonstrate the importance of potash (potassium) fertility in orchargrass plantings, we established a replicated trial at the Western Maryland Research and Education Center. Three orchardgrass varieties were planted in a prepared seedbed at a seeding rate of 22 lbs pure live seed per acre using a drop-seeder on September 27, 2021. Plots were 6 feet wide by 20 feet long. Each variety received three fertility treatments: 1.) 0 lbs/A potash, 2.) 45 lbs/A potash (based on soil test), or 3.) 200 lbs/A potash, based on the potassium removal rate of 4 ton/A orchardgrass yield.

On March 23, 2022, 50 lbs/A nitrogen and 20 lbs/A phosphate (based on soil test) was top dressed to all plots. On April 8, 45 lbs/A potash (0-0-62) was top dressed on the 45 lb/A plots and 200 lb/A plots.

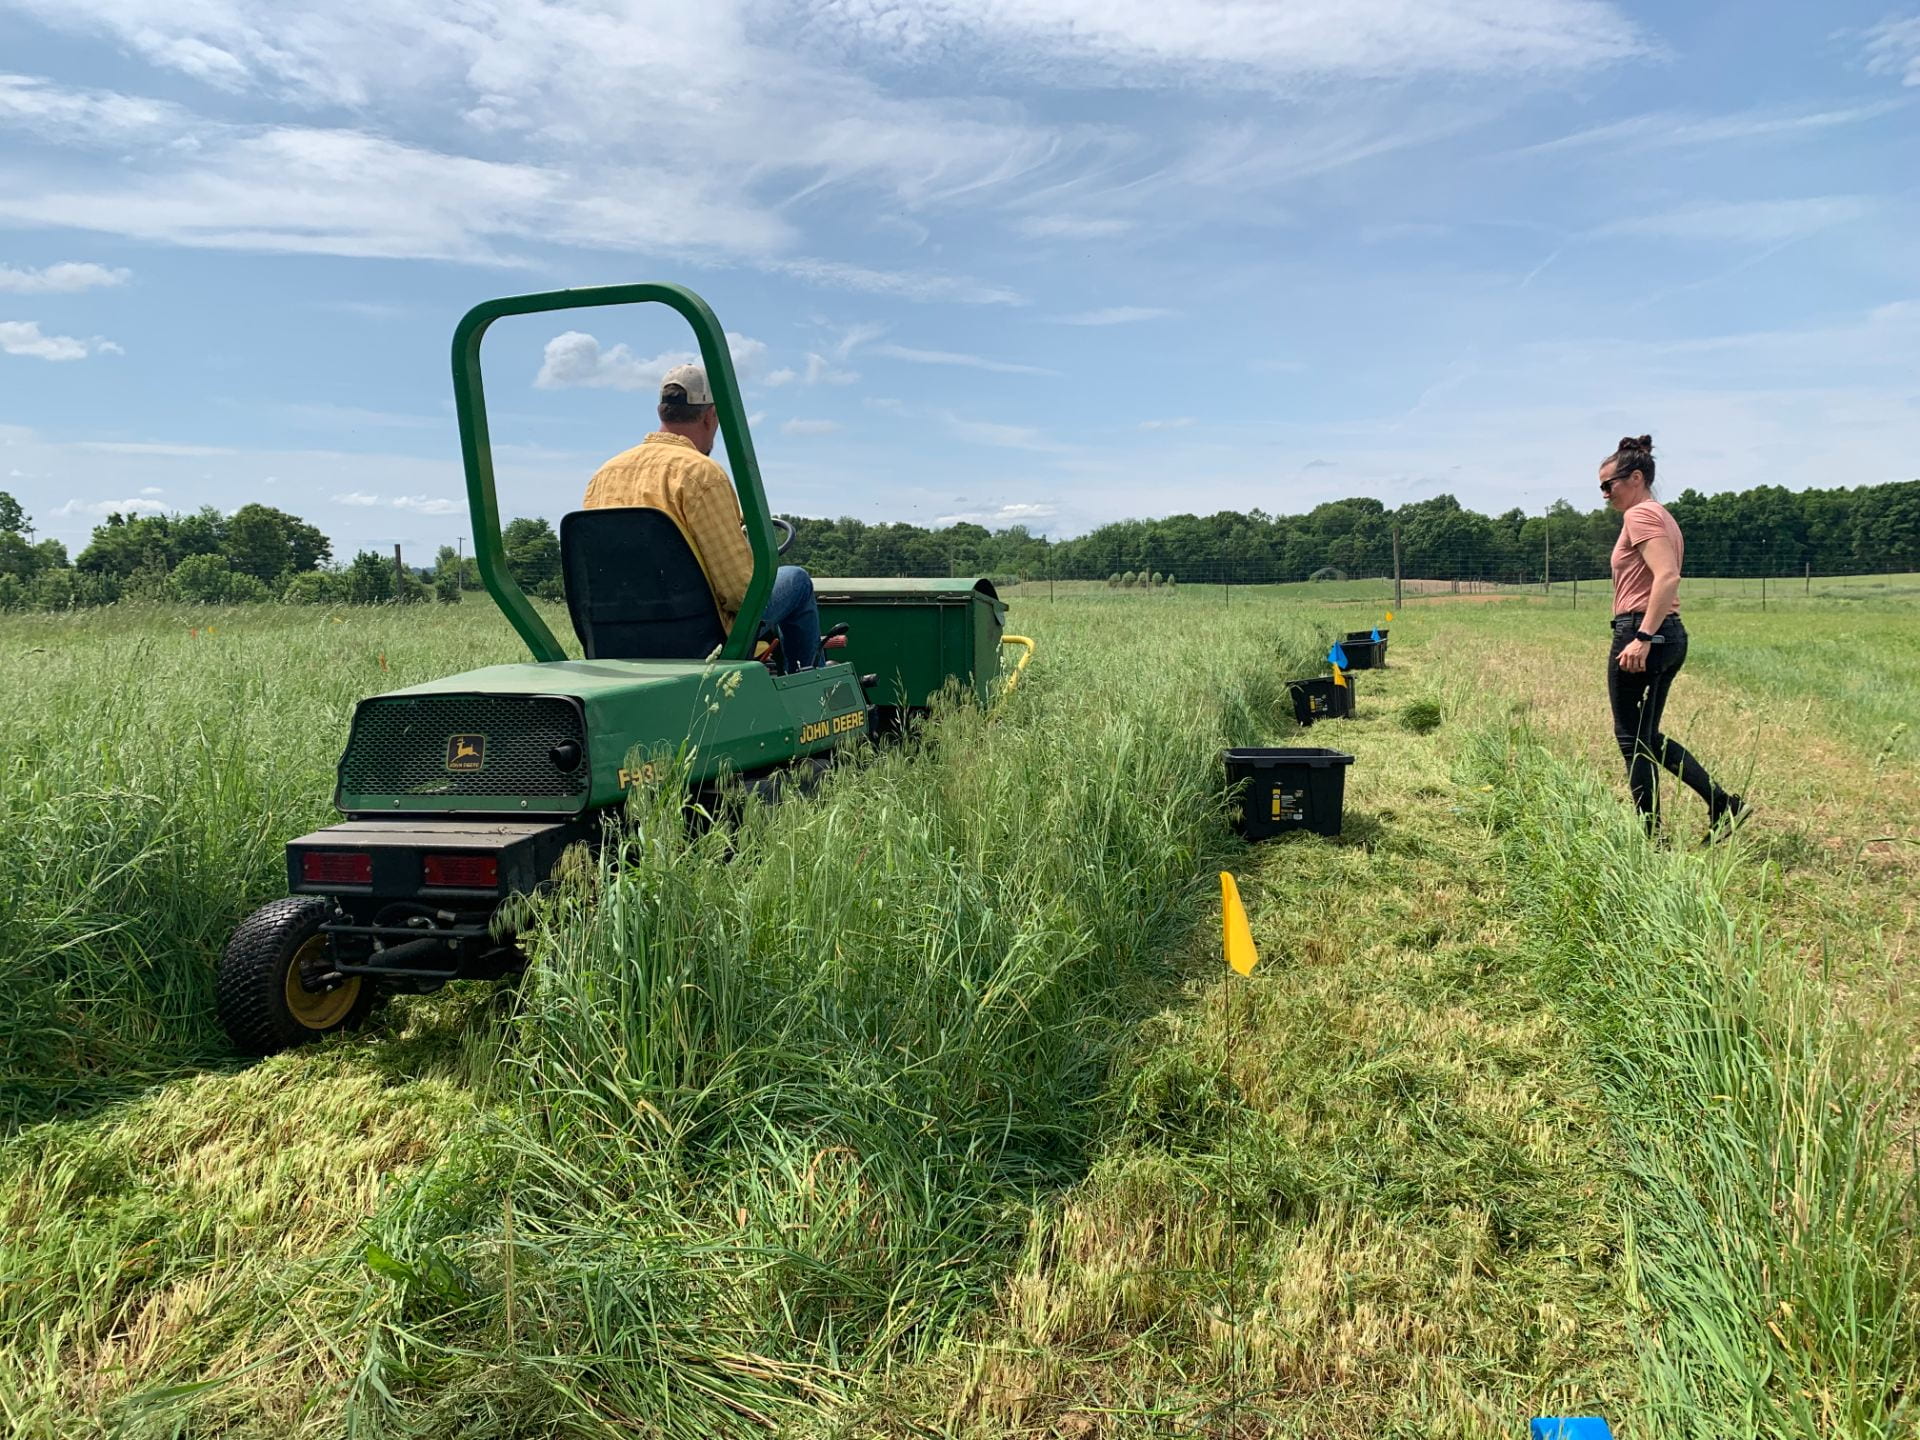
First cutting was done on May 23 using a small-plot forage harvester from the center 3 feet of each plot (Figure 1). Each plot was weighed and moisture subtracted to calculate dry yield. Following the first cutting, all plots received 50 lbs/A nitrogen in the form of urea and 75 lbs/A potash was top dressed on the 200 lbs/A plots.

Figure 1. Orchardgrass harvest.

Second cutting was performed on July 13 as described above, followed immediately by 50 lbs/A nitrogen. The third and final cutting was performed on September 16. Final fertilization of 80 lbs potash added to the 200 lbs/A plots and 50 lbs/A nitrogen was added to all plots on September 23.

Yield data was compiled and analyzed in JMP statistical software package, differences were separated using Fisher’s Least Significant Difference (α=0.10).

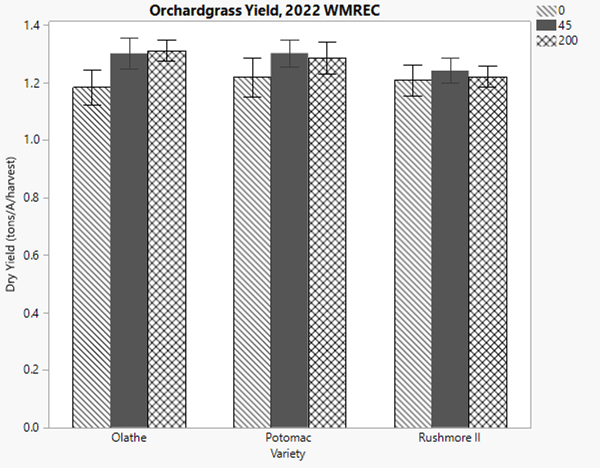
Interestingly, Potomac, an old variety, yielded significantly more (3.96 tons/A) than Olathe (3.65 tons/A) and Rushmore II (3.67 tons/A). In terms of fertility, plots that received 200 lbs/A potash yielded significantly more than those that received 0 and 45 lbs/A (Table 1).

Figure 1. Average orchardgrass cutting yield by variety and potash treatment.

We will continue this project in the coming years to collect more data and see how potassium fertility affects persistence and yield over the long term.

This work was supported by the Maryland Horse Industry Board and the University of Maryland AgFS Program. Special thanks to the Maryland Agriculture Experiment Station and the farm crew at the Western Maryland Research and Education Center.

Table 1. Orchardgrass yields in 2022 plots.

Potash Fertility Average Yield/Cutting (Tons/A) Combined Yield (Tons/A)
0 lbs/A  1.23 az 3.71 a
45 lbs/A 1.22 a 3.65 a
200 lbs/A 1.30 b 3.91 b
p-value 0.0328 0.0325

z Means followed by the same letter are not significantly different based on Fisher’s Least Significant Difference (LSD; α=0.10).

The Importance of pH and Liming Material

Kelly Nichols, Agriculture Agent Associate
University of Maryland Extension, Frederick County

“If I were stranded on a desert island and could do only one part of the soil test to determine how to grow food, I would test for pH.” This statement, made by Dr. Doug Beegle, my soil fertility professor, highlighted how important soil pH is. For most agronomic crops, the ideal pH is between 6.0 and 6.5. Alfalfa and barley prefer a bit higher pH of 6.5-7.0. Between the pH of 6 and 7, nutrient availability is at its optimum. Outside that range, key nutrients such as nitrogen, phosphorus, and potassium become more tightly bound to other nutrients and unavailable for the crops to take up (Figure 1). Below 6.0, nutrients such as iron, copper, and aluminum become more available, and in some cases could result in toxicity to the crop.

Over time, the pH of soil naturally decreases. So, to increase the pH, we add lime. The soil test results will provide the amount of lime needed to increase pH to the optimum level. The lab uses the current soil pH and acidity of the soil to determine how much lime is needed. (Your soil test may report the acidity, which is measured in milliequivalents per 100 grams [meg/100 g]). Also, if your soil test result includes the buffer pH, ignore that number. It is the pH of the buffering solution used during the test, and not the pH of the actual soil.

Let’s say your soil test result says that you need 2 tons of lime per acre to increase the pH to 7.0. Does that mean you can put on 2 tons of whatever liming material you like best? Not quite. The results are given based on the assumption of using calcium carbonate, which is considered pure limestone and given a rating of 100% calcium carbonate equivalent, or CCE. All other liming materials are compared to calcium carbonate and given their own CCE (Table 1). For example, burned lime has a CCE of 178. This means that it has more acid-neutralizing activity than pure calcium carbonate; therefore, less material can be used to obtain the same neutralizing activity as pure lime. Wood ashes, on the other hand, has a CCE of 40; therefore, more material needs to be applied in order to adjust the pH.

Don’t forget to take the price into consideration when comparing liming materials! For example, if ground shells are really cheap, that’s great; but it has a lower CCE, so you’ll need to apply more.

For more information, click here to read the Soil pH Management and Determining Lime Rates fact sheet.

Mn, Zn, and B Starter for Corn Production

Jarrod Miller, Extension Agronomist & Amy Shober, Professor & Nutrient Management Extension Specialist
University of Delaware


Micronutrient deficiencies are commonly exhibited in agronomic crops grown on Delaware’s sandy, low organic matter soils. In 2018, University of Delaware researchers conducted a study at the Carvel Research and Education Center (Georgetown, DE) to examine corn response to manganese (Mn), zinc (Zn), and boron (B) in starter fertilizer. Two rates of Mn (0.25 and 0.5 lb/ac), Zn (0.5 and 1.0 lb/ac), and B (0.15 and 0.30 lb/ac) were applied as a liquid starter with the planter.

The goal of this project was to increase yields with additional starter applications of Mn, Zn, or B, which did not occur. However, based on the soil test UD recommendations, no additional micronutrients were called for (Shober et al., 2019). Fields deficient in Mn, Zn, or B (based on UD recommendations) would still benefit from their addition as a starter band or foliar application.

Although starter applications of B did not produce a yield effect, tissue concentrations of B increased with yield. Predicting B availability is difficult, as it is more prone to leaching than other micronutrients. With lower tissue B concentrations related to stand counts, there is potential evidence that B leached below the root zone in saturated soils. It is possible that B would benefit from split applications, similar to N management.

The application of B increased Mn content in ear leaf tissue, but not yields. Across all treatments there was a positive relationship between B and Mn uptake. The relationship between these two nutrients in should be investigated further.

Read the full report here.