Emily Zobel, Senior Agriculture Agent Associate | ezobel@umd.edu University of Maryland Extension, Dorchester County
Soybean: Continue to scout for stink bugs, dectes stem borer, and defoliators (bean leaf beetle, Japanese beetle, grasshoppers, and caterpillars). Control may be needed if there is 15% defoliation from bloom through pod fill. Chemical control is not recommended for dectes stem borer since it would require multiple applications to reduce larval infestations, which is not economical. If a high number of adults are found, harvesting that field as soon as it matures will reduce losses associated with lodged plants.
With the upcoming hot weather there is an increased chance of spider mite outbreak in vegetable and soybean fields (Fig 1). Scout by using a hand lens to examine mid to upper canopy leaflets on two plants in twenty locations along the edges of the field. Consider treating if 10 % of plants have heavy stippling feeding damage on ⅓ of their mid and lower leaves.
The next flight of corn earworm (CEW) will be taking place soon. Bean fields with open canopies (wide rows), are drought-stressed, or have recently had an insecticide applied are at higher risk for CEW. CEW larvae can feed on flowers without impacting yields. NC State has a good economic threshold calculator to assist with management decisions: https://www.ces.ncsu.edu/wp-content/uploads/2017/08/CEW-calculator-v0.006.html.
Field Corn: Check for stink bugs around the edges. The threshold is 1 stink bug per 2 plants from pollen shed to blister stage. Treatment is not recommended past the blister stage.
Sorghum: Sugarcane aphids typically show up in fields late July and August. Check underside of leaves for insects. Honeydew will turn leaves shiny and is an easy to see indicator that aphids are present. Sugarcane aphids are light yellow with black cornicles, antennae, and feet. Thresholds depend on plant growth stage; at boot to milk, thresholds are 50 aphids per leaf on 25 – 30% of plants. There is documented resistance to resistance to pyrethroids.
Emily Zobel, Agriculture Agent Associate University of Maryland Extension, Dorchester County
Soybean: Keep scouting for stink bug, corn earworm, and leaf defoliators. Defoliation thresholds for R-stage soybean is 15-20% with defoliators present; however once the field has reached the R6 stage, defoliation thresholds can be relaxed. Bean leaf beetles may be found in fields but economic damage is rare in our area. Stink bugs will often aggregate in along fields edges, so make sure to check the middle of the field as well to see if the whole field needs to be treat or if you can just spot treat the edges. NC State Extension Stink Bug Economic Threshold Calculator can be used to help decide if it worth treating based on row with and bean type (https://soybeans.ces.ncsu.edu/stink-bug-economic-threshold-calculator/). As the month progress and fields get closer to harvest, sample stems in any field that have a history of Dectes stem borer issues. If your field has a large stem infestation, prioritize that field for as timely a harvest as possible to reduce loss due to lodging.
Sorghum: As fields reached the hard dough stages they are less likely to have sugarcane aphids. However, it worth keeping an eye out for honeydew, which can impended harvest, and aphids in any fields that were treated with an insecticide earlier this year and late fields that are younger than soft dough.
Laura C. Moore^,*, Alan W. Leslie#, Cerruti RR Hooks$,* and Galen P. Dively+,* Former graduate student^, Associate Professor and Extension Specialist$, Professor Emeritus+, CMNS, Department of Entomology*, Agriculture Extension Agent, Charles County#
Introduction
Increasing floral diversity within agricultural fields has been proposed as a method to bolster natural enemies and subsequently reduce pest populations. A key factor that enhances predator and parasitoid populations is the availability of nectar and/or pollen food subsidies from flowering plants. Many natural enemies, particularly hymenopteran (wasps) parasitoids, require carbohydrates for successful reproduction and overall fitness. However, monoculture cropping systems are relatively weed-free and generally lack floral resources required by many natural enemies. A literature review showed that the successful establishment of certain parasitoids in cropping systems depended on the presence of nectar-bearing weeds. In addition to providing natural enemies nectar and pollen to eat, flowering plants can supply alternative hosts or prey, shelter, overwintering sites and a more suitable microclimate.
Many conservation projects have been implemented by farmers to increase beneficial services on arable lands. In Maryland, the opportunity to practice conservation biological control exists within the Conservation Reserve Enhancement Program (CREP). Conservation biological control is a pest management approach that manipulates agricultural systems so as to promote pest suppression by naturally occurring predators, parasitoids and pathogens. The CREP seeks to establish riparian buffers in Maryland to improve water quality, filter sediments and nutrients from runoff and provide wildlife habitat. However, these buffers can be engineered to support communities of natural enemies and serve as corridors for their movement into neighboring crops.
The aim of this study was to determine whether buffer strips could be used as insectary plants to enhance beneficial arthropods (insects and spiders) within neighboring soybeans. Insectary plants are plants grown with cash crops to attract, feed and shelter insect parasitoids and predators so as to enhance their natural control of insect pests. We monitored pest and beneficial arthropods in the buffer insectary plants and neighboring soybean plantings and tried to link arthropods found in buffer plants with pest management in neighboring soybeans.
Abbreviated Experimental Procedures
Insectary buffer test plants. Partridge pea and purple tansy are commonly used to enhance floral resources along field margins for pollinator plantings and to enhance communities of natural enemies in adjacent crops. Partridge pea is a native annual legume and is widely used in seed mixes of CREP riparian buffers because it readily reseeds itself, is competitive when grown with grass mixes, and provides nutritional seed for game birds. As an insectary plant, partridge pea has a long bloom period and each leaf petiole has an extrafloral nectary at its base, which produces nectar throughout the growing season. A diverse assemblage of pollinators and natural enemies are attracted to partridge pea. Purple tansy has a long flowering period, high-quality nectar and pollen production, and is reported as being a valuable insectary plant. Proso millet is a warm season annual grass that lacks floral resources. As such, it served as a grass control to determine how added vegetation diversity in the absence of floral resources would impact natural enemies.
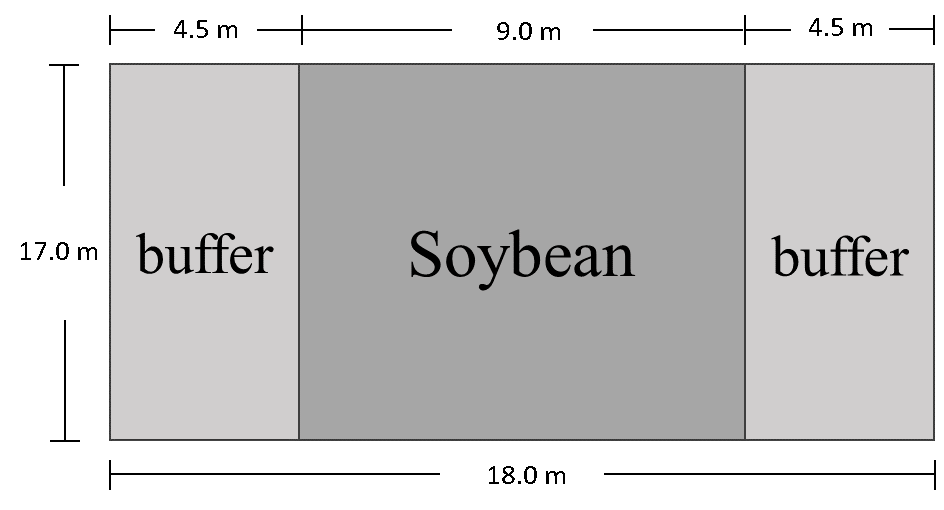
Experimental design. Field experiments were conducted over two years at the Central Maryland Research and Education Center in Beltsville, MD. In year 1, 16 plots of soybean were seeded on May 11. Each plot consisted of 20 soybean rows spaced 35 cm (15 in) apart and bordered on each side by an insectary buffer strip (Fig. 1). The test buffer strips consisted of 1) purple tansy, 2) partridge pea, 3) 50:50 seed mixture of purple tansy + partridge pea, or 4) proso millet. Each soybean plot-buffer combination was replicated four times. Seeds of partridge pea, purple tansy, and proso millet were planted with a no-till drill in rows 23 cm (9 in) apart at a rate of roughly 12,000 seeds per ha (4856 per ac) on the day soybeans were planted.
Fig. 1. Illustration of a soybean-buffer treatment plot in year 1. Soybean plots were bordered on each side with buffer insectary plants. Buffers included purple tansy, partridge pea, 50:50 seed mixture of partridge pea/purple tansy or proso millet.
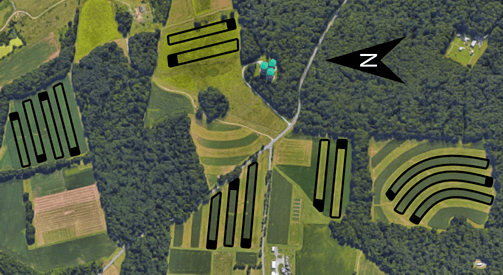
The year 1 study showed that purple tansy was unsuitable for the hot summer conditions in Maryland Thus, it was not used in the year 2 experiment, which focused solely on partridge pea as the insectary buffer plant. The year 2 experiment included 14 strip plantings of full season soybean at five different locations (Fig. 2). Soybeans were planted no-till in 75 cm (30 in) wide rows during May. Each strip was bordered at one end with a partridge pea buffer and at the other end with a mixed grass border of fescue (Festuca spp.) and orchardgrass (Dactylis spp.).
Fig. 2. Aerial view of experimental layout in year 2. Study consisted of 14 contour strips of full-season soybeans and adjoining partridge pea buffers (indicated by black polygons) at one end of each strip. Grassy areas were on opposite ends of soybean strips without a buffer.
Arthropod population assessments. Abundances of arthropods active in the plant canopy were measured with yellow sticky cards secured to bamboo poles. Further, sweep-net samples were taken in July and August to estimate green cloverworm (Hypena scabra) numbers. The green cloverworm served as a bioindicator of changes in pest populations potentially caused by enhanced natural enemy activity. The larger field size in year 2 allowed sticky cards to be placed throughout the soybean strip. One card was placed in the center of each partridge pea buffer, and additional cards were placed at distances of 3, 6, 12, 18 and 24 m (10 ft to 79 ft) from the border on both sides of each soybean strip (total of 10 sticky cards per strip). Sampling was conducted weekly or biweekly. In year 2, pitfall traps were also installed in the ground adjacent to each sticky card to estimate the abundance of surface-dwelling arthropods over 7-day intervals.
Summary of Results
Year 1 Study – comparison of four insectary buffers parasitoid abundance. Three families of parasitoids Mymaridae, Scelionidae and Trichogrammatidae comprised 83.9% of the total of parasitic wasps captured on sticky cards. Families Ceraphronidae, Braconidae and Eulophidae comprised an additional 12.5% of the wasp parasitoid group. Of these parasitoids, mymarids were the most abundant and there were 73-78% higher sticky card captures of this wasp in partridge pea compared to purple tansy and millet buffers. However, significantly fewer mymarids were captured in soybeans adjacent to partridge pea than adjacent to purple tansy or millet. Scelionid parasitoids were more abundant in millet and purple tansy buffers but their numbers were similar in soybeans regardless of the neighboring buffer type. Trichogrammatid abundance was greatest in millet early in the season and in buffers with partridge pea by season end. Two families of fly parasitoids (Tachinidae and Sarcophagidae) averaged 9.4 and 4.4 flies per sticky card in insectary buffers and soybean plots, respectively. The abundance of sarcophagid flies was significantly higher in buffers with partridge pea than millet or purple tansy alone. Similarly, soybeans adjacent to partridge pea were inhabited by more tachinids and sarcophagids than soybeans adjacent to millet or purple tansy.
Predator abundance. Overall predator abundance was significantly higher in purple tansy and millet compared to partridge pea or mixed (partridge pea + purple tansy) buffers. Mean captures per card were 5.0 in partridge pea, 6.8 in mixed, 8.5 in purple tansy, and 10.3 in millet. However. similar predator numbers were captured in soybean plots adjacent to all four buffer types.
Insect herbivores (plant feeders). Sweep net counts of green cloverworm were statistically similar in soybean plots adjacent to the four different buffer types. Overall numbers per 10 sweeps averaged 24.6, 27.0, 18.0, and 23.0 in soybeans adjacent to millet, purple tansy, mixed and partridge pea buffers, respectively. The bulk of other insect herbivores captured on sticky cards were mainly aphids, leafhoppers, planthoppers and plant bugs. Mean numbers captured per card were 86.1 (millet), 113.2 (purple tansy), 57.6 (mixed) and 53.7 (partridge pea).
3.2. Year 2 Study partridge pea vs. natural grass vegetation
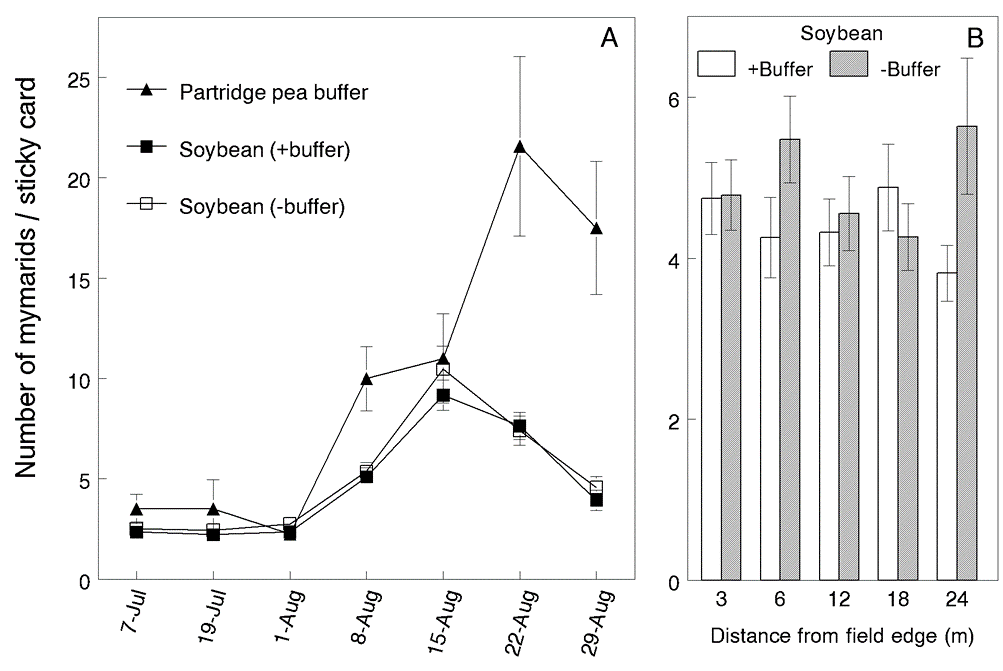
Parasitoid abundance. The most abundant parasitoids belonged to families Mymaridae, Trichogrammatidae and Scelionidae in order of abundance, and together comprised 84.3% of the total hymenopteran parasitoids captured. Each family responded differently to the partridge pea treatment. Mymarid abundance was higher overall in partridge pea buffers but did not enhance their abundance in neighboring soybeans (Fig. 3). Significantly fewer trichogrammatids were captured in partridge pea compared to numbers captured in soybean with and without the partridge pea buffer. Mean captures of dipteran parasitoids per sticky card abundance were significantly higher in soybean neighboring partridge pea, with the exception of the first and last sampling dates.
Fig. 3. A) Mean number (±SE) of mymarid parasitoids captured per sticky card in partridge pea buffer, soybean neighboring buffer, and soybean without buffer in year 2. Data for soybean were averaged over all sampling distances (3, 6, 12, 18 and 24 m) from the field edges. B) Mean number in soybean at different distances from field edges with and without a partridge pea buffer.
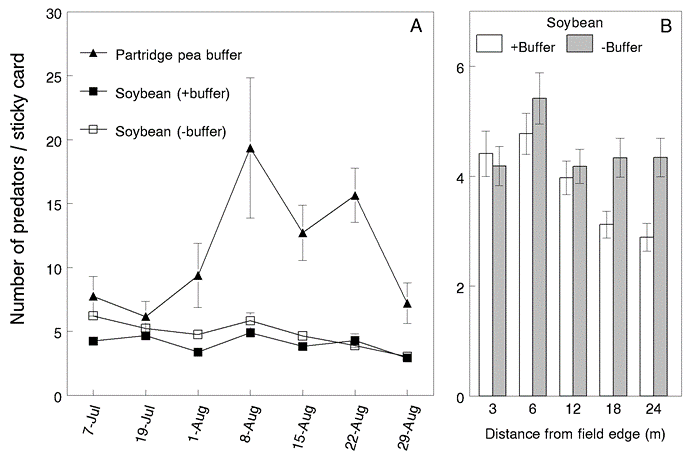
Predator abundance. Long-legged flies, minute pirate bugs, and big-eyed bugs comprised 81.4% of the total predatory arthropods captured. Soldier beetles, fireflies and lady beetles represented an additional 11.6%. Mean abundance of predators per sticky card was 11.5 ± 1.1 in buffer, 4.1 ± 0.16 in soybean neighboring buffer and 4.9 ± 0.18 in soybean without buffer. Abundance of predators was significantly lower in soybean neighboring the partridge pea buffer (Fig. 4). However, this was largely due to the activity of long-legged flies, which were more attracted to the partridge pea buffer. Still, their numbers were significantly lower in soybean strips neighboring partridge pea compared to soybeans without partridge pea buffers.
Fig. 4. A) Mean number (±SE) of arthropod predators captured per sticky card in partridge pea buffer, soybean neighboring buffer and soybean without buffer in year 2. Data for soybean were averaged over all sampling site distances (3, 6, 12, 18 and 24 m) from the field edges. B) Mean number in soybean at different distances from field edges with and without a partridge pea buffer. Arthropod predator guild consisted of long-legged flies, minute pirate bugs, big-eyed bug, soldier beetles, fireflies and lady beetles.
Insect herbivores/pests. Thrips, leafhoppers, treehoppers, froghoppers and planthoppers comprised over 95% of herbivores captured on sticky cards. The total number of herbivores per sticky card averaged 108.2 in the partridge pea buffer, 96.3 in soybean neighboring buffer, and 96.4 in soybean without buffer. Thus, herbivore numbers did not differ significantly in the buffer and soybeans.
Pitfall trap predators. A total of 56,296 arthropods were identified from pitfall trap samples. Of predators captured in pitfall traps, ants, spiders, soldier beetle larvae, rove beetle adults and larvae, and ground beetle adults and larvae were the most abundant. Ant numbers were significantly lower in soybeans neighboring partridge pea on all sampling dates.
Discussion
Year 1 study was conducted to determine if pure and mixed buffer strips of partridge pea and purple tansy could attract greater numbers of beneficial arthropods than non-floral strips of millet, and whether these buffers enhance beneficial arthropod abundance in neighboring soybeans. Purple tansy was not a suitable insectary plant as it was not well adapted to the seasonal period of the study in Maryland. Furthermore, purple tansy would probably be less desirable to establish and maintain as a buffer strip due to its relatively high seed price, slow growth characteristic and greater susceptibility to weed competition. Moreover, purple tansy was quickly out-competed by partridge pea in the mixed planting to the extent that the pure and mixed buffers containing partridge pea attracted similar arthropod communities.
Overall, results consistently showed that partridge pea attracted and supported high populations of natural enemies and potential hosts and prey, with abundances significantly greater than levels found in adjacent soybeans. Sticky card captures of wasp and fly parasitoids in year 1 were more than 70% higher overall in buffers containing partridge pea compared to other buffer types. Similarly, populations of all beneficial arthropods captured by sticky card and pitfall sampling in year 2 were approximately 80 to 72% higher, respectively, in partridge pea buffers compared to the soybean crop.
Parasitoids. Mymarid wasps were notably the most common parasitoids captured on sticky cards and consistently more abundant in partridge pea compared to soybean. These tiny wasps parasitize insect eggs in concealed sites within plant tissues or the soil and are important natural control agents of economically important leafhopper pests. In year 1, mymarids reached levels in partridge pea buffers that were four-fold higher than those in soybean plots, yet significantly lower levels of mymarids were captured in soybean adjoining these buffers. This suggests that the partridge pea lured mymarids from neighboring soybeans. High numbers of mymarids were also captured in partridge pea in year 2 but their abundance in soybeans was not enhanced. This suggests that partridge pea may provide some parasitoids and their associated hosts with all resources required for survival and reproduction. This would in effect provide no incentive for these parasitoids to forage within neighboring crops.
Most fly parasitoids found on sticky cards were tachinids or sarcophagids. The vast majority of hosts of tachinid flies are plant-feeding insects. Their level of parasitism can vary greatly, from less than 1% to approaching 100%, depending on such factors as the size of a host and parasitoid population, and environmental conditions. During both study years, their overall abundance in partridge pea was 62.3% higher than levels in soybean. In year 2, this effect was heightened at the field edge next to buffers, suggesting that higher numbers of parasitic flies encroached into the neighboring soybeans but enter only a short distance within the crop.
Predators. In year 1, predators captured on sticky cards were 65% more abundant in the millet and purple tansy buffers. This response was mainly attributed to the abundance of long-legged flies. These predatory flies hover while searching for small, soft-bodied arthropods, particularly other flies, aphids, spider mites, larvae of small insects and thrips. However, abundances of long-legged flies in soybean plots were not affected by buffer type in year 1. Long-legged flies were also the predominant predators active in the plant canopy in year 2, with overall numbers 2-3 times higher in partridge pea buffers compared to levels found in soybeans. However, their abundance was significantly lower in soybean neighboring partridge pea, particularly at sampling sites closest to the field edge. This is further evidence that the partridge pea acted as a natural enemy sink.
Of the ground-dwelling predators captured by pitfall traps, ants were the predominant group and their abundance was significantly higher in partridge pea than adjoining soybeans. Their numbers were significantly lower in soybean plantings adjacent to partridge pea than grassy check treatment on all sampling dates, implying again that partridge pea acted as a natural enemy sink by luring ants away from soybean. Populations of other ground-dwelling predators, which consisted mainly of spiders, rove beetles, soldier beetles and ground beetles, showed a definite preference for partridge pea compared to soybeans. However, their abundances in the crop were not affected by partridge pea presence.
Herbivores. Sticky card captures each study year indicated that partridge pea harbored significantly more insect herbivores compared to soybean. The majority of herbivores were aphids, leafhoppers, planthoppers and plant bugs. In year 1, number of green cloverworm, as well as other herbivores in soybean were similar regardless of the buffer treatment.
Conclusion
This study demonstrated that partridge pea provides floral resources and alternative food for a diverse community of natural enemies and herbivores. However, its presence as a monoculture buffer did not result in increased number of major natural enemies in neighboring soybeans. Taken together, partridge pea planted as a monoculture acted more as a natural enemy sink by attracting beneficial arthropods away from soybean, potentially decreasing natural control efforts. For this reason, a monoculture of partridge pea may not be an ideal insectary planting if the ultimate goal is to maximize natural enemy efficacy in neighboring soybean fields.
In conservation reserve practices, monocultures of partridge pea are more commonly planted as a wildlife habitat to provide food for bobwhite quail and other wildlife and as flowering habitat for different pollinator taxa. Because the foliage is potentially poisonous to cattle and re-seeding plants can aggressively fill in voids when used as part of a seed mix, conservationists recommend for herbaceous riparian buffers that the total seed mix consist of no less than 1% and no more than 4% partridge pea. However, decisions about the deployment of insectary plants as a monoculture or part of a riparian buffer mix planting should take into consideration the attractiveness and resources provided to natural enemies and their hosts/prey by the insectary habitat in comparison to those provided by the neighboring cash crop. Simple addition of a highly attractive flowering buffer adjacent to a crop could be counterintuitive to natural biological control efforts.
Acknowledgements
Financial support for field studies and publishing results was provided by the Northeast Sustainable Agriculture Research and Education Grants Program, Maryland Soybean Board and USDA NIFA EIPM grant number 2017-70006-27171.
Alan W. Leslie, Armando Rosario-Lebron, Guihua Chen and Cerruti R. R. Hooks Department of Entomology, College of Computer, Mathematical, and Natural Sciences
Summary
This extension article is meant to serve as a condensed write-up of a completed field study. Full-text of the published work can be viewed via open access at http://www.mdpi.com/2073-4395/8/6/87. Cover cropping has long been used as a method of reducing soil erosion, increasing soil quality, and suppressing weeds. However, impacts of cover crops in cropping systems differ and can be affected by timing and method of their termination. Field trials were conducted over two field seasons and at two sites in Maryland to examine how varying the date and method of terminating a barley (Hordeum vulgare) winter cover crop affects arthropods (insects and spiders) in succeeding no-till soybean (Glycine max) plantings. Experimental treatments included early-kill with pre- and post-emergent herbicides (EK), late-kill with pre- and post-emergent herbicides (LK), late-kill with a flail mower and pre-emergent herbicide (FM), and a fallow/bare-ground check with pre- and post-emergent herbicides (BG). Terminating barley late (i.e., just prior to soybean planting) resulted in significantly greater biomass accumulation in LK and FM than EK. However, method and timing of termination had no effect on communities of pest and beneficial arthropods in the soybean canopy. Results from this experiment suggest that terminating the cover crop early or late or using a mower or burn-down herbicide to kill the cover crop will result in similar species and number of arthropods within the soybean canopy.
Introduction
Cover cropping can be a viable weed management tool in conservation agriculture systems. When cover crops are terminated in reduced- and no-till cropping systems, resulting residues that remain on the soil surface can help prevent weed establishment. Thus, it is well known that cover crop residue impacts weed populations. More specifically, some of these studies were designed to examine how method and timing of cover crop termination practices impact weed populations in grain crops. However, impacts of these practices on arthropod populations are rarely considered. Despite this, studies have shown that cover crops can impact arthropod numbers in succeeding agronomic crops. Some insect pests shown to be impacted by cover crop residue include the potato leafhopper (Empoasca fabae), bean leaf beetle (Cerotoma trifurcata), and Japanese beetle (Popillia japonica)in soybean as well as thrips in cotton (Gossypium hirsutum). In addition to insect pests, their natural enemies may be influenced by cover crop residue.
The overall goal of this study was to investigate how different cover crop termination practices impact populations of insect pests and their natural enemies within no-till soybean plantings. Specific objectives were to compare the influence of termination method (chemical versus mechanical) and timing (early versus late) on arthropod populations. Barley was chosen as the test cover crop partially because of its accessibility and popularity among producers.
Materials and Methods
Field experiments were conducted at the University of Maryland’s Central Maryland Research and Education Center at the Upper Marlboro and Beltsville farm sites in 2013 and 2014. Each field experiment consisted of four treatments, including three cover crop termination methods and a fallow/bare-ground control. The three cover crop treatments included: (1) early-kill (EK), in which the cover crop was sprayed with post- and pre-emergent herbicides in mid-April; (2) late-kill (LK), in which the cover crop was sprayed with post- and pre-emergent herbicides in late May; and (3) flail-mowed (FM), in which the cover crop was sprayed with a pre-emergent herbicide and mowed in late May. An early-kill, flail-mowed treatment was not included in the experiment because mowing typically does not kill cover crops at early stages of development and farmers do not use this method. The bare-ground treatment (BG) remained fallow after the previous crop was harvested and received the same post- and pre-emergent herbicide applications as LK.
The EK treatment was sprayed with a post- and pre-emergent herbicide mixture on 15 April at Beltsville and 16 April at Upper Marlboro in 2013 and on 18 April at both sites in 2014. The LK treatment was sprayed with a post- and pre-emergent herbicide mixture on the day soybeans were planted. The BG treatment received the same spray protocol as LK. On the day soybeans were planted, the FM treatment was sprayed with a pre-emergent herbicide and the cover crop was mowed. The soybean was planted on 21 May at Beltsville and 20 May at Upper Marlboro in 2013 and 27 May 2014 at both sites. Soybeans were planted in wide rows [76 cm (30 inch) inter-row spacing] at Beltsville and narrow rows [18 cm (7 inch) inter-row spacing] at Upper Marlboro. A late-season herbicide application was applied to all plots at the Beltsville location as a “rescue” herbicide treatment primarily for large crabgrass (Digitaria sanguinalis).
Data collection.Data on vegetative (cover crop and weed) biomass, abundance of weeds and arthropods, soil moisture as well as yield were collected during this investigation. Data on weed population, soil moisture and yield will be presented in a future edition of Agronomy News. To quantify cumulative barley and weed biomass production, cover crop and weed biomass were measured in each plot just prior to their termination. Arthropod abundances were monitored with the use of a sweep net from the R1 through R5 soybean growth stages. Arthropods collected were divided into i) natural enemies (predators – arthropods that prey on herbivores & parasitoids –insects, especially wasps, that complete their development within the body of another insect eventually killing it) and ii) herbivores (insects that feed on plants). Arthropods were separated further according to seven feeding habits (guilds). The seven feeding habits that we used included 1) chewing predators, 2) sucking predators, 3) parasitoids, 4) plant-sucking herbivores, 5) pod feeders, 6) foliage feeders and 7) spiders. Though they are predators, spiders were placed into a separate predatory feeding guild.
Results
Vegetative biomass. At each farm site, flail-mowed (FM) and late-killed (LK) treatments had higher plant biomass than early-killed (EK) or bare-ground (BG) treatments (Table 1). Total barley biomass in LK and FM treatments were more than two times greater at Beltsville than Upper Marlboro. No differences were detected in plant biomass between BG and EK treatments within each site, but there was greater weed biomass in the BG treatment at Beltsville than Upper Marlboro (Table 1).
Table 1. Cover crop and weed dry biomass just prior to their termination.
Site
Treatment
Mass ± SEM (kg ha−1)
Beltsville
Early Kill
160.1
±
60.5
cd1
Late Kill
2211.9
±
83.2
a
Flail Mow
2123.4
±
112.9
a
Bare Ground
896.0
±
254.3
bc
Upper Marlboro
Early Kill
85.8
±
21.2
d
Late Kill
753.4
±
100.9
b
Flail Mow
851.8
±
62.7
b
Bare Ground
120.4
±
27.2
d
1Different letters indicate that means are significantly different.
Arthropod Counts.In total, 54 families of arthropods were collected from sweep samples which included a total of 11,344 specimens (Table 2). Approximately 98% of arthropods collected could be assigned to one of the seven feeding guilds used. Three feeding guilds, which included plant-sucking herbivores (25%), foliage-feeding herbivores (24%), and sucking predators (21%), accounted for 70% of the entire arthropod community sampled.
The abundance of arthropods from each feeding guild was similar among treatments. However, there was a significant effect of soybean development stage on all feeding guilds. In general, parasitoid, chewing predator, and sucking predator guilds reached greatest abundance later in the season (R4 or R5 stage). In contrast, numbers of foliage feeding and plant sucking herbivores peaked earlier in the growing season at the R2 or R3 stage (Table 3). Sucking predators and spiders were found in greater numbers in Beltsville than Upper Marlboro across all soybean growth stages.
Table 2. Arthropod feeding guilds, families and their abundances. Numbers represent total abundance across all sample dates.
Beltsville
Upper Marlboro
Feeding Guild
Family
2013
2014
2013
2014
Spider
Salticidae
25
47
24
48
Araneidae
5
69
0
37
Oxyopidae
149
101
42
94
Thomisidae
18
16
35
11
Lycosidae
0
12
0
26
Clubionidae
0
3
0
0
Ctenidae
0
1
0
0
Tetragnathidae
0
8
0
9
Linyphiidae
0
4
0
2
Pholcidae
0
1
0
0
Parasitoid
Platygastridae
159
11
57
0
unspecified1
0
407
0
104
Sceleonidae
10
23
1
15
Chalcididae
0
2
0
3
Proctotrupidae
0
1
0
2
Braconidae
0
76
0
29
Eulophidae
0
18
0
5
Ichneumonidae
0
8
0
3
Tiphiidae
0
178
0
25
Aphelinidae
0
1
0
1
Encyrtidae
0
1
0
0
Mymaridae
0
0
0
1
Eurytomidae
0
0
0
1
Trichogrammatidae
0
0
0
2
Chewing predator
Asilidae
5
6
0
0
Mantidae
1
1
1
0
Coccinellidae
21
262
36
193
Carabidae
0
5
0
3
Syrphidae
0
101
0
4
Cantharidae
0
0
0
1
Sucking predator
Geocoridae
543
346
223
326
Pentatomidae
3
8
1
1
Chrysopidae
5
1
3
13
Anthocoridae
48
166
225
161
Nabidae
100
340
37
93
Hemerobiidae
0
10
0
3
Reduviidae
0
0
0
4
Foliage feeder
Coccinellidae
287
92
43
1
Erebidae
346
756
274
455
Meloidae
0
1
0
0
Scarabaeidae
428
284
90
96
Chrysomelidae
2
345
0
254
Noctuidae
0
1
0
0
Hesperiidae
0
3
0
0
Plant sucking
Cicadellidae
32
732
109
689
Membracidae
22
0
40
18
unspecified
404
0
896
0
Aphididae
0
0
0
60
Pod feeder
Pentatomidae
33
164
69
115
Miridae
112
102
108
229
Unassigned
unspecified
0
2
67
30
Chrysomelidae
0
0
0
2
Curculionidae
2
5
0
30
Lampyridae
4
21
17
5
Lygaeidae
0
0
0
0
Elateridae
18
5
0
12
Noctuidae
0
0
0
1
Apidae
0
0
1
0
Cynipidae
0
0
18
3
Vespidae
0
0
5
8
Chrysididae
0
0
3
3
Pompilidae
0
0
1
0
Scoliidae
0
0
1
0
Thyreocoridae
0
0
0
14
Berytidae
0
0
0
41
Alydidae
0
0
0
2
1Unspecified taxa were not identified to the family level.
Table 3. Means (± standard errors) of feeding guilds within farm site and soybean development stage.
Abundance per 10 Sweeps
Feeding Guild
Site1
R1
R2
R3
R4
R5
Spider
BV
1.22
±
0.26
a2
0.91
±
0.20
a
1.27
±
0.13
a
2.02
±
0.25
a
1.28
±
0.22
a
UM
1.19
±
0.33
a
0.58
±
0.11
a
0.96
±
0.10
a
1.19
±
0.18
a
1.25
±
0.19
a
Parasitoid
BV
0.97
±
0.20
b
1.28
±
0.28
ab
1.23
±
0.15
ab
3.33
±
0.52
a
4.81
±
0.92
a
UM
0.22
±
0.11
b
0.56
±
0.12
ab
0.72
±
0.14
ab
0.97
±
0.16
ab
1.28
±
0.38
a
Chewing predator
BV
0.63
±
0.33
b
0.13
±
0.05
ab
0.82
±
0.15
ab
1.25
±
0.24
ab
1.56
±
0.30
a
UM
0.28
±
0.10
b
0.02
±
0.02
ab
0.48
±
0.10
ab
1.59
±
0.31
ab
1.50
±
0.31
a
Sucking predator
BV
3.75
±
0.69
b
3.41
±
0.51
b
4.03
±
0.37
ab
8.27
±
0.65
a
6.41
±
0.73
ab
UM
2.13
±
0.34
b
2.59
±
0.35
b
2.03
±
0.18
ab
7.84
±
1.05
a
5.91
±
0.64
ab
Foliage feeder
BV
8.78
±
0.92
b
7.50
±
0.86
ab
9.62
±
0.70
a
6.25
±
0.85
b
4.06
±
0.86
b
UM
2.81
±
0.95
b
1.84
±
0.26
b
5.17
±
0.41
a
2.89
±
0.36
ab
2.41
±
0.52
b
Plant sucking
BV
6.81
±
1.16
ab
5.66
±
0.61
a
2.73
±
0.21
ab
3.20
±
0.43
b
2.22
±
0.32
b
UM
3.81
±
0.72
a
8.61
±
1.01
a
2.97
±
0.19
a
15.0
±
3.66
a
8.38
±
1.77
a
Pod feeder
BV
0.81
±
0.24
a
0.64
±
0.15
a
1.23
±
0.16
a
0.50
±
0.14
a
1.34
±
0.36
a
UM
1.00
±
0.21
a
1.73
±
0.28
a
1.09
±
0.15
a
1.69
±
0.29
a
3.50
±
0.66
a
1BV = Beltsville, UM = Upper Marlboro
2Different letters within individual rows represent significant differences between growth stages.
Discussion
The objective of this study was to quantify the impact of cover crop termination method and timing on arthropods within soybean foliage. Cover crop termination practices are known to impact arthropods via resulting residues that remain on the soil surface. Thus, it was believed that different cover crop termination methods examined during this study would influence arthropod abundances differently. As expected, delaying the cover crop termination date resulted in significantly greater biomass of residue in late-kill (LK) and flail-mowed (FM) than in early-kill (EK) treatments. Averaged across years, delaying cover crop termination in FM and LK increased barley biomass relative to EK by 2007.5 kg ha−1 (1791 lbs/acre) at Beltsville and 716.8 kg ha−1 (639.5 lbs/acre) at Upper Marlboro. However, arthropod populations within the soybean foliage responded similarly to treatments regardless of plant biomass differences. Instead, arthropod abundances changed according to soybean growth stage. Chemical (LK) and mechanical (FM) termination tactics also had similar effects on arthropod abundances. This suggests that whether cover crops are killed early or late, or chemically or mechanically by mowing, the resulting arthropod community will be similarly impacted. The EK “early” (early April) and LK “late” (at soybean planting from mid to late May) treatments represent some of the most widely used practices for cover crop termination by Mid-Atlantic soybean producers. The results of our study suggest that these two practices are likely to result in similar species and number of foliar arthropods throughout the different soybean growth stages.
Conclusions
Overall, our results indicate that cover crop termination methods that result in greater cover crop biomass will have no effect on insects and spiders within the soybean foliage. However, if delaying cover crop termination results in greater weed suppression without impacting soybean productivity, this practice should nevertheless make soybean systems more resilient to pest pressure and acceptable by soybean producers.
Acknowledgments
We thank crews at the Upper Marlboro and Beltsville Research and Education Centers for logistics in establishing and completing field trials. This work or publication was supported by Hatch Project No. MD-ENTO-9107/project accession no. 227029 and the Crop Protection and Pest Management (CPPM), Extension Implementation Program (EIP) award number 2017-70006-27171 from the USDA National Institute of Food and Agriculture, and funding from the Maryland Soybean Board.
Peter Coffey, Agriculture Agent Associate University of Maryland Extension, Carroll County plcoffey@umd.edu
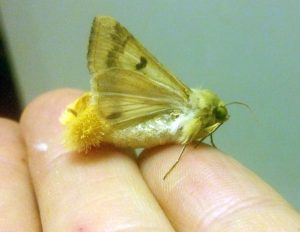
If you’re a farmer in the United States then you’re acquainted with the corn earworm, Helicoverpa zea. Maybe you know it as cotton bollworm, tomato fruitworm, sorghum headworm, soybean podworm, or maybe you remember when scientists used to call it Heliothis zea. To keep things from getting confusing we’ll just call it H. zea. No matter what you call it, it’s the same tan colored moth with caterpillars we all remember picking out of the tip of an ear of sweet corn as a kid. As you can guess from the variety of names, H. zea feeds on a lot of different crops. It’s actually been documented to eat over 100 different plants, usually the reproductive part of the plant (the fruit/grain/bean part).
Figure 1. Adult Helicoverpa zea moth. Image: Peter Coffey, University of Maryland.
While H. zea is a devastating pest throughout North and South America, it has a bigger badder older brother. In Europe, Africa, Asia, and Australia they also call this moth the cotton bollworm, but it’s a different species, Helicoverpa armigera (we’ll call it H. armigera). In fact, H. armigera is the parent species to our H. zea. Scientists estimate that about 1.5 million years ago some H. armigera moths made their way over to the Americas, and over time they evolved enough that does we consider them to be a different species, H. zea. To put it another way, if dogs evolved from wolves, then H. zea is a bulldog, and H. armigera is the wolf. This is important because H. armigera as the older original species is more genetically diverse, which is probably why it’s better at evolving pesticide resistance.
In recent years, increasing global trade has increased the occurrence of introductions of invasive pests worldwide, and H. armigera has been one of the species that people are the most worried about. It has been caught at the borders several times in North America, but unfortunately in 2013 it was confirmed to be established in Brazil. Additionally, scientists have known for a while that H. armigera and H. zea could mate and create viable hybrids in the laboratory, and just this winter a paper was published documenting the first wild hybrids discovered in Brazil.
Hybrid moths are concerning, because even though H. armigera is the more genetically diverse species, H. zea has spent the last 1.5 million years developing its own unique set of genes. This means that the hybrids combine the genetic diversity of both species. If you’re wondering why genetic diversity is important, remember that when a population lacks genetic diversity we call it inbred, so you could think of hybrids as the opposite of inbred. Scientists worry that these hybrids could attack an even wider range of crops, and that they could evolve pesticide resistance even faster. There’s no reason to think that individual caterpillars would be more damaging, both species are cannibals, which is why you rarely see more than one worm in an ear of corn.
So what does this mean for you? It means that sometime in the future, if these hybrids make it here, pesticide resistance may become even more of a concern than it already is. For now, if you’re spraying corn remember to rotate your chemical families. You can also check out what the corn earworm population is doing at www.mdmothmap.com, or call your local extension office and ask.
Veronica Johnson, Maryland Department of Agriculture
A pollinator is any organism that transfers pollen –the male genetic material of plants- from one flower to the next, resulting in the production of fertile seeds. Pollinators include birds, bats, bees, butterflies, beetles and some small mammals. Bees are the most efficient of the pollinators, with some species capable of visiting up to 6 thousand flowers in a single day. This high rate of flower visitation is important considering between 75% and 95% of all flowering plants on Earth need help with pollination. These plants include the countless fruits, vegetables and nuts that constitute an important part of our diets. In fact, pollinators are responsible for one out of every three bites of food that we eat. Honey bees alone contribute between $1.2 and $5.4 billion in agricultural productivity in the U.S. Unfortunately, pollinator populations are changing. Many populations are in decline, primarily due to loss of feeding and nesting habitats. However, pollution, chemical misuse, disease and changing weather patterns are also contributing to shrinking pollinator populations. Continue reading Protecting Pollinators in Ag Landscapes
Kelly Hamby, kahamby@umd.edu Assistant Professor/Extension Specialist, Department of Entomology
Ben Beale, bbeale@umd.eduExtension Educator, UME-St. Mary’s County
Sugarcane Aphid was found late last fall in Charles County, Maryland in a sorghum field that was being harvested for grain. Aphid populations were very high, with feeding present in the grain head and leaves. This is the first time that sugarcane aphid has been found in Maryland. While this aphid has caused substantial losses to sorghum in states to our South, it is unknown if the aphid will be present early enough and at high enough populations to cause significant injury in Maryland. Growers are encouraged to monitor sorghum fields through the summer for the presence of sugarcane aphid. We suspect sugarcane aphids are most likely to arrive later in the season in Maryland. Continue reading Sorghum Growers Encouraged to Keep an Eye Out for Sugarcane Aphid this Season