Jarrod Miller1, Agronomy Extension Specialist | jarrod@udel.edu and Nicole Fiorellino2, Agronomy Extension Specialist
1University of Delaware |2University of Maryland, College Park
Soybean Row Spacing and Population Studies
Modern soybean varieties can tolerate lower seeding rates and still produce good yields, providing there are no other issues with stand loss or stress. In southern Delaware two studies (2022 and 2023) observed no yield difference when planting full season beans (MG 4.2, late May planting date) when planted between 60,000 to 180,000 seeds per acre (Figure 1). You may consider dropping your seeding rates, considering your regional weather, planting date, and soil conditions.
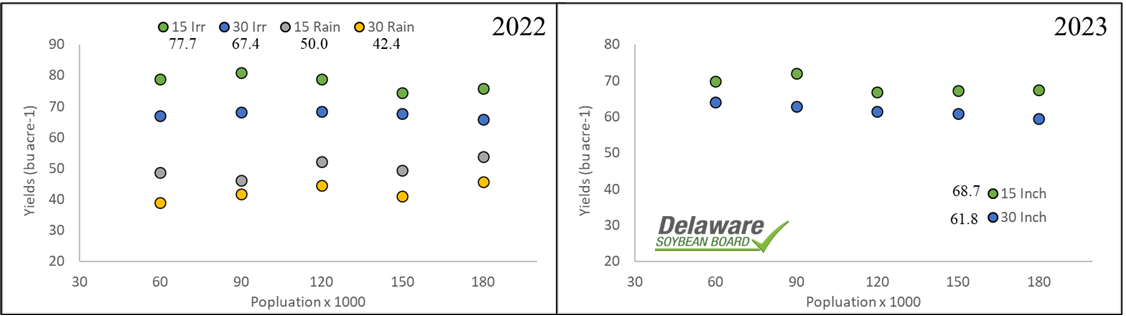
Over both years, 15” row spacing provided an 8-to-10-bushel advantage compared to 30” rows. A narrower row spacing helps soybeans canopy faster, providing more leaf area per acre to increase yields. Water is consistently a major yield limiting factor, where irrigation boosted yields by 26 bushels in 2022. All these yield differences were statistically significant
Maryland and Delaware Planting Date Studies
Planting soybeans earlier can provide more vegetative growth before flowering commences, closing the canopy earlier and providing more nodes for pods. In years prior, soybeans would be planted after corn, so that early planting usually referred to May. Now we may consider late April to be early, and many mid-western studies have observed yields steadily decline as soybeans are planted later into May. Even when you choose to plant earlier, colder soils (<50°F) and saturated conditions can limit germination and growth. What is considered early for the Mid-Atlantic though, where our climates range from Coastal to Appalachian?
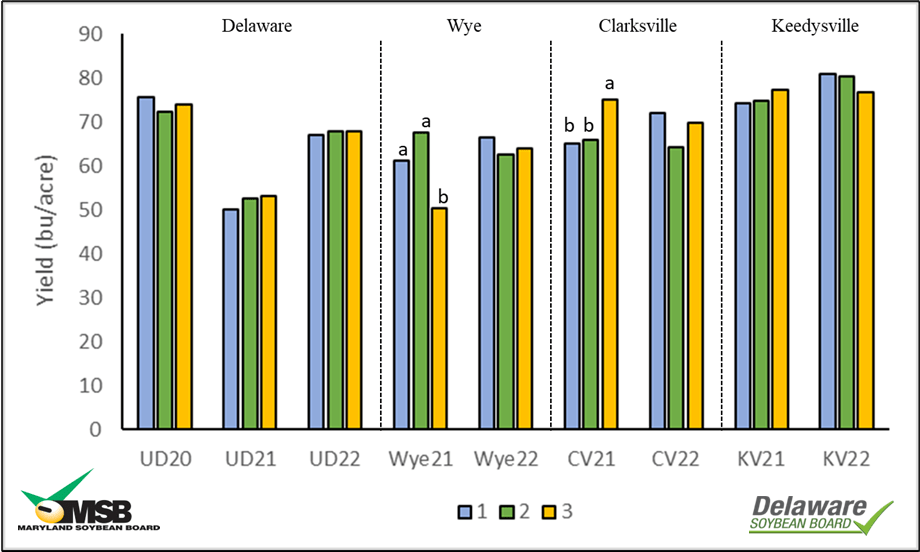
Between 2020-2022, University of Maryland and University of Delaware performed planting date trials for soybeans from lower Delaware (Georgetown) to the mid-shore (Wye Rec, MD), piedmont (Clarksville, MD), and Ridge & Valley (Keedysville). All planting dates were at least two weeks apart, typically starting in mid-April (weather and field conditions permitting) and the final planting date in mid to late May (Table 1).
Table 1. Planting dates for each site and year of the study for early, mid, and later planting dates.
| Site | Year | Early (1) | Mid (2) | Late (3) |
| Delaware | 2020 | 8-May | 21-May | 4-Jun |
| 2021 | 12-Apr | 28-Apr | 10-May | |
| 2022 | 13-Apr | 26-Apr | 11-May | |
| Wye | 2021 | 23-Apr | 12-May | 28-May |
| 2022 | 2-May | 23-May | 7-Jun | |
| Clarksville | 2021 | 21-Apr | 5-May | 19-May |
| 2022 | 18-Apr | 2-May | 28-May | |
| Keedysville | 2021 | 11-May | 28-May | 7-Jun |
| 2022 | 28-Apr | 11-May | 31-May |
Although earlier planting (April) did produce earlier canopy closure and sometimes earlier flowering, yields were only statistically different at two site years, the Wye and Clarksville in 2021 (Figure 3). The latest planting date at the Wye (May 28th) did have the lowest yields, compared to either April 23 or May 12, 2021. In Clarksville, yields were higher on the latest planting date of May 19th, compared to April 21st or May 5th. This could be due to the timing of rainfall or temperature conditions during early stages that season, as there was a lot of variability for the first two planting dates in yield.
For the other seven site by year combinations, there was no benefit to planting earlier, but there was also no yield penalty (Figure 3). In fact, we purposely did not apply a seed treatment to provide a more suitable environment for disease pressure. At the UD site in 2021, one row unit planted too deep in April, but yields remained similar to May planting. Freeze damage at UD in 2022 cause the death of some leaf and cotyledon tissue, but the soybeans recovered and matched later planted yields.
As there was no clear benefit to planting in mid to late April for soybeans, planting decisions can be made based on field suitability, disease presence, or tillage and soil temperatures. As noted in the population studies above, these decisions should be matched with local knowledge of yield potential, planting dates, and potential freeze damage.