Nicole Fiorellino, Extension Agronomist
University of Maryland, College Park
Dairy farmers are constantly looking for sources of forage to meet their feed needs. One source that many of our region’s dairy farmers utilize is the fall planting of cereal grains that are green-chop harvested the following spring. Among the cereal species used for this purpose are rye, triticale, barley, and wheat. Per the Maryland Cover Crop Program guidelines, cereal grains planted as a cover crop prior to November 5 and suppressed via green-chop in the spring are eligible for the grant payment for participation in the Cover Crop Program. In addition, per the Nutrient Management Regulations, a fall application of dairy manure is allowed to a field planted to a cereal cover crop.
Planting a cereal cover crop that will be green chop harvested fits well into the crop rotation used by many dairy farmers. The scenario that many follow is to plant the cereal cover crop following harvest of corn silage. Prior to planting the cover crop, an application of manure is made to the field. The subsequent planting of the cover crop provides incorporation of the manure into the soil. The fall and spring growth of the cover crop is supplied nutrients from the manure. At the same time, the cover crop provides protection to the soil from loss of nutrients via leaching and/or erosion. The objective of this study was to evaluate select varieties of cereal species for cover crop performance and forage production and quality.
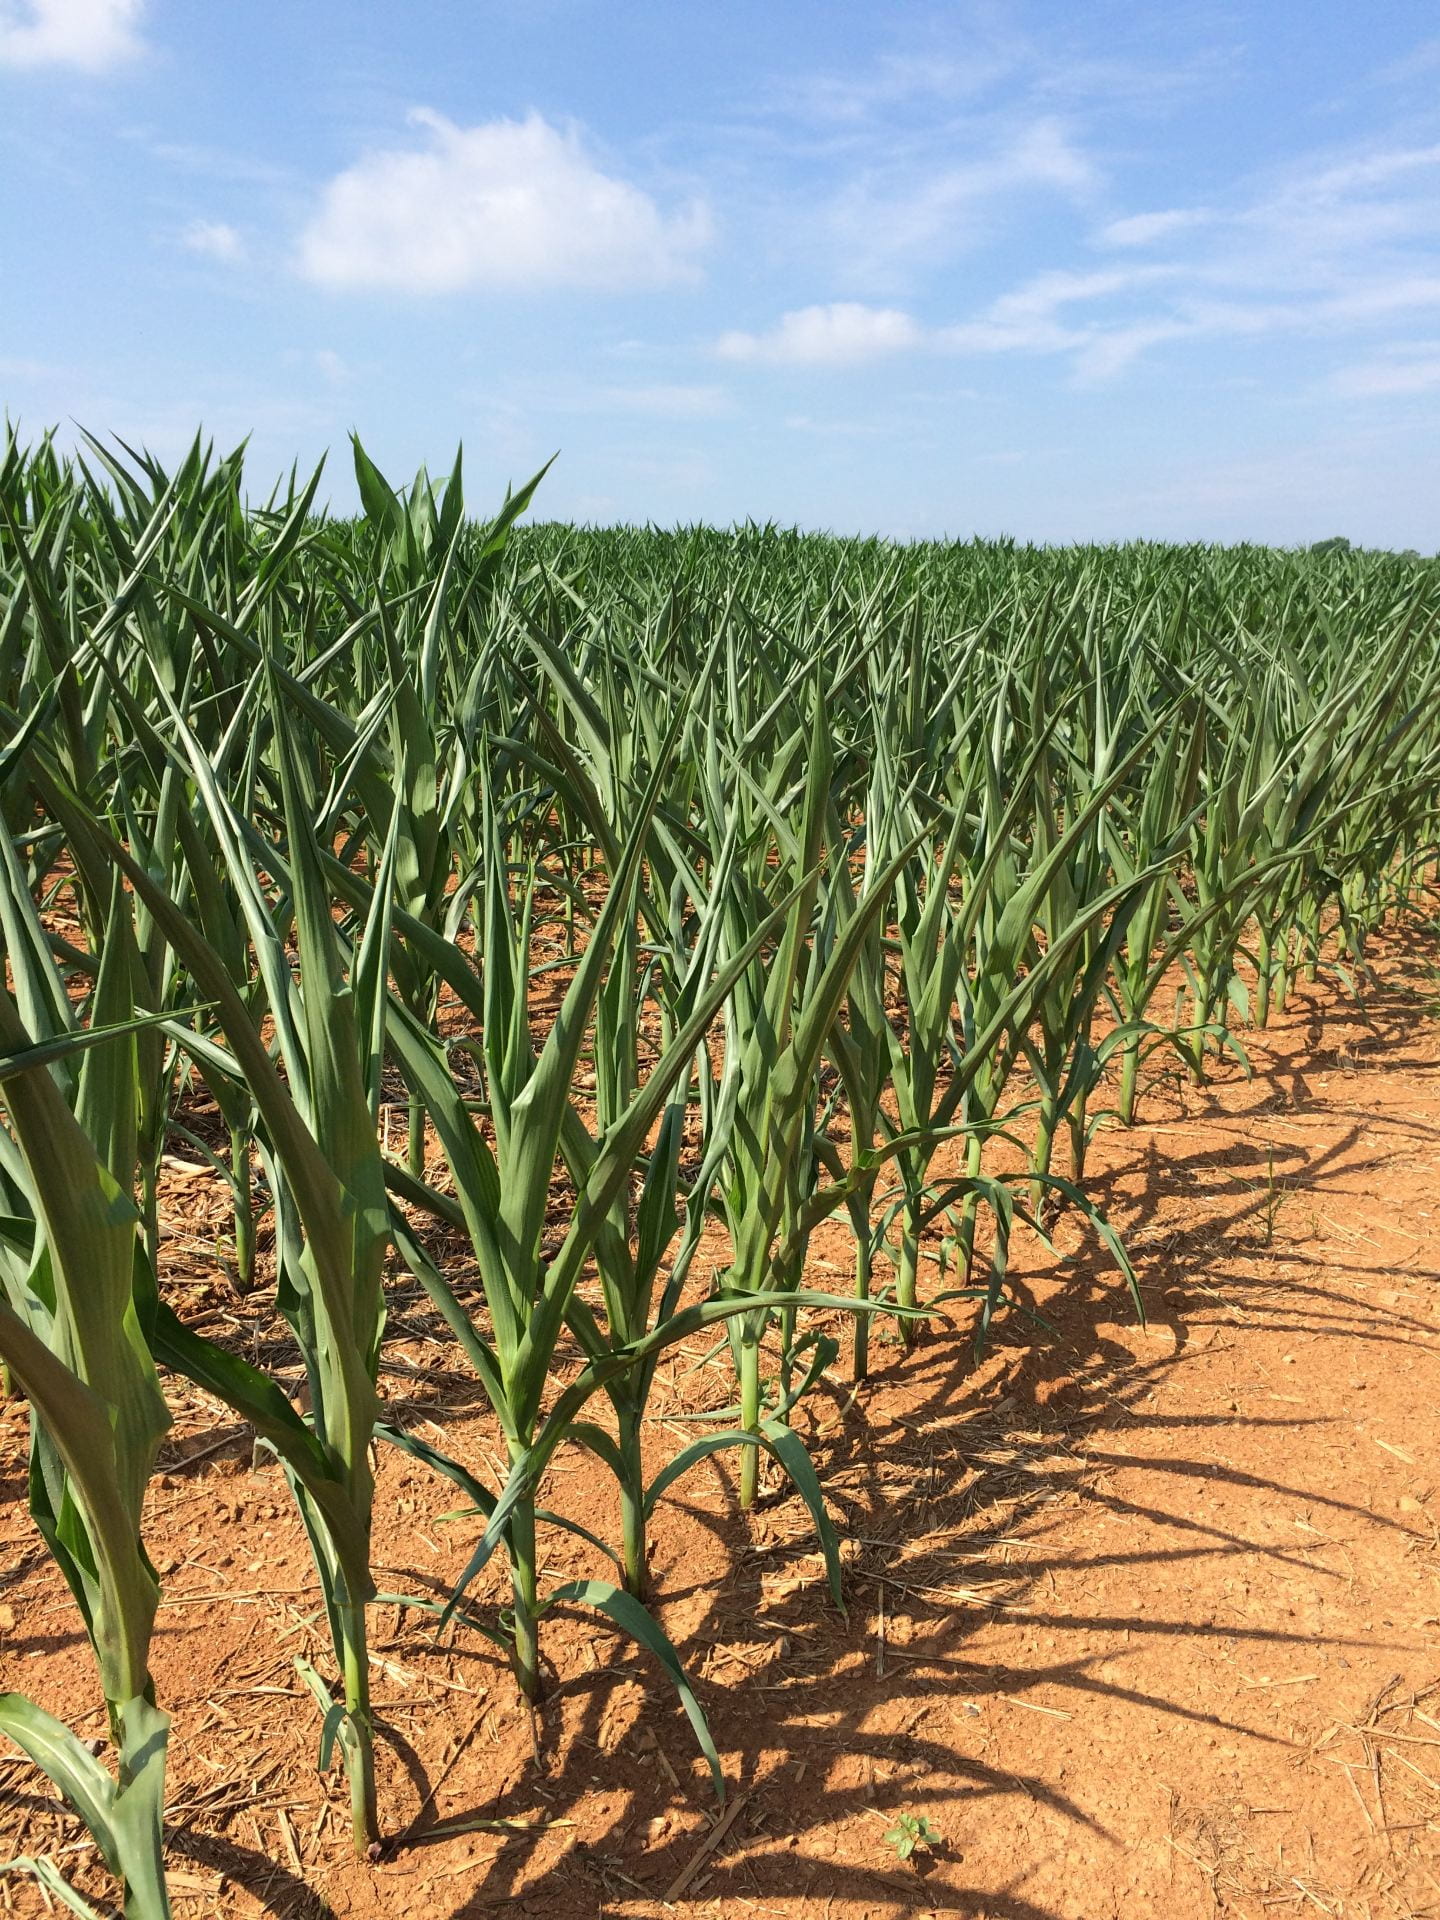
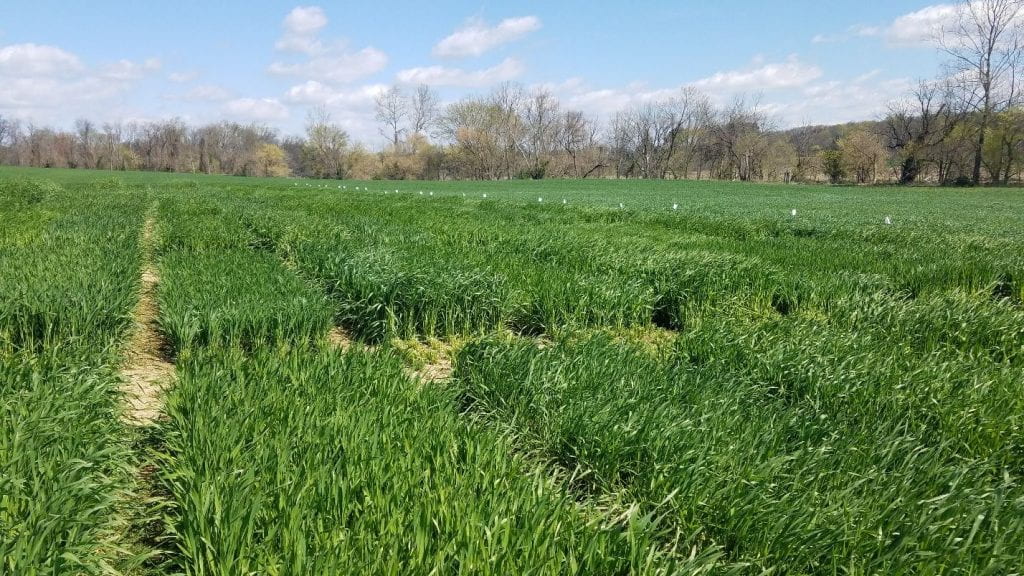
Cereal varieties (21) representing four species (rye, triticale, wheat, barley) were evaluated at Central Maryland Research and Education Center – Clarksville Facility. Three replications for each entry were planted using a randomized complete block experimental design. Planting date was October 11, 2019. The 3’ X 18’ plots were planted with a small plot planter with 6-inch spacing between each of the 7 rows. The germination percentage for each entry was used to calculate the seeding rate needed to establish 1.5 million seedlings. Good stands were established in most plots by late fall.
Our goal each year is to time spring biomass harvest with when entries reach late boot to early heading stage of development. With the cool spring this year, plant growth and development slowed, with heading delayed until mid-May for most entries (Table 2) and harvest dates varying among the entries (listed in Table 1). Each harvest sample was collected by cutting the plants just above ground-level from three center rows of each plot from an area 2.5 feet in length and from two areas within the plot. The samples were placed into cloth bags and dried using a forced air dryer set at 60o C where they remained until sample water content was zero. Each sample was weighed and is reported as pounds of dry matter production per acre (Table 1). Each of the dried samples was ground through a 20-mesh screen using a large plant grinder and the ground biomass samples were sent to Cumberland Valley Analytical Laboratory for standard forage quality analysis.
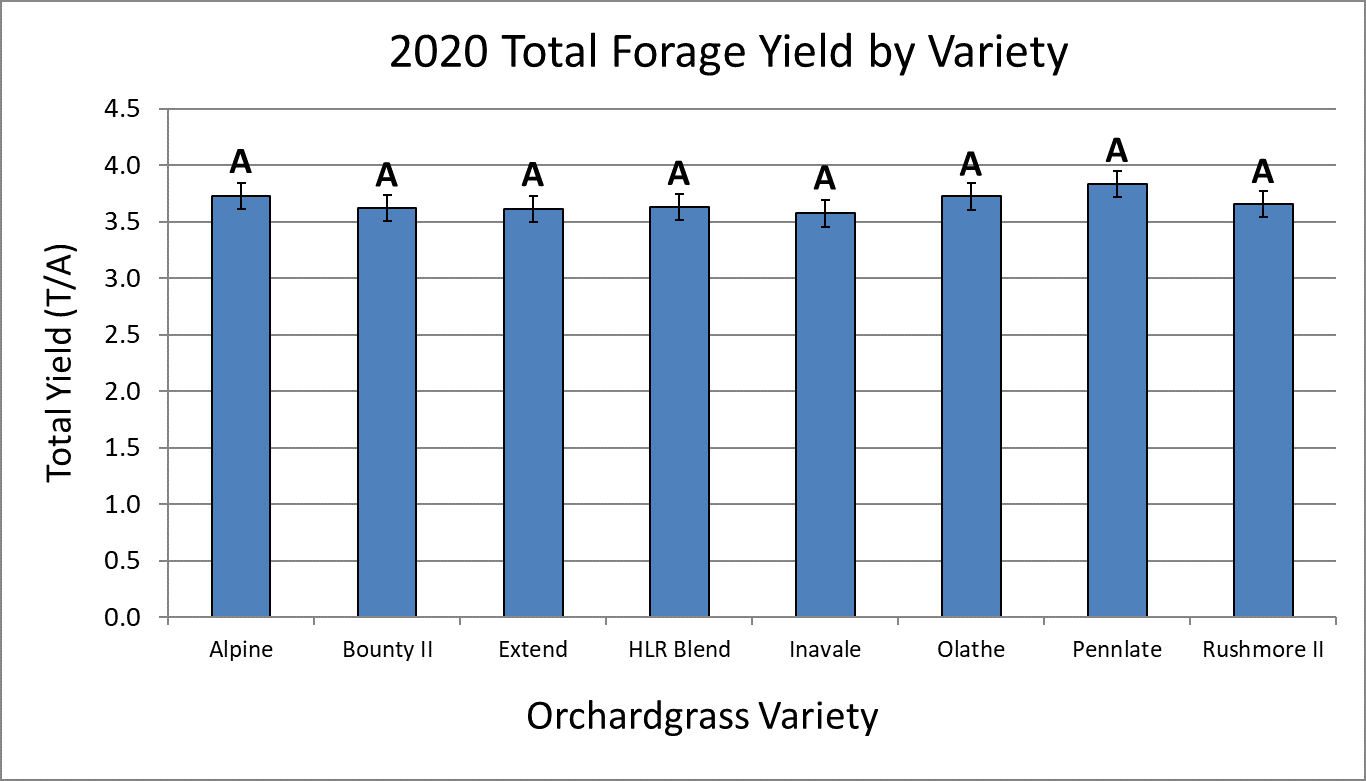
Cover crop performance is measured by amount of biomass produced and the concentration of nitrogen (N) in the biomass. These two factors were used to estimate N uptake (Table 2). The cool weather this spring delayed harvest of this study, likely contributing to the higher biomass and N uptake observed this year compared to last year’s trials. There was no significant difference in nitrogen uptake among the varieties tested. A number of forage quality characteristics for these cereals was measured (Table 2). The descriptions of the various quality characteristic are described here and in the footnotes at the bottom of Table 2. Crude protein (CP) is the N content of the forage, with higher protein representing better feed quality. This value was used to calculate nitrogen uptake of each variety (Nitrogen content = % CP/6.25). Both rye varieties and the barley check variety had significantly greater CP than the overall mean, with a number of triticale varieties having significantly less CP content than the overall mean. One rye and the barley variety also had rumen degradable protein (RDP) content significantly greater than the overall mean.
Neutral and acid detergent fiber (NDF, ADF) are measures of feed value and represent the less digestible components of the plant, with NDF representing total fiber and ADF representing the least digestible plant components. Low NDF and ADF values representing increased digestibility; ideally NDF values should be <50% and ADF values should be <35%. Values of both traits were above the ideal this year, as the late harvest resulted in more mature plants. Despite this, four triticale varieties (TriCal EXP 20T02, BCT 15509, BCT 18001, bCT 19005) had significantly lower NDF and ADF values than the overall mean, representing a digestible triticale varieties. This same variety also had significantly higher total digestible nutrients (TDN), net energy for lactation (NEL), relative feed value (RFV), and non-fiber carbohydrates (NFC), indicating good performing varieties.
The characteristic that best captures the overall forage quality performance is Relative Feed Value (RFV). A RFV of 100 is defined as the forage value that full bloom alfalfa would have. In addition to the triticale varieties mentioned previously, one additional triticale variety (TriCal Gainer 154) and the barley and wheat check varieties had RFV values significantly greater than the overall mean.
Though, none of these green-chop cereal forages are considered to be adequate as a stand-alone feed for a dairy operation, they can supply a source of forage used in a total mixed ration at the time of year when feed supply may be running short. When this forage benefit is added to the environmental benefit that is gained, planting winter cereal cover crops on a dairy farm can be a win-win decision.
Download a PDF copy of this report by clicking here
Acknowledgements
This work could not be accomplished without the assistance and oversight of all field operations by Mr. Louis Thorne and Mr. Joseph Crank. We acknowledge the assistance of the undergraduate students who work with Dr. Jason Wight (Shana Burke and Deonna Cousins) for their assistance with seed packaging.
Table 1. Average harvest date for cereal species evaluated in Clarksville, MD in 2019-2020.
| Variety |
Species |
Average harvest date |
| TriCal Exp 19R01 |
Rye |
May 11 |
| Rye VNS (check) |
Rye |
May 4 |
| Mercer Brand Tri-Cow 814 |
Triticale |
May 4 |
| TriCal Gainer 154 |
Triticale |
May 4 |
| TriCal Flex 719 |
Triticale |
May 13 |
| TriCal Surge |
Triticale |
May 11 |
| TriCal Merlin Max |
Triticale |
May 13 |
| TriCal Thor |
Triticale |
May 13 |
| TriCal Exp 20T02 |
Triticale |
May 13 |
| TriCal Exp 20T03 |
Triticale |
May 13 |
| TriCal Exp 20T04 |
Triticale |
May 27 |
| BCT 15509 |
Triticale |
May 11 |
| BCT 15513 |
Triticale |
May 27 |
| BCT 18001 |
Triticale |
May 13 |
| BCT 18002 |
Triticale |
May 13 |
| BCT 19003 |
Triticale |
May 27 |
| BCT 19004 |
Triticale |
May 13 |
| BCT 19005 |
Triticale |
May 13 |
| BCT 19006 |
Triticale |
May 13 |
| Nomini (check) |
Barley |
April 14 |
| P25R25 (check) |
Wheat |
May 27 |
Table 2. Forage and cover crop performance of cereal species evaluated in Clarksville, MD during 2019-2020 growing season.
| Variety |
Species |
Biomass Yield
lb DM/a |
Head
Date |
1Nitrogen
Uptake
lb N/a |
2Crude
Protein % |
3Soluble Protein
% DM |
4RDP
% DM |
5ADF
% DM |
6NDF
% DM |
7Ash
% DM |
8Total
Digestible
Nutrients
% DM |
9Net
Energy
Lactation
(Mcal/lb) |
10RFV |
11Non Fiber
Carb.
% DM |
| TriCal Exp 19R01 |
Rye |
20655 |
April 17 |
395 |
11.9* |
6.7* |
9.3 |
41.8 |
64.0 |
7.4 |
56.5# |
0.57# |
82.0 |
15.2# |
| Rye VNS (check) |
Rye |
20490 |
May 3 |
351 |
10.7* |
4.4 |
7.6* |
42.5 |
65.6 |
7.4 |
57.2 |
0.58 |
79.2# |
14.4# |
| Rye Mean |
20573 |
April 25 |
373 |
11.3* |
5.6 |
8.4 |
42.2 |
64.8 |
7.4 |
56.9 |
0.58 |
80.6 |
14.8 |
| Mercer Brand Tri-Cow 814 |
Triticale |
23096 |
April 23 |
344 |
9.4 |
3.9 |
6.6 |
39.3 |
62.4 |
7.0 |
59.1 |
0.60 |
87.0 |
19.5 |
| TriCal Gainer 154 |
Triticale |
22925 |
May 4 |
260 |
9.5 |
3.9 |
6.7 |
37.4 |
59.5 |
6.6 |
60.3 |
0.61 |
96.5* |
22.7 |
| TriCal Flex 719 |
Triticale |
24363 |
May 13 |
296 |
7.6# |
2.8# |
5.2# |
42.7* |
64.6 |
7.2 |
57.3 |
0.58 |
80.0# |
19.2 |
| TriCal Surge |
Triticale |
22601 |
May 13 |
312 |
8.5 |
3.0 |
5.8 |
40.8 |
62.0 |
7.7 |
58.2 |
0.59 |
85.5 |
20.1 |
| TriCal Merlin Max |
Triticale |
22618 |
May 13 |
295 |
8.1 |
3.1# |
5.6# |
41.1 |
63.4 |
8.0 |
57.3 |
0.58 |
83.5 |
19.0 |
| TriCal Thor |
Triticale |
27172 |
May 14 |
357 |
8.2 |
3.6 |
5.9 |
44.7* |
65.3 |
7.8 |
55.7# |
0.56# |
78.0# |
17.4 |
| TriCal Exp 20T02 |
Triticale |
23820 |
May 12 |
290 |
7.6# |
2.5# |
5.1# |
34.5# |
54.5# |
7.0 |
62.9* |
0.64* |
106.0* |
29.0* |
| TriCal Exp 20T03 |
Triticale |
24867 |
May 13 |
341 |
8.6 |
3.0# |
5.8 |
41.6 |
61.5 |
8.5* |
57.9 |
0.59 |
85.3 |
19.8 |
| TriCal Exp 20T04 |
Triticale |
28459* |
May 15 |
343 |
7.6# |
4.0 |
5.8 |
48.7* |
72.6* |
7.4 |
52.7# |
0.53# |
65.3# |
11.3# |
| BCT 15509 |
Triticale |
22927 |
May 14 |
318 |
8.6 |
3.8 |
6.2 |
35.3# |
56.9# |
6.9 |
62.1* |
0.63* |
100.5* |
25.7* |
| BCT 15513 |
Triticale |
28316* |
May 16 |
358 |
7.8# |
5.0* |
6.3 |
42.6 |
64.7 |
6.4 |
57.1 |
0.58 |
80.5# |
19.8 |
| BCT 18001 |
Triticale |
25363 |
May 11 |
347 |
8.6 |
3.4 |
6.0 |
37.1# |
56.7# |
7.7 |
61.4* |
0.63* |
98.3* |
25.1* |
| BCT 18002 |
Triticale |
25654 |
May 12 |
318 |
7.8# |
3.1# |
5.4# |
41.6 |
63.2 |
6.5 |
58.4 |
0.60 |
84.0 |
21.1 |
| BCT 19003 |
Triticale |
28526* |
May 16 |
329 |
7.2# |
3.8 |
5.5# |
47.4* |
70.2* |
5.7# |
64.2* |
0.55# |
69.0 |
15.9# |
| BCT 19004 |
Triticale |
28740* |
May 13 |
366 |
7.9# |
2.8# |
5.4# |
41.3 |
62.2 |
7.0 |
58.2 |
0.59 |
85.0 |
21.3 |
| BCT 19005 |
Triticale |
24173 |
May 13 |
332 |
8.6 |
3.0# |
5.8 |
36.6# |
57.7# |
7.1 |
61.4* |
0.63* |
97.5* |
24.7* |
| BCT 19006 |
Triticale |
27915 |
May 12 |
330 |
8.5 |
3.1# |
5.8 |
36.7# |
58.6 |
7.2 |
60.7 |
0.62 |
95.5 |
23.9 |
| Triticale Mean |
25358 |
May 12 |
329 |
8.3 |
3.4 |
5.8 |
40.3 |
61.8 |
7.2 |
58.7 |
0.60 |
87.5 |
21.1 |
| Nomini (check) |
Barley |
15044# |
April 23 |
341 |
14.2* |
6.6* |
10.5* |
34.4# |
55.6 |
9.0* |
61.7* |
0.63* |
104.2* |
19.2 |
| P25R25 (check) |
Wheat |
25376 |
May 16 |
189 |
7.3# |
3.7 |
5.5# |
34. 4# |
53.7 |
5.3# |
62.7* |
0.64* |
107.7* |
32.4* |
| Overall Mean |
24269 |
May 10 |
329 |
8.9 |
3.8 |
6.4 |
39.9 |
61.5 |
7.2 |
58.8 |
0.60 |
88.5 |
20.8 |
| LSD0.1 |
3816 |
2 days |
– |
0.9 |
0.6 |
0.7 |
2.7 |
3.4 |
0.8 |
2.1 |
0.02 |
7.5 |
3.4 |
*,# Indicates the entry was either significantly greater (*) or significantly (#)less than the overall mean for that feed characteristic.
1Nitrogen uptake (lb N/acre) for each entry was estimated by multiplying the lb DM/ac X % nitrogen contained in the DM. The percent nitrogen for each entry was calculated by dividing crude protein by the conversion factor 6.25 which is the average amount of nitrogen (%) contained in protein.
2Crude Protein %: represents total nitrogen content of the forage; higher protein is usually associated with better feed quality.
3Soluble Protein %: non-protein N and portion of true proteins that are readily degraded to ammonia in the rumen.
4RDP (Rumen Degradable Protein): portion of crude protein that microbes can either digest or degrade to ammonia and amino acids in the rumen.
5ADF (Acid Detergent Fiber): represents the least digestible fiber portion of forage; the lower the ADF value the greater the digestibility.
6NDF (Neutral Detergent Fiber): insoluble fraction of forage used to estimate the total fiber constituents of a feedstock.
7Ash: mineral elements of the forage.
8TDN (Total Digestible Nutrients): measure of the energy value of the forage.
9Net Energy Lactation: estimate of the energy in a feed used for maintenance plus lactation during milk production.
10RFV (Relative Feed Value): indicates how well an animal will eat and digest a forage if it is fed as the only source of energy.
11Non Fiber Carbohydrates: represents all forms of digestible carbohydrates (starch, sugar, pectin, and fermentation acids) in the forage.
Table 3. Brands and companies in the 2019-2020 Maryland cereal forage trials.
| Brand |
Address |
| Eddie Mercer Agri-Services, Inc. |
6900 Linganore Road
Frederick, Maryland 21701
www.eddiemerceragri-services.com |
| Seed-Link Inc. |
208 St. David Street
Lindsay, Ontario (Canada) K9V-4Z4
www.seed-link.ca |
| TriCal Superior Forage |
12167 Highway 70S
Vernon, Texas 76384
tricalforage.com |