Until last year, public transportation ridership in the United States was increasing at least three times more quickly than rides with private transportation network service (TNS) companies such as Uber and Lyft. That may be hard to imagine—especially amid the COVID-19 pandemic, with near-empty buses and subway cars traveling through major cities. But even before the pandemic, the budget shortfalls that persistently burden public transit agencies may have led people to conclude that subway and bus ridership were declining, perhaps as a result of the expansion of TNS companies. Although TNS companies have grown significantly in recent years, the data we have for public transportation and TNS ridership contradict some widely held assumptions.
Lessons from the National Household Travel Survey
Let’s start by comparing total TNS ridership with total bus and subway use across the country. The National Household Travel Survey (NHTS) collects data on travel behavior from a sample of US households. This survey is a useful data source because it covers a long time period—the study has been conducted eight times between 1969 and 2017—and provides details about travel behavior across the entire country. According to the NHTS, the average household in 2001 traveled 96 person-miles per day. (A person-mile is one mile traveled by one person; two people taking a car for a three-mile trip counts as six person-miles.) Taxis and limos accounted for 0.24 percent of that travel, whereas buses and subways accounted for about 10 times as much. By 2017, TNS rides accounted for 0.5 percent of total travel, at most, while in the same year, bus and subway travel accounted for about 4.5 percent of travel—again, nearly 10 times more than TNS rides.
Those are the aggregate numbers; Figure 1 tells a similar story, but broken down for the 10 largest metro areas in the United States between 2001 and 2017. Across these 10 cities, TNS ridership grew by less than 0.5 percentage points, whereas bus and subway ridership grew by close to 3 percentage points on average. Though not shown in Figure 1, private vehicle use declined during the same period.
Figure 1. 2001–2017 Change in Share of Public Transportation and Private Transportation Network Service Companies by Metro Area, Measured in Person-Miles Traveled
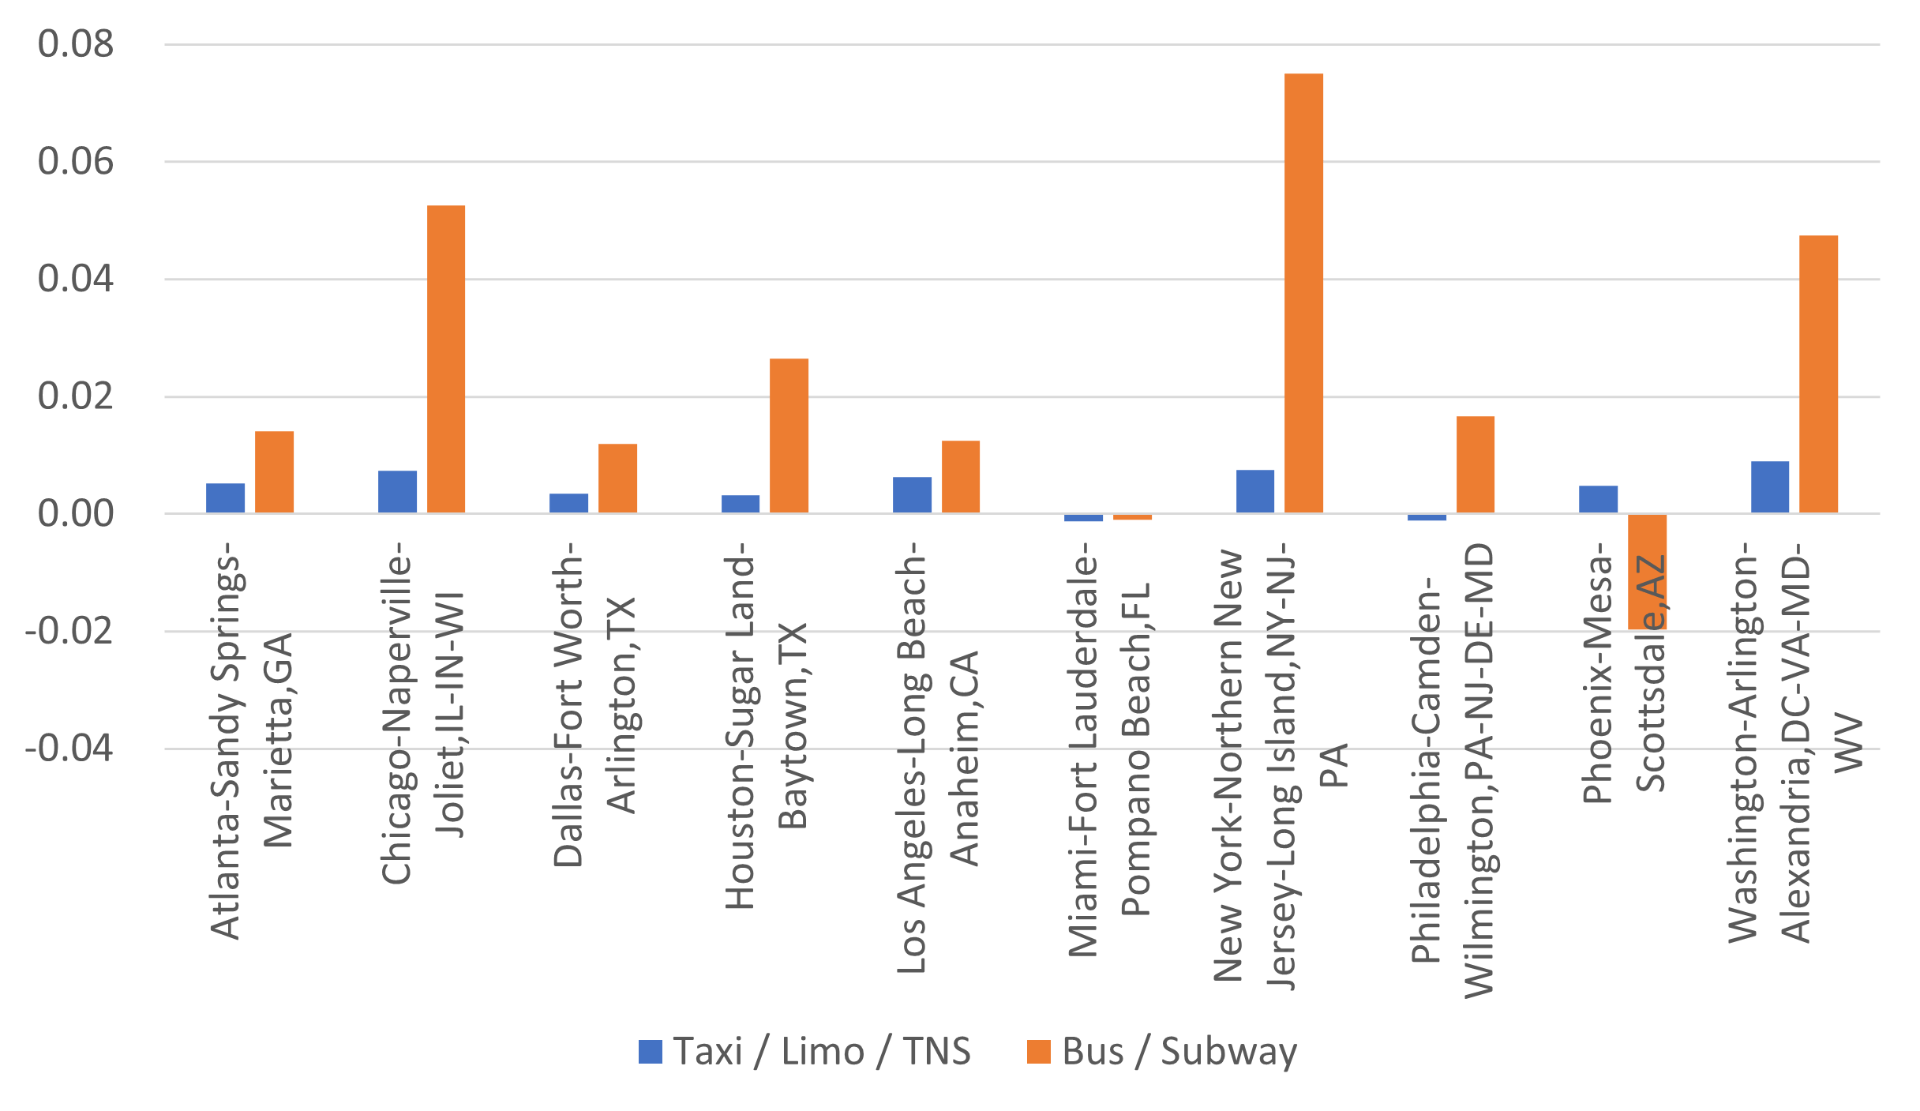
The NHTS data are less clear on whether TNS ridership is eating into bus and subway travel. On the one hand, the data show a positive correlation across cities between the growth in TNS ridership and the growth in bus and subway ridership. On the other hand, without TNS rides, maybe bus and subway use would have been even higher. Moreover, the NHTS data just provide snapshots of travel in 2001 and 2017; as we’ll see below, public transportation ridership has decreased in many cities in the past five years (i.e., even before the COVID-19 pandemic), and some research indicates that TNS ridership has contributed significantly to this decline. But at this point, research on the effects of TNS ridership on public transportation hasn’t settled on a single answer.
Longer-Term Ridership Trends
The NHTS data are useful for understanding travel patterns at specific points in time. Now, let’s examine long-term trends in public transportation ridership. Figure 2 shows US Department of Transportation data on public transportation ridership with total passenger miles (buses and trains) and total number of trips for the 20 largest US metro areas. These cities account for roughly 90 percent of all public transportation use in the United States.
Figure 2. Public Transportation Passenger Miles and Trips in the 20 Largest Metro Areas of the United States
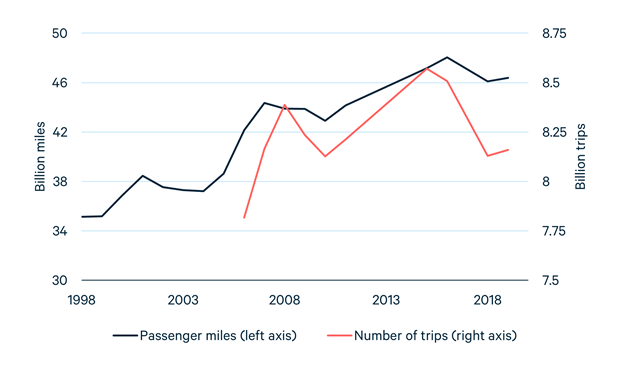
As Figure 2 shows, both miles traveled and number of trips have increased over the 20-year period, although ridership levels off and starts to decline after 2015. But because populations have increased in many of these large metro areas, population growth may explain these upward trends. Figure 3 controls for population growth, showing that miles per person have increased steadily, whereas the number of trips has remained flat overall, although it declined in the most recent years. Taken together, these data indicate that the number of trips per person has stayed fairly constant, but people are taking longer trips on average. While it’s hard to definitively determine the underlying explanation for these trends, longer commutes could explain the increasing trip length.
Figure 3. Annual Public Transportation Passenger Miles and Trips per Person in the 20 Largest Metro Areas of the United States

What should we make of these trends in public transportation and TNS ridership, particularly as we imagine life returning back to normal—or at least getting less abnormal—over the course of the next year? And what are the implications for public transportation funding, given that COVID-19 has massively reduced ridership and revenue, which in turn has created huge budget problems for public transit systems?
Importantly, the trends explored here contradict the notion that demand for public transportation is experiencing a long-term decline. The robust long-term demand that we observe for buses and trains strengthens the case for helping these public transportation systems survive the current crisis and return to normal service levels over the next year.
This article also appears on Resources for the Future’s Common Resources blog.