http://www.psla.umd.edu/extension/md-crops
Agronomy Facts No. 32 is prepared by Dr. Nicole Fiorellino, Mr. Louis Thorne, and Mr. Joseph Crank

Click here to download the full report
Test Procedures
The University of Maryland offers a fee-based, soybean variety performance testing program to local and national seed companies. The results from these replicated trials provide agronomic performance information about soybean varieties tested at four locations in Maryland considered representative of the state’s geography and weather conditions. Table 1 summarizes the agronomic and production information for each test site.
Varieties tested in 2021 were entered by participating seed companies, listed in Table 2, that were solicited for submission of varieties. These varieties represented those currently available for purchase to experimental lines still under evaluation. Select Pioneer and Syngenta varieties were identified for use as checks in the test. The inclusion of the performance data for check varieties that are proven performers in the Mid-Atlantic region allows comparisons of newer varieties to proven varieties.
During 2021, 85 varieties were tested using four maturity groups: MG 3 (22 varieties, Table 6), early MG 4 (4.0-4.3, 21 varieties, Table 7), late MG 4 (>4.4, 36 varieties, Table 8) and MG 5 (6 varieties, Table 9). Check varieties were included in each of the tests. All genetic traits and seed treatments are listed in Tables 6-9.
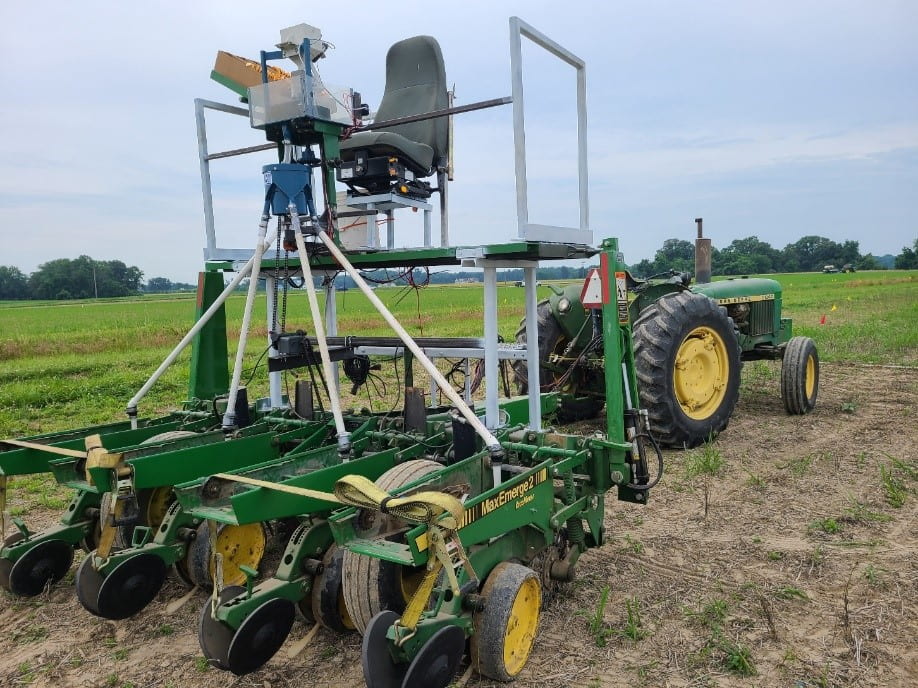
Each variety was replicated three times per location. For 2021, we modified a John Deere Maxemerge 2 four-row, 30” spacing, no-till planter, with coulters and trash wheels. The modifications included the addition of a single cone planting unit that delivered seed to a spinner powered by a 12v motor to evenly distribute seed to the four planter units (Figure 1). Planting, harvest, and in-season management information is presented in Tables 1 and 2. We aimed for a seeding rate of 6-7 seeds/foot and plot harvest length was approximately 20 feet, but harvested plot length varied slightly across locations. Center two rows (~5 ft. swath) were harvested with an Almaco R1 research combine (Almaco Co., Nevada, IA). Grain yield, harvest moisture, and test weight were measured for each plot. These data were collected with a Seed Spector LRX system (Almaco Co., Nevada, IA) and recorded on Microsoft xTablet T1600. Due to the fabrication of the new planter, planting dates were slightly delayed – especially in the double crop tests. We believe this negatively impacted yields in these tests. Additionally, there was ample stover present on the surface at Central Maryland Research and Education Center when planting, and we believe poor seed-to-soil contact at planting negatively impacted yield at this location. Despite late planting, we were able to harvest plots in a timely manner, due to favorable fall weather conditions.
Test Results
The overall performance across the locations for the full season varieties in each maturity group is reported in Tables 10-13 and double crop varieties in Tables 28-31. Variety performance at individual locations can be found in Tables 14-27. The agronomic characteristics reported are yield, in bushels/acre at 13% moisture content, test weight (lb/bu) at 13% moisture, height in inches (at Wye location, one replication) and date to maturity (at Wye location, one replication).
A least significant difference (LSD) value is reported for each test where statistically significant differences (P ≤ 0.1) for yield was observed among varieties. The mean separation value has been calculated at the 10% probability level (LSD0.1). The LSD can be used to compare two varieties within the same test. For example, when the yield difference between two varieties is greater than the LSD value, there is a 90% certainty that the difference in yield is due to variety performance rather than due to random variability.
Relative Yield
The selection of a variety based solely on performance at one location is not recommended. It is better to select variety based upon performance over a number of locations and years, if possible. To compare the performance of each variety across the five locations, relative yield tables (Tables 32-35) are included. Relative yield is the ratio of the yield of a variety at a location to the mean yield of all the varieties at that location expressed in percentage. A variety that has a relative yield consistently greater than 100 across all testing locations is considered to have excellent stability.
Acknowledgments
The University of Maryland Agronomy Trials Center work would not be possible without the assistance and oversight of equipment maintenance, seed packaging, planting, data collection, and plot harvest by faculty research assistant, Louis Thorne. This work could not be accomplished without the assistance of research technician Joseph Crank during the season. Also, we acknowledge the undergraduate students for their assistance with seed packaging. Thank you to the crew at Wye Research and Education Center for sharing your experience, tools, and space in your shop with Louis Thorne as he continues to keep our equipment running. Table 1 outlines the crews at each test location who assisted with land preparation, flagging, plot management, and harvest. I personally would like to acknowledge each farm manager, David Armentrout, John Draper, Ryan McDonald, and Douglas Price for their continued support of the Agronomy Trials Center and their continued patience with me.
Additional Information
The inclusion of varieties in these tests is not an endorsement by the University of Maryland. Advertising statements about a company’s varieties can be made as long as they are accurate statements about the data as published. Statements similar to “See the Maryland Soybean Tests Agronomy Facts No. 32” or “Endorsement or recommendation by the University of Maryland is not implied” must accompany any reproduced information.
