Shannon Dill, Principal Agriculture Agent University of Maryland Extension, Talbot County
The University of Maryland Extension has updated extension.umd.edu/grainmarketing site with new input data and spray programs for the 2020 field crop budgets.
Crop Budgets
Cost of production is very important when making decisions related to your farm enterprise and grain marketing. Enterprise budgets provide valuable information regarding individual enterprises on the farm. This tool enables farm managers to make decisions regarding enterprises and plan for the coming production year. An enterprise budget uses farm revenue, variable cost, fixed cost and net income to provide a clear picture of the financial health of each farm enterprise.
The 2020 Maryland enterprise budgets were developed using average yields and estimated input cost based upon producer and farm supplier data. The figures presented are averages and vary greatly from one farm and region to the other. It is therefore crucial to input actual farm data when completing enterprise budgets for your farm.
How to Use University Enterprise Budgets:
The enterprise budgets can be used as a baseline for your operation. Make changes to these budgets to include your production techniques, inputs and overall management. New spray programs were added for herbicide resistant weeds.
The budgets are available electronically in PDF or Excel online at www.extension.umd.edu/grainmarketing. Use this document as a start or reference to create your crop budgets. If you have problems downloading any of these budgets, contact information is located on the website.
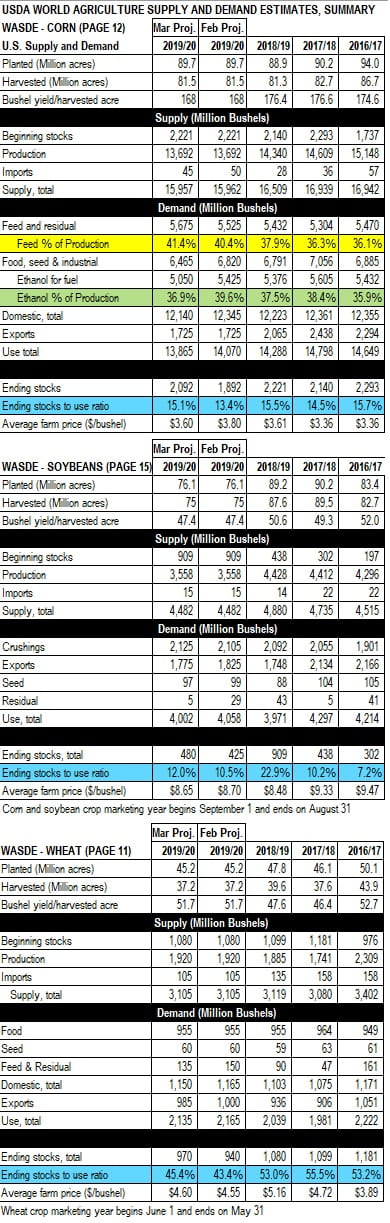
The following is a summary of the April 9 WASDE published on April 9. As expected, ethanol production was down significantly from the March report due to factors related to COVID-19 and the overproduction of crude oil by Russian and Saudi Arabia. These factors decreased demand for corn by 375 million bushel. This was partially offset by an increase in the estimate for feed and residual of 150 million bushel. The net effect is an increase of 200 million bushel of corn in ending stocks and an associated increase in the ending stocks to use ratio from 13.4% to 15.1%
Soybean exports were down 50 million bushel and with other minor adjustments increased the ending stocks from 425 to 480 million bushel and an increase in the stocks to use ratio from 10.5% to 12.0%.
Wheat feed and exports were down, increasing the ending stocks from 940 to 970 million bushel and an associated increase in the ending stocks to use ratio from 43.4% to 45.4%.
These changes in estimates were mostly expected so they had little effect on futures prices.
Andrew Kness, Agriculture Agent University of Maryland Extension, Harford County
Given current commodity prices, growers may be considering increased corn acreage. Continuous corn presents additional risks in terms of disease that you need to proactively manage. Here are some points to consider so that you can try to stack the deck in your favor in case conditions become favorable for pathogens that threaten corn yields.
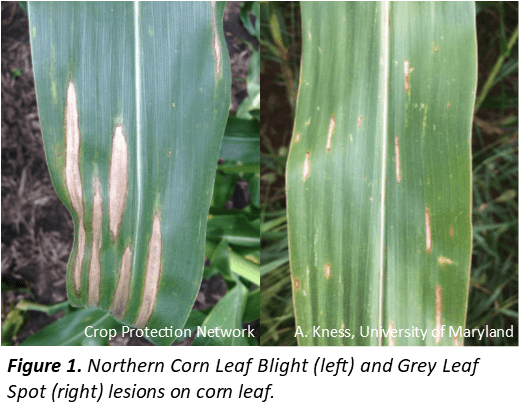
Here in our region of the world, we typically have plenty of humidity and moisture that favor disease development in our crops. Furthermore, our most common and potentially most severe yield-limiting diseases, such as grey leaf spot (GLS), northern corn leaf blight (NCLB) (Figure 1), as well as stalk rots, are residue-borne and overwinter in corn stover. The following are points to consider for disease management in a corn-on-corn system:
Variety Selection: You can do yourself a big favor right off the bat by selecting hybrids that have good stalk integrity ratings and resistance to NCLB and GLS. Genetic resistance is one of the most cost-effective ways to manage disease. If you’re planting corn into corn, especially in a reduced or no-till situation, place hybrids with good NCLB and GLS resistance in these fields and save your more susceptible hybrids for fields that have lower disease potential (for example, after soybeans).
Residue Management: Several pathogens of corn survive and overwinter in corn residue; therefore, residue is the primary source of infection. Not surprisingly, more corn residue present on the soil surface means that the following corn crop is at a higher risk of developing these diseases. While no-till and reduced-till systems afford us many benefits in crop production, harboring pathogen inoculum is one of the drawbacks. Chopping and sizing corn residue in the fall into smaller pieces can help accelerate its decomposition and may reduce inoculum (spores) slightly at best. In order to reduce inoculum significantly, more aggressive tillage is necessary to bury the residue. If you’re trying to build soil health and utilize no-till or reduced tillage, this may not be an option and you will need to make sure you are doing a good job in all other areas of disease management.
Planting: Getting planting equipment and planting conditions correct is important, especially for seedling and root-rotting diseases of corn. Ensure you’re achieving proper planting depth, as the longer the seed sits in the ground, the more prone it will be to rot and dampen off. Soil temperature is important for getting the seedings off to a quick start, so it is advisable to wait until soil temperatures are at least 50 degrees and rising to plant; this is especially important for corn-on-corn. Fields with reduced tillage, cover crops, and substantial cover will warm up slower than tilled fields or fields with less cover (i.e. last year’s soybean fields). You may consider planting corn in last year’s bean fields first, then your corn after corn fields to ensure soils are warm enough for rapid and uniform emergence. Additionally, do not push plant populations too high, as excessive plant populations can cause dense canopy humidity which favors disease development and can stress plants if nutrients and/or water become limiting, which will predispose plants to pathogen infection.
Seed Treatments: Nearly all commercial corn hybrids come pre-treated with seed treatments, which typically contain a fungicide. These fungicides will provide some protection from many seed and root-rotting pathogens for about two weeks.
Weather and Scouting: Weather plays a crucial role in disease development. Cool, saturated soils in the spring favor the development of our seed and root-rotting diseases. Moisture, humidity and excessive leaf wetness, coupled with moderate to warm temperatures favor the development of NCLB and GLS (64-81°F for NCLB, 70-90°F favor GLS). Both of these pathogens will infect susceptible and moderately susceptible hybrids throughout the growing season as long as the weather is conducive for their development; however, you want to keep an eye on them as to where their lesions are present on the plant. Infections on the lower leaves have no impact on yield; however, if they infect the ear leaf and above, there is a potential for significant yield reduction. Scout your fields at least weekly as plants approach tasseling to make sure NCLB and GLS are not encroaching on the ear leaf. Look for the presence of lesions as shown in Figure 1. If infections are approaching the ear leaf, then you may want to consider a fungicide application.
Fungicides: Fungicides can be an important management tool for foliar fungal pathogens, in particular NCLB and GLS. If temperatures remain between 65-90°F in conjunction with high humidity and excessive leaf wetness as the plants approach reproductive stages, then a fungicide application around tasseling (VT) may be beneficial to protect yield. Determining whether a fungicide application will be economically beneficial is the difficult part, and knowing your cost of application can help you make a decision so that you know how many bushels you need in return to pay for the fungicide. There have been hundreds of University fungicide trials conducted on corn over the years, and less than 50% of the time are fungicide applications economical. It is important to realize that there are conditions where a fungicide application is more likely to pay; they are: 1.) Applied at VT to a susceptible or moderately susceptible corn hybrid, 2.) Corn-on-corn, especially in no-till fields, 3.) environmental conditions are favorable for disease development (warm, humid, and leaf wetness) at the time around VT.There is also interest in applying fungicides for perceived stalk strength benefits. In general, fungicides will not improve stalk strength directly, rather indirectly by managing foliar diseases. Stalk rots are strongly correlated to disease severity on the flag leaf. When photosynthetic area of the flag leaf is reduced due to pathogen lesions on the leaves, the corn plant cannibalizes the carbohydrates stored in its stalk in order to fill the grain, thereby compromising stalk integrity. Therefore, if you keep the ear leaf clean, you will greatly reduce stalk rots and improve standability, which is where fungicides can help. This is why it is important to scout your fields, look for disease, then determine if a fungicide application is warranted.
Planting corn after corn poses additional risks that favor the development of disease in your crop. By talking into account these steps, hopefully you can better manage your crop and put more dollars in the bank.
Several of you continue to ask me when you might see checks from the Syngenta corn seed settlement. In late 2018, the court approved the settlement order for the $1.51 billion MIR162 Syngenta settlement. Based on the final order, payments to producers should have started going out in the second quarter of 2019, but this did not happen. On January 3, 2020, the federal district court in Kansas approved the final settlement. Growers have one last step: provide the claims administrator with an IRS W-9 form either online or by mailing a form into Corn Seed Settlement Program Claims Administrator, P.O. Box 26226, Richmond, Virginia 23260.
The settlement includes all U.S. corn farmers, including those who opted out of the original class-action suit and those who grew Agrisure Duracade corn and Agrisure Viptera corn varieties. The settlement also includes landlords who based rental rates on yield or price, such as a flex-lease based on yield or price or a crop-share lease. Fixed cash landlords are not eligible to participate. The period included in the settlement is September 15, 2013, through the 2018 crop year.
The settlement includes four classes:
Class 1: Growers and eligible landlords who did not use Duricade or Viptera,
Class 2: Growers and eligible landlords who did use Duricade or Viptera,
Class 3: Grain handlers, and
Class 4: Ethanol producers.
Claims to three of the four classes will have limited recovery amounts:
Class 1 will receive a minimum of $1.44 billion, with the bulk of the settlement going to corn growers and eligible landlords who did not grow Duricade or Viptera corn seeds.
Class 2 will be limited to $22.6 million,
Class 3 will be limited to $29.9 million, and
Class 4 will be limited to $19.5 million.
As a part of the settlement order, the court set aside $503,333,333.33 for attorneys’ fees.
Based on the recent information, producers should be receiving Notice of Determination forms showing the producer’s portion of the settlement. Expects checks to go out later in 2020. How much can you expect to receive in this settlement? That is still not clear and something I cannot accurately answer.
This latest move means this settlement process should be winding up. Many of the ongoing appeals appear to be resolving themselves with this settlement. If the situation changes, I will provide further information.
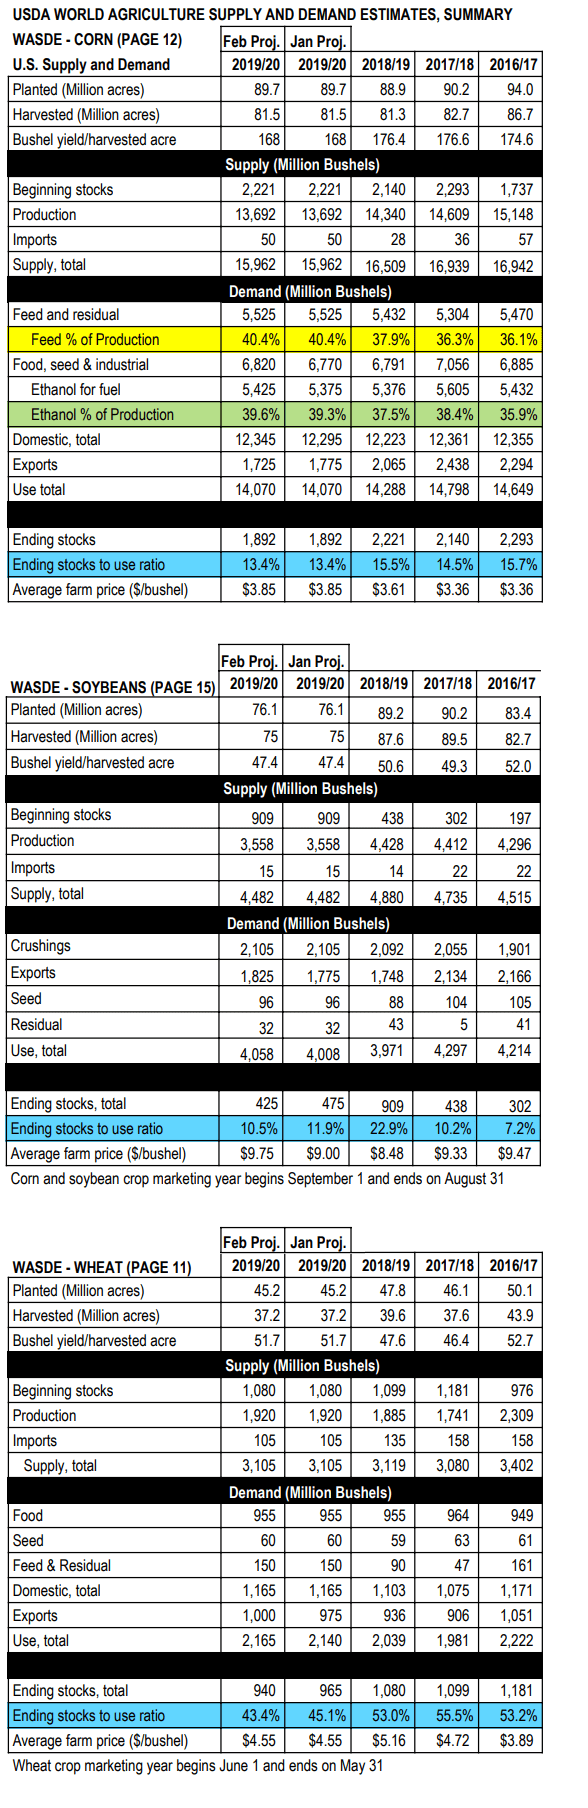
Attached is a summary for the February WASDE published Tuesday. There was a 50 million bushel increase in the estimate of corn use for ethanol but this increase was offset by a 50 million decrease in the estimate of corn exports and so there was no change in supply, demand or ending stocks.
There was a significant 50 million bushel increase in the estimate for soybean exports. With all other supply and demand factors unchanged this decreased the stocks to use ratio from 11.9% to 10.5%. However, this was anticipated so there was no significant increase in Soybean futures on Tuesday.
There was a 25 million bushel increase in the estimates for wheat exports with all other supply and demand factors unchanged. However with the large ending stocks of wheat, this change was relatively insignificant.
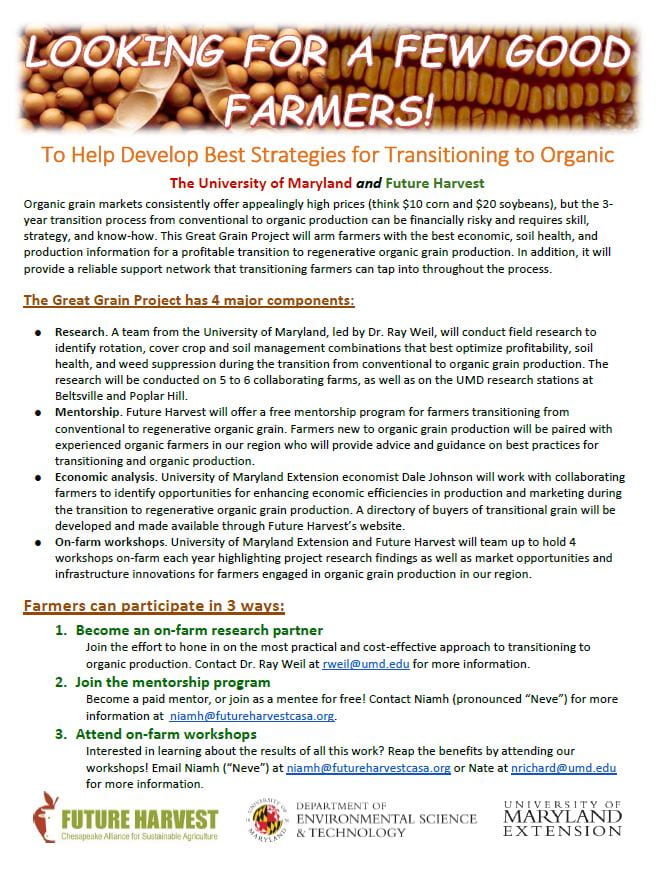
Researchers at the University of Maryland are looking for farmers interested in partnering with them on a project to help develop strategies for transitioning to organic grain production. Please see the attached flier for details. Contact Dr. Ray Weil for additional information (rweil@umd.edu).
Maria Cramer, Edwin Afful, Galen Dively, and Kelly Hamby Department of Entomology, University of Maryland
Slug feeding damage: characteristic long, thin holes made by a rasping mouthpart.
Background: Multiple insecticide options are available for early-season corn pest management, including neonicotinoid seed treatments (NSTs) and in-furrow pyrethroids such as Capture LFR®. In addition, many Bt corn hybrids provide protection against seedling foliar pests such as cutworm and armyworm. Given that almost all corn seed is treated with neonicotinoid seed treatments (NSTs), Capture LFR® may not provide any additional protection.
Methods: In this study we compared four treatments: fungicide seed treatments alone; Capture LFR® (active ingredient: bifenthrin) applied in the planting furrow with the fungicide seed treatment; Cruiser Maxx® 250, an NST (active ingredient: thiamethoxam), which includes a fungicide; and Capture LFR® + Cruiser Maxx® 250 together. We evaluated the amount of soil and foliar pest damage after emergence. Yield was measured at harvest.
Preliminary results: Our results suggest that when wireworm pressure is high, Capture LFR® and Cruiser Maxx® 250 protect against damage and significantly increase yields. Neither treatment is superior, so we recommend using only one, and only in fields where pest pressure is known to be high. As most corn seed already contains NSTs, use of Capture LFR® at planting is unlikely to be warranted.
Sampling for soil and foliar pests
Background: Capture LFR®, an in-furrow pyrethroid product, is marketed for control of early-season corn pests, including soil pests such as white grub and wireworm and above-ground pests such as cutworm and armyworm. However, the insect pest management systems already adopted in corn may provide sufficient protection. Most corn seeds are treated with NSTs, which provide seedlings with systemic protection from many soil and above-ground pests. Additionally, most Bt corn hybrids express proteins with efficacy against cutworm and armyworm in the seedling stage, although they do not affect soil pests. Unlike NSTs and Bt traits, pyrethroids are not systemic and do not provide protection beyond the soil area to which they are applied.
While in-furrow applications of bifenthrin (the active ingredient in Capture LFR®) can effectively reduce wireworm damage in potatoes1 and provides white grub control in field corn2,3, it does not consistently increase yield in corn3 or soybeans4. Yield benefits are likely to be seen only where there is known soil pest pressure. Meanwhile, preventative applications of pyrethroids have been linked to declines in natural enemies 5,6, including carabid beetles, which are important predators of slugs.
Objectives: Our objectives were to determine whether in-furrow applications of Capture LFR® (bifenthrin) provided 1) protection against soil pests, 2) protection against seedling pests, and 3) yield benefits compared with fungicide alone, Cruiser Maxx® 250, or combined with Cruiser Maxx® 250.
Methods: This study was conducted in 2018 and 2019 at the University of Maryland research farm in Beltsville, MD. We planted 4 replicate plots of a standard Bt field corn hybrid, TA 758-22DP (VT Double Pro insect control) in 2018 and LC1488 VT2P (SmartStax RIB complete insect control) in 2019 at 29,999 seeds per acre. Plots were planted late in 2018 (June 18) but on time in 2019 (May 20). Standard agronomic growing practices for the region were used. We compared the following four treatments, applied at planting:
No in-furrow application
In-furrow Capture LFR®
Applied at 13.6 fl oz/ac
Fungicide seed treatment
Fungicide (F) seed treatment alone
2018: Maxim Quattro®
2019: Vibrance Cinco®
Fungicide +
Capture LFR® (F + Cap)
Cruiser Maxx® 250
Cruiser Maxx® 250
(Cru)
Cruiser Maxx® 250 + Capture LFR® (Cru +Cap)
We sampled plants 24 days after planting in 2018, and 18 days after planting in 2019. In 2018, we recorded the number of stunted plants (indicating potential soil pest damage), and in 2019, we dug up stunted plants and recorded those for which soil pest damage could be confirmed. In both years, we assessed rates of above-ground feeding by pests such as cutworm and armyworm.
Wireworm (left) and characteristic above-ground symptoms of wireworm feeding (right). Note wilted center leaf.Results: Soil Pests. In 2018 there was no difference in the percent stunted plants between treatments (Figure 1), with less than 5% stunting in all treatments. This low level of pest damage may have been due to the late planting date, which could have avoided peak soil pest pressure. In 2019, all of the insecticide treatments had significantly lower soil pest damage than the fungicide control (Figure 1). Combining Capture LFR® with Cruiser Maxx® 250 was not more effective than Cruiser Maxx® 250 alone, but was more effective than Capture LFR® alone, suggesting that treatments involving Cruiser Maxx® 250 are somewhat more effective against the soil pests at this farm. In both years, plots were located in a field with a history of wireworms; however, damage was only observed in 2019. In a field without pest pressure, such as we saw in 2018, these treatments did not improve plant stand.
Foliar pests. In both 2018 and 2019, rates of foliar damage were extremely low (below 5% of plants) in all treatments and there were no differences between treatments.
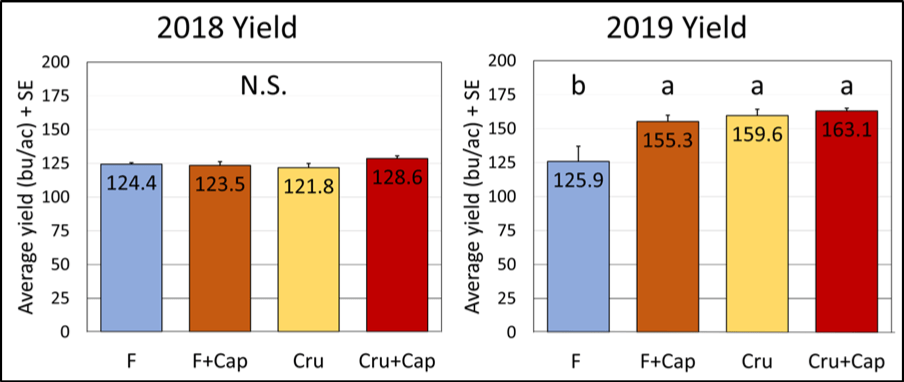
Yield. In 2018, there were no yield differences between the treatments (Figure 2). Overall, we had low yields in 2018, likely a result of the late planting date. In 2019, all of the insecticide treatments had significantly higher yields than the fungicide control, with no differences between any of the insecticide treatments (Figure 2). Combining Capture LFR® with Cruiser Maxx® 250 did not increase yield.
Figure 1. 2018 and 2019 soil pest pressure, Beltsville, MD. Mean percent plants damaged for four treatments: F=Fungicide, F+Cap= Fungicide + Capture LFR®, Cru=Cruiser Maxx® 250, Cru+Cap= Cruiser Maxx® 250 + Capture LFR®. In 2018, treatments did not impact stunted plants (N.S.) In 2019, all insecticide treatments significantly reduced soil pest damage (columns with different letters have significantly different mean damage).Figure 2. 2018 and 2019 yields, Beltsville, MD. Mean yield for four treatments: F=Fungicide, F+Cap= Fungicide + Capture LFR®, Cru=Cruiser Maxx® 250, Cru+Cap= Cruiser Maxx® 250 + Capture LFR®. Yields were not significantly different in 2018 (N.S). In 2019, all insecticide treatments had significantly higher yield than the fungicide only treatment (columns with different letters have significantly different mean yield).
Conclusions: In 2018 and 2019 we did not see sufficient foliar pest pressure to justify an insecticide application. This may be due to effective control by Bt proteins in the corn hybrids and/or low foliar pest pressure.
In a field with established wireworm pressure, all three insecticide treatments reduced soil pest damage and improved yield relative to a fungicide only control in the 2019 field season. While there were differences in pest damage levels between the different insecticide treatments, no one treatment provided superior yield benefits. Because nearly all corn seed is treated with NSTs like Cruiser Maxx® 250, additional applications of Capture LFR® may not be necessary. Preventative applications increase costs and present risks to beneficial insects without providing yield benefits. Additionally, soil pest pressure tends to be low throughout Maryland. We sampled untreated corn at five locations across Maryland in 2019 and found on average less than 3% soil pest damage. Unless a field has a known history of wireworms or white grubs, we do not recommend using at-planting insecticides.
Acknowledgements and Funding. This project was funded in both years by the Maryland Grain Producers Utilization Board. We appreciate the help provided by Rachel Sanford, Madison Tewey, Eric Crandell, Gabriel Aborisade, and Kevin Conover.
Sources
Langdon, K. W., Colee, J. & Abney, M. R. Observing the effect of soil-applied insecticides on wireworm (coleoptera: Elateridae) behavior and mortality using radiographic imaging. J. Econ. Entomol.111, 1724–1731 (2018).
Afful, E., Illahi, N. & Hamby, K. Agronomy News. 10, 2–4 (2019).
Reisig, D. & Goldsworthy, E. Efficacy of Insecticidal Seed Treatments and Bifenthrin In-Furrow for Annual White Grub, 2016. Arthropod Manag. Tests43, 1–2 (2017).
Koch, R. L., Rich, W. A., Potter, B. D. & Hammond, R. B. Effects on soybean of prophylactic in-furrow application of insecticide and fertilizer in Minnesota and Ohio. Plant Heal. Prog.17, 59–63 (2016).
Douglas, M. R. & Tooker, J. F. Meta-analysis reveals that seed-applied neonicotinoids and pyrethroids have similar negative effects on abundance of arthropod natural enemies. PeerJ 1–26 (2016). doi:10.7717/peerj.2776
Funayama, K. Influence of pest control pressure on occurrence of ground beetles (Coleoptera: Carabidae) in apple orchards. Appl. Entomol. Zool.46, 103–110 (2011).
This breakfast meeting will include speakers on various topics in grain marketing. Come have breakfast and discuss this year’s strategies for marketing your grain. Speakers include marketing specialists, traders and more. Topics include local and national grain outlook for 2020, tax considerations, crop insurance and the farm bill.
Locations
In person:
Chesapeake College, Wye Mills, MD Higher Education Center HES-110. Contact Shannon Dill, sdill@umd.edu or call 410-822-1244.
Broadcast to:
Charles County Extension, 9501 Crain Hwy, Bel Alton, MD 20611. Contact Alan Leslie, aleslie@umd.edu or call (301) 934-5403
Harford County Extension, 3525 Conowingo Rd., Suite 600, Street, MD 21154. Contact Andy Kness, akness@umd.edu or call (410) 638-3255
Somerset County Extension Office, 30730 Park Dr, Princess Anne, MD 21853. Contact: Sarah Hirsh, shirsh@umd.edu or call (410) 651-1350
Jarrod Miller, Extension Agronomist & Amy Shober, Professor & Nutrient Management Extension Specialist University of Delaware
Micronutrient deficiencies are commonly exhibited in agronomic crops grown on Delaware’s sandy, low organic matter soils. In 2018, University of Delaware researchers conducted a study at the Carvel Research and Education Center (Georgetown, DE) to examine corn response to manganese (Mn), zinc (Zn), and boron (B) in starter fertilizer. Two rates of Mn (0.25 and 0.5 lb/ac), Zn (0.5 and 1.0 lb/ac), and B (0.15 and 0.30 lb/ac) were applied as a liquid starter with the planter.
The goal of this project was to increase yields with additional starter applications of Mn, Zn, or B, which did not occur. However, based on the soil test UD recommendations, no additional micronutrients were called for (Shober et al., 2019). Fields deficient in Mn, Zn, or B (based on UD recommendations) would still benefit from their addition as a starter band or foliar application.
Although starter applications of B did not produce a yield effect, tissue concentrations of B increased with yield. Predicting B availability is difficult, as it is more prone to leaching than other micronutrients. With lower tissue B concentrations related to stand counts, there is potential evidence that B leached below the root zone in saturated soils. It is possible that B would benefit from split applications, similar to N management.
The application of B increased Mn content in ear leaf tissue, but not yields. Across all treatments there was a positive relationship between B and Mn uptake. The relationship between these two nutrients in should be investigated further.
Andrew Kness, Agriculture Extension Agent | University of Maryland Extension, Harford County Dr. Nicole Fiorellino, Extension Agronomist | University of Maryland, College Park
Each year, the University of Maryland, and other land-grant universities across the US, conduct agricultural variety trials that provide farmers and other professionals in the industry with valuable data on crop performance. These data provide critical information regarding varietal differences, such as yield, plant characteristics, disease resistance, and geographic performance, which aid producers in making the best decisions on variety selection for their farms.
Reports from University variety trials are generated yearly, and can be quite lengthy and may contain values, metrics, and other information that require explanation. If you are going to utilize variety trial data to make on-farm decisions, it is important to understand how to read and interpret the data so that you are able to draw the correct conclusions. For example, it is easy to simply search the tables for the top-yielding variety and dismiss the rest of the information. This article will explain how and why variety trials are set-up the way they are, walk you through what the data mean, and how to interpret the statistics and make sound conclusions based on those statistics.
The primary objective of a variety trial field study is to test the performance of crop hybrids relative to each other and relative to check varieties embedded in the study. To do this, the trials are designed in such a way as to eliminate as much variability as possible to strengthen our ability to detect a difference in hybrid performance. As with anything in agriculture, there is a lot of variability associated with conducting research in the field. Variations in weather, soil types, and pest pressure are just a few of the factors that introduce variability in our research. In order to help control for this variability, variety trials are designed as small plots (often 10 feet wide x 30 feet long) and placed in a field with consistent soil types – again, to minimize variability. All the plots are treated exactly the same in respect to planting date, planting depth, harvest date, data collection, pest management, and fertility; the only variable we allow to be different is variety. In addition, each variety is replicated multiple times within one field, usually 3-5 times at random locations within one field. This randomized replicated plot design helps to minimize the effects of the spatial variability that we do not have control over (such as weather, soil type, and pest pressure). Figure 1 depicts a randomized plot design that contains four varieties replicated four times.
Figure 1. Example field plot design with four varieties replicated four times in a randomized block plot design.
The data that are collected from these plots are then used to compare each variety to the others in the trial using statistical methods, which is typically an analysis of variance (ANOVA). An ANOVA test compares each treatment (or variety in this example) with each other, taking into account the variation in the data. Figure 2 on the next page is a table from the 2019 University of Maryland Corn Variety Trials for mid-season maturity corn hybrids at Keedysville, MD. There is one number listed for yield for each variety, but this number is actually an average of the yield for the three plots, or replicates, of each variety that were planted and harvested. For example, yield for LG62C02VTRIB, reported as 223 bushels per acre, is the average of 226, 231, and 212 bushels per acre, collected for each of the three plots planted at this location. Since the yields were not identical for each of the plots, there is variation about the average yield. The ANOVA test compares the variation in average yield for each variety to determine if the numerical difference in average yield is due to differences in variety performance or due to random chance. The ANOVA test takes into account a confidence interval, which we define prior to the study. In the scientific field of agricultural research, it is generally acceptable to define your confidence interval between 90-95%. This means that we are 90-95% confident that the differences observed between varieties is due to the variety performance and not some other factor (such as weather, soil type, etc.). This confidence means it is likely this difference in variety performance would likely be observed if the comparison was repeated under similar conditions.
With the basic concept in mind, return back to Figure 2. One might think that hybrid DKC61-41RIB out-yielded NK 1205-3120 by 6.4 bushels per acre. It is true that it did; however, we plan to utilize this data to make predictions going forward; in other words, will DKC61-41RIB consistently out-yield NK 1205-3120, or is the 6.4 bushel difference we observed in yield due to random effects? This is where we need to use statistics to answer these questions.
The bottom four rows of the table in Figure 2 are where you will find the statistics to make inferences about the trial dataset. Trial mean is simply the average of all varieties in the trial, which is an indicator of how the trial performed as a whole and is used to calculate the relative yield. The next two rows, Probability > F and LSD0.1, are generated from an ANOVA test and are critical to interpreting the data correctly.
Probability > F (indicated as P > F in other reports) indicates the likelihood that what we observe in variation between varieties is due to random effects and not some other variable (in this case, variety). This value can be between 0 and 1. If this value is large, then it means that the differences we observe are due to random effect and not hybrid performance; therefore there are no yield differences between varieties. However, if the value is small, then there are differences between varieties that are not explained by random variation.
In this example for yield, Probability of > F is 0.0805, or 8.05%. As mentioned previously, for field research, confidence intervals are often set at 90-95%; which equates to a probability level of between 0.1 and 0.05 (defined as an “alpha level” in statistics). In this trial, the alpha level was defined as 0.1, as indicated by the subscript 0.1 after LSD. If the Probability > F is less than 0.1, we can conclude with at least 90% confidence that there is a difference in yield due to variety. If the value of P > F is greater than 0.1, then we conclude there were no yield differences between varieties. In this example, there are significant differences in yield, moisture, and test weight due to variety. We cannot conclude there is a difference in lodging or plant population as a result of variety. This means that statistically there is no difference in DKC59-82RIB with a lodging score of 1.4%, and P1197 AM, with a lodging score of 0%.
The next row in the table, LSD0.1, tells us the “least significant difference,” or the threshold that must be overcome to conclude that the performance of two varieties are significantly different. If the ANOVA test returns a P value that is greater than the defined alpha level (0.1 for our example), then there will be no significant differences between treatments, and LSD is denoted NS (not significant). If the test returns a P value less than the alpha level, then the LSD value will tell us what is considered a significant difference between treatments. For yield in the example above, there needs to be a difference of 12.4 bushels before we can say with 90% confidence that the difference in yield between any two hybrids is due to the variety and not random chance. The top yielding variety in this trial was DKC59-82RIB (highlighted). This variety yielded significantly more than all other varieties, except for SCS 1105AM. You will notice that the difference in yield between these two hybrids (8.4 bushels) does not exceed the cutoff defined by the LSD; therefore, they are not significantly different than each other. If there is a difference of at least 12.4 bushels between any two varieties in the trial, then we can conclude that there is a difference in yield that was caused by variety. In the example, the lowest yielding variety (LCX10-98 VIP3110) did not yield significantly less than any other variety except for the top two (DKC59-82RIB and SCS 1105AM).
The final statistic is the coefficient of variation (CV%). This is a measure of the variation in the data; the smaller the number, the less variability. Values for CV under 10% for yield tell us there was not too much variability in yield and that we are able to distinguish variety differences. The more variation in the dataset will require a larger LSD to separate differences between treatments.
Variety trials presented with statistical analyses provides a way for us to compare varieties as best we can in a real-world setting through replicated plots. When using variety trial data, it is best to choose varieties with yield stability and desirable characteristics across multiple locations and across multiple years, whenever possible. You will also find very similar statistical methods in not only variety trial reports, but for any type of replicated field research. These statistical analyses provide you with assurance that the conclusions drawn are due to treatments research and you could expect similar results if the comparison was repeated under similar conditions. If you encounter data or reports that do not have any type of statistical analysis presented, it is important to realize that you should not draw any conclusions from that dataset.