Reports are for crop conditions up to November 16, 2023.
Western Maryland
Harvest is winding down. Nearly all of the corn and full-season beans are in the bins. Some of the double-crop beans weren’t even worth the cost of the fuel to harvest them. Cover crops are looking good as is the commodity wheat and barely. There are still a few acres that will get some rye. Manure is flying as we race to beat the December 15 deadline. Hay stocks are short but FSA has had the county designated a disaster area so there is some assistance available to make up for the shortfalls. Yields are all over the place depending on when the crop was planted and when the showers arrived. As always everyone is looking forward to 2024 being a better year.—Jeff Semler, Washington Co.
Central Maryland
No Report.
Northern Maryland
2023 harvest has been about as smooth as anyone could ask for with very few weather interruptions. All but a few acres of corn and double-crop soybeans remain. Some rains here and there have been just enough to get cover crops and small grains off to a good start, especially those fields planted early, which have put on substantial growth and tillers. Corn yields have been very strong across most of the region and even record-setting on some farms. Soybeans on the other hand are average to below average in many fields and double-crop beans range from very poor to good. All things considered, yields (especially corn) were impressive considering how dry we started and finished the season; timely rains sure do make or break yields!—Andy Kness, Harford Co.
Upper and Mid Shore
Both corn and soybean harvest is finishing up. The high yields across the region have made grain delivery the last fewPreview (opens in a new tab) weeks a little frustrating. Tanks and piles are full. Granaries have been working to move grain out, but purchasing grain with reduced hours. On a positive note, that seems to be resolved now. The weather has cooperated to make harvest as easy and stress free as possible. We are finally receiving some rain to replenish ground water. Small grains are off to a good start.—Jim Lewis, Caroline Co.
Lower Shore
Corn harvest is 95% complete. Most full season soybean has been harvested. It has been very dry in the region, and soybean moisture is below 13%. Soybeans are dusty and farmers are blowing off combines due to fire hazard. Soybean yields are coming in average to slightly above average depending on how much rain fields received. Double crop soybean following wheat is still a few weeks from being harvested. Wheat planting is underway and farmers are planting into dry fields. In many fields, cover crops are already seeing substantial growth and some farmers continue to drill winter cereal cover crops following soybean harvest.—Sarah Hirsh, Somerset Co.
Southern Maryland
Wrap-up: The last acres of soybeans and corn are making their way off fields as we wind into the last chapters of 2023 season. The season started early, with ideal planting conditions in early April. Many growers planted beans and corn during that early window. Conditions turned dry and cooler through the latter part of April and into May and June. Growers struggled with annual ryegrass burndown control. Rains returned as we turned the page into summer and crops responded well. Concerns over the wheat and barley crop, which appeared uneven through he late spring, were unfounded. The small grain crop was of great quality and yield. Growers struggled during the later harvest period as rains delayed harvest well into July. Most corn made it through the pollination window with adequate moisture. Dry conditions returned once again in August and September, resulting in drought stress to beans and corn. Corn harvest started a little earlier than normal. Overall yield reports are above average, and something to be grateful for given the dry conditions later in the season. Beans were more of a mixed bag. Early planted beans performed well for the second year in a row, with most of the crop made by the time the rain ran out. Double crops beans ranged from very poor to very good depending on rain timing and stage of beans. The fall harvest season has been good. Wheat and barley has germinated well and is growing fast with warmer than normal fall temperatures.—Ben Beale, St. Mary’s Co.
Andrew Kness, Senior Agriculture Agent | akness@umd.edu University of Maryland Extension, Harford County
Summary
Tar spot is a new foliar fungal disease of corn first discovered in the United States in 2015 and confirmed in Maryland in 2022 and was estimated to be the most significant yield-limiting disease of corn in the US in 2021 and 2022. As a new disease for our state, this project collected preliminary data on the distribution of tar spot in our state and compared the efficacy of different fungicide application timings. Through field surveys we identified and confirmed tar spot in eight Maryland Counties at a frequency of approximately 47% and at a relatively low severity rate (not exceeding 30%). These observations suggest that the tar spot pathogen can overwinter in Maryland, as it has expanded its range from two counties in 2022 to at least eight in 2023. Field evaluations of two fungicide programs: one pass program at VT and a two-pass program at VT followed by R2, we observed a significant difference in tar spot severity and plant lodging compared to the control; however, there was no difference in yield. Additional research on fungicide timing and the spread of this disease should be conducted in the future to help develop improved management recommendations.
Survey of Tar Spot Distribution in Maryland
Several fields were scouted for tar spot starting during late vegetative growth stages and frequency and intensity of scouting was increased from tassel through harvest. Initial scouting was focused in fields in Harford County near fields where tar spot was confirmed in 2022. In addition, reports were solicited from other Extension Agents and crop consultants/scouts throughout the state. Suspected positive samples were confirmed by laboratory technique and all positive samples were uploaded to the tar spot tracker map on corn.ipmpipe.org.
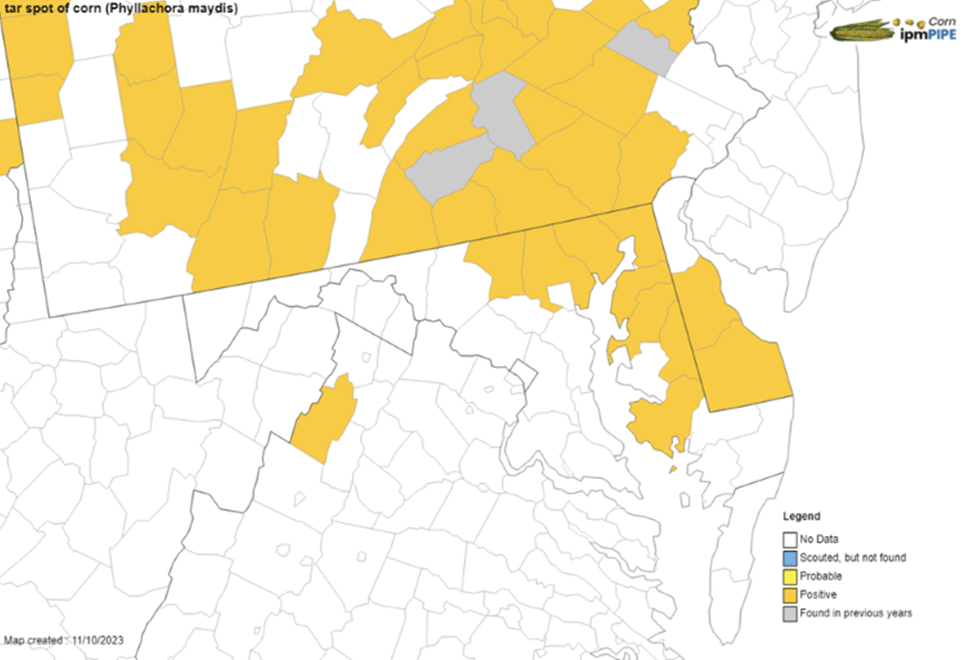
The first reported and confirmed incidence of tar spot in Maryland for 2023 came from a corn field in Cecil County on August 22. The second came from Carroll County on August 31, followed by Harford County on September 3. We confirmed tar spot in the additional counties of Kent and Queen Anne’s on September 19; Baltimore County on September 22; Caroline County on September 25, and Dorchester County on October 6 (Figure 1).
Figure 1. Map showing confirmed distribution of tar spot for the 2023 growing season (yellow). Map from corn.ipmpipe.org.
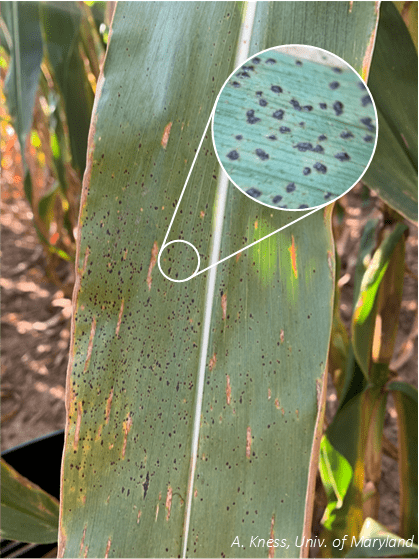
Several fields were scouted in Northern Harford County throughout the year surrounding fields where tar spot was confirmed in 2022. By the end of the season, tar spot was found in over 50% of these fields (9/16) at levels ranging from 2% to 25% severity (Figure 2). It was observed that tar spot severity continued to increase after black layer for as long as there was green, living tissue remaining on the plants. This increase in severity after physiological maturity does not affect yield but does make for a notably increased level of severity present at harvest and thus the potential for an increase in overwintering spores that will provide inoculum for the following year.
Figure 2. Corn leaf with approximately 10% tar spot severity. Tar spot symptoms include raised, black specks on the leaves.
An additional survey of 12 fields on Maryland’s Eastern Shore from Cecil to Queen Anne’s County was conducted on September 19. During this time, two fields were confirmed with tar spot. Severity was very low (<2%) in the field in Queen Anne’s County, and high in the field in Kent County (30%).
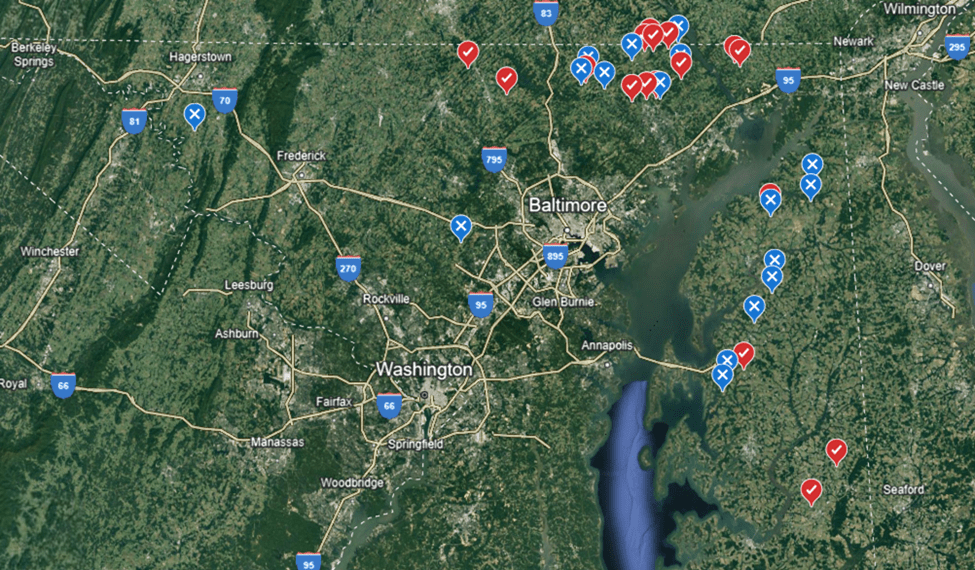
Altogether, tar spot was confirmed in 16 out of 34 fields (47%) scouted/reported throughout the state (Figure 3), with samples coming from as far west as Washington County (no confirmed samples) east to Cecil County (two confirmed samples) and south on the Maryland Eastern Shore as far as Dorchester County (one sample confirmed).
Figure 3. Google Earth map of fields scouted (blue markers) and confirmed (red markers) presence of tar spot. Markers are approximate locations and not precise to protect the identity of the landowner and/or farmer.
Weather conditions were favorable for tar spot on the Eastern Shore and Northern Maryland; however, severe drought conditions from Frederick County west may have prevented its widespread establishment in Western Maryland.
Based on this survey, tar spot appears to be established in all the northern counties east of Frederick and south on the Eastern shore to at least Dorchester County, at a frequency of approximately 40-50%. Judging by the confirmed occurrences in other counties in different states, it is likely that tar spot is present in more Maryland Counties than determined by this survey.
On-Farm Fungicide Trials
Fungicides are an effective management tool for foliar diseases of corn, including tar spot. Research from the Midwest has shown a positive response to fungicide applications in fields where tar spot disease severity is high. However, there is debate as to if one fungicide application made around VT is sufficient to control tar spot, as yield losses have been reported as late as R4. In 2023 we established an on-farm trial to evaluate the response to a single fungicide application compared to a two-pass program for managing tar spot in corn.
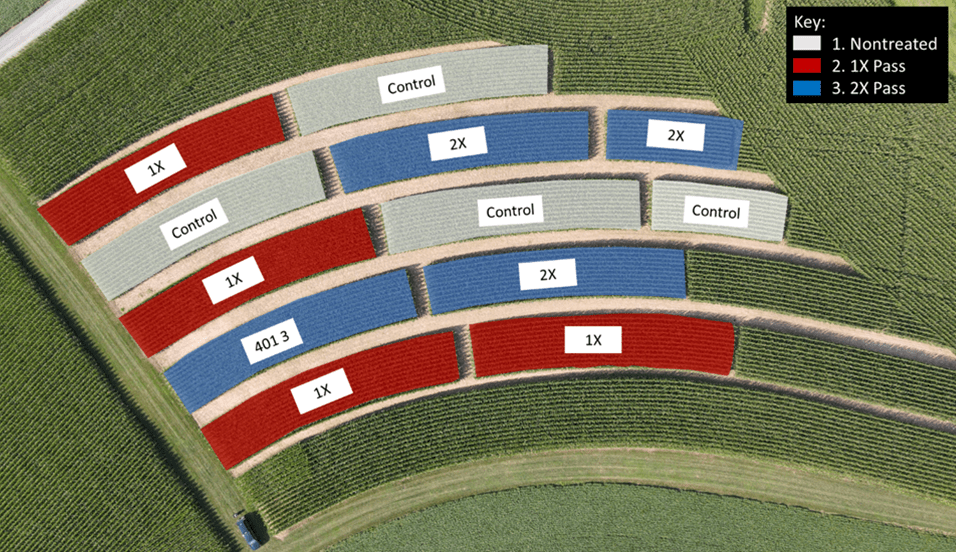
Field plots were established at a farm in Harford County, MD in a field immediately adjacent to where tar spot was found in 2022. Corn (Revere Seed ‘1307 TCRIB’) was no-till planted into soybean residue with a John Deere 1775 NT ExactEmerge™, 30-inch, 16 row planter at the rate of 35,000 seeds/acre. Rows 1, 2, 15, and 16 on the planter were shut off to create alleys between adjacent plots and to eliminate treatment overlap, as well as to ensure harvest accuracy. This resulted in 12-row plots that were between 75 and 150 feet long. Plots were arranged in the field in a randomized block with three treatments and five replicates (Figure 4).
Figure 4. Tar spot fungicide timing research plot layout.
Fungicides (Table 1) were applied at the VT and R2 growth stages using a DJI T30 drone calibrated to deliver 2.8 gallons per acre spray volume to the entire length of the 12-row plots. VT applications were made on July 12 and R2 applications were made on August 5. Trivapro 2.1 SE was used for all applications. Trivapro was selected because previous research has demonstrated that multi-mode-of-action products have the best efficacy against tar spot.
Table 1. 2023 Fungicide Treatments.
Treatment
Product Name
Active Ingredient(s)
Application Rate (& Timing)
Nontreated Control
N/A
N/A
1X Pass
Trivapro 2.1 SE
Benzovindiflupyr + Azoxystrobin + Propiconazole
13.7 fl oz/A (VT)
2X Pass
Trivapro 2.1 SE
Benzovindiflupyr + Azoxystrobin + Propiconazole
13.7 fl oz/A (VT) & 13.7 fl oz/A (R2)
Foliar diseases were rated prior to fungicide application and approximately every two to three weeks following until harvest. Disease severity from tar spot was visually rated as the percent leaf area infected in the canopy from 10 random plants from the center two rows of each plot.
Lodging scores were collected at harvest by conducting a “push test” on 10 plants from the center two rows of each plot. The push test consists of pushing a corn plant approximately 30 degrees from vertical; plants that break have compromised stalk strength and were considered lodged.
Yield data were collected by harvesting 12 rows of each plot using a John Deere S780 combine on October 13, 2023. Yield data was exported from the combine monitor and RTK was used to correlate yield with plot locations since we were not able to collect individual plot weights. All yields reported are adjusted to 15.5% moisture. All data were analyzed using ANOVA and significant differences between treatments were separated using Fisher’s Least Significant Difference (LSD; α=0.10).
On-Farm Trial Results
Tar spot was first observed in the plots on August 29 present at a very low level (less than 2% severity). Overall tar spot disease severity was low throughout the season in these plots. One possible explanation for this is the early planting date, which likely allowed the corn to complete its critical reproductive growth stages before weather conditions were favorable for tar spot development.
Early disease ratings revealed a significant difference in tar spot severity (p=0.0176) in treated plots vs nontreated plots (Table 2). However, late disease ratings collected at harvest show an overall increase in tar spot severity, but no difference between treated and nontreated plots. This is likely due to the fact that fungicides can only offer around 14-21 days of protection. In this trial, the second fungicide application did not provide improved tar spot control compared to the single pass treatment; however, the single fungicide application at VT delayed tar spot infection compared to the nontreated control.
Table 2. 2023 Tar Spot Disease Rating and Harvest Data.
Treatment
Tar Spot Severity (%)
Lodged Plants (%)
Grain Yield (bu/acre)
Grain Moisture (%)
9/11/23
10/12/23
Control
3.05 a*
3.75
10.0 a
192.56
19.06
1X Pass
1.18 b
2.88
5.0 a
199.05
19.41
2X Pass
0.85 b
4.00
0.0 b
201.56
20.31
p-value
0.0176
0.4133
0.0680
0.2123
0.4343
*Treatments connected by the same letter are not significantly different from each other (α=0.10).
The control plots averaged 192.56 bu/acre with a low of 169.7 and high of 214.6; the single pass (1X pass) program yielded an average of 199.05 bu/acre with a low of 177.5 and high of 228.6 bu/acre; and the two-pass (2X pass) fungicide treatment yielded an average of 201.56 bu/acre with a low and high of 194.4 and 222.7 bu/acre, respectively. However, there are no statistically significant differences in yield between treatments (p=0.2123). Likewise, there was also no significant difference in grain moisture. Tar spot disease severity was relatively low; likely too low to impact yield in this trial, leading to no yield response.
The 2X pass fungicide program did improve standability of the crop at harvest, with 0.0% lodging, significantly better than the 1X program (5.0%) and the control (10.0%).
This work was supported by funding through the Maryland Grain Producer’s Utilization Board and in-kind support from The Mill. Special thanks to Clear Meadow Farm for their use of land and equipment making this research possible.
Maria Cramer, PhD Candidate and Kelly Hamby, Entomology Extension Specialist Department of Entomology, University of Maryland
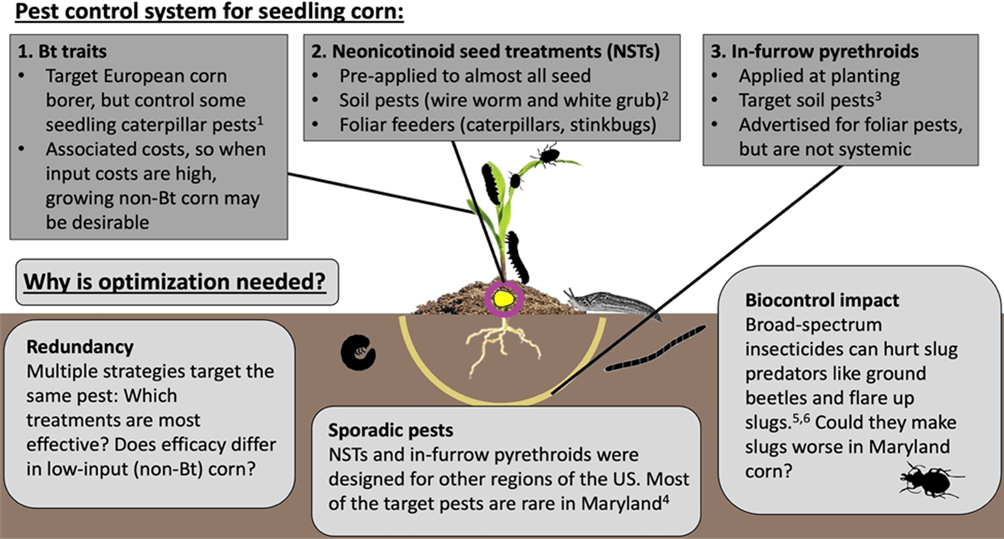
Background
Research Questions
Are the NST Poncho 250® and the in-furrow pyrethroid Capture LFR® effective at controlling pests and increasing yield in high-input (Bt) or low-input (non-Bt) field corn in Maryland?
Do Poncho and Capture hurt slug predators and flare up slug damage?
Study Design
In order to capture the range of pest pressures and growing conditions in Maryland, we replicated our study across 3 UMD research farms (Keedysville, Beltsville, and Queenstown) and over 3 years (2020-2022). At each location we planted one field of a Bt hybrid and one field of a similarly-yielding non-Bt hybrid as early as possible in the growing season (Table 1). In 2020 our Bt hybrid was LC1196 VT2P (Local Seed, Memphis, TN) which expresses Cry1A.105/Cry2Ab2 proteins. In 2021 and 2022 we planted P1197YHR (Pioneer Hi-bred International. Johnston, IA) which contains Cry1Ab and Cry1F proteins. We planted P1197LR (Pioneer Hi-bred International, Inc. Johnston, IA) for our non-Bt hybrid all three years. All hybrids had excellent yield potential and were grown with standard no-till practices. In each field we established 3 replicates of 3 treatments at planting: 1) an untreated control, with bare seed and no in-furrow product, 2) an in-furrow pyrethroid treatment using Capture LFR® (active ingredient: bifenthrin, rate: 13.6 fl oz/acre), and 3) an NST treatment using Poncho® (active ingredient: clothianidin, rate: 0.25 mg/seed). Each replicate consisted of 24 rows of corn at 30 inch row spacing, and was 200 feet long.
Year
Location
Planting date
Sampling dates
2020
Keedysville
May 18
June 8
Beltsville
May 21
June 10
Queenstown
May 13
June 3 and 4
2021
Keedysville
May 14
June 1 and 3
Beltsville
May 17
June 2
Queenstown
May 4
May 25 and 26
2022
Keedysville
May 26
June 10
Beltsville
June 2
June 21
Queenstown
May 12
May 31
Question 1: Are the NST Poncho 250® and the in-furrow pyrethroid Capture LFR® effective at controlling pests and increasing yield in high-input (Bt) or low-input (non-Bt) field corn in Maryland?
Data Collection
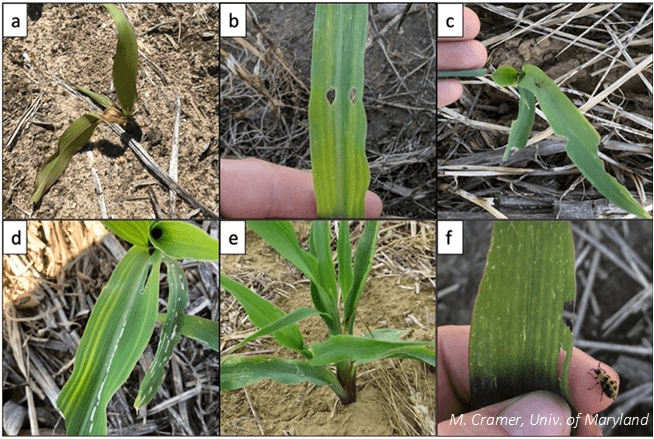
In order to evaluate how the treatments affected pest pressure, we visually sampled V2-V3 corn for types of pest damage (Figure 1), recording the number of plants and area damaged. We counted the number of healthy and stunted plants to determine if the treatments impacted stand. Because neonicotinoids can sometimes stimulate plant growth unrelated to pest damage7,8, we measured plant height to determine if plant growth was impacted by either treatment. At the end of the growing season, we measured stand again and harvested the corn to collect yield data.
Figure 1. Diagnostic seedling pest damage: a) soil pest, b) cutworm, c) armyworm, d) slug, e) stinkbug, f) miscellaneous feeding damage from a spotted cucumber beetle.
Results and Takeaways for Question 1
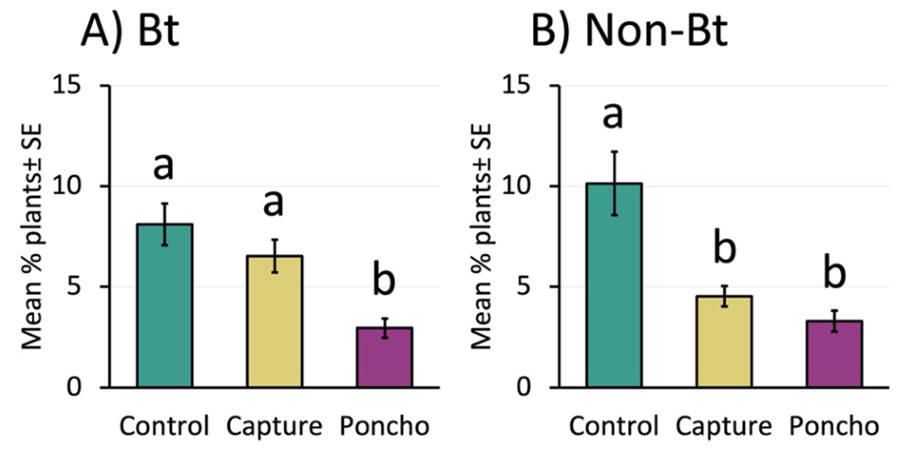
Poncho reduced insect damage more consistently than Capture LFR (in both Bt and non-Bt corn) and increased Bt corn stand. Capture LFR sometimes reduced insect damage (in non-Bt corn), but never improved stand.
We compared the number of seedlings with any type of pest damage between treatments and found that Poncho decreased damage about 62% in Bt corn and about 66% in non-Bt corn (Figure 2a and 2b). Compared to the control, Capture did not reduce damage in the Bt corn, but did reduce damage by about half in the non-Bt. Poncho increased stand about 8% compared to control in the Bt corn (25,731 ± 456 plants per acre and 23,623 ± 714 plants per acre, respectively), but did not improve it for non-Bt. Capture did not impact stand for either Bt or non-Bt corn.
Figure 2. Mean % ± SE of seedling A) Bt and B) non-Bt corn plants damaged by pests. Data were collected across three UMD research farms from 2020-2022. Within each graph, treatment bars with different letter above them are significantly different from each other.
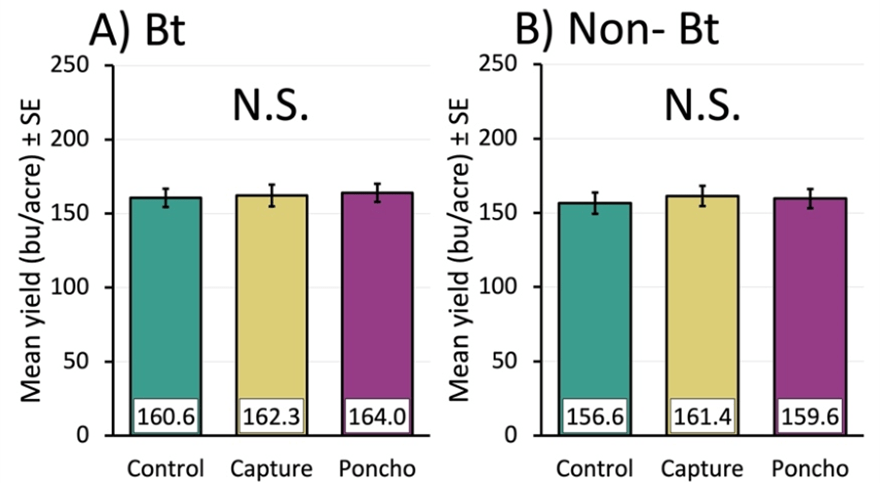
There were no yield benefits from using either insecticide in either corn. This was likely due to a lack of economic pest pressure.
Non-Bt and Bt yields were the same across treatments (Figure 3A and 3B). This was probably because pest pressure was so low. Even though Poncho and Capture decreased pest damage, pests were below treatment thresholds—for example, armyworm damage in the control ranged from 0% to 5.4% of Bt plants, and 0% to 22.9% of non-Bt plants, in both cases below the treatment threshold of 35%9. Cutworm damage was similarly low ranging from 1% to 6.3% in Bt control and 0.5% to 3.8% in non-Bt control, also below the treatment threshold of 10% feeding damage9.
Figure 3. Mean yield ± standard error in bushels per acre corrected to 15.5% moisture of A) Bt corn and B) non-Bt corn. Yield data from 2020-2022 across three UMD research farms. Treatments did not significantly impact yield.
Takeaway: Pest pressure and yield were similar between the Bt and non-Bt varieties, and non-Bt yielded well without any insecticides. In general, without pre-existing pest problems in a given field, at-planting insecticides are unlikely to pay off in Maryland.
Question 2: Do Poncho and Capture hurt slug predators and flare up slug damage?
Data Collection
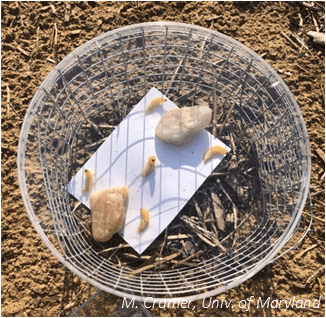
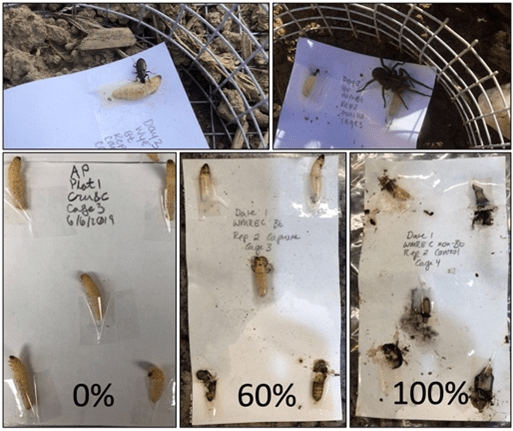
To assess the effect of treatments on slug biocontrol agents, we measured slug predatory ground beetles and predation. We measured predatory beetles with pitfall traps for three consecutive weeks. Because the predators that eat slugs also attack caterpillars, we used sentinel caterpillars to see how much predation was occurring (Figure 4). We placed sentinel caterpillars in the plots overnight, collected them the following morning, and assessed signs of damage from predators. To determine if slugs were flared up by the treatments, we measured slug abundance once a week for 6 weeks beginning between 14 to 21 days after planting and measured slug-damaged seedlings during V2-V3.
Figure 4. Sentinel caterpillars placed in field overnight and collected in the morning to determine predator activity.
Results and Takeaways for Question 2
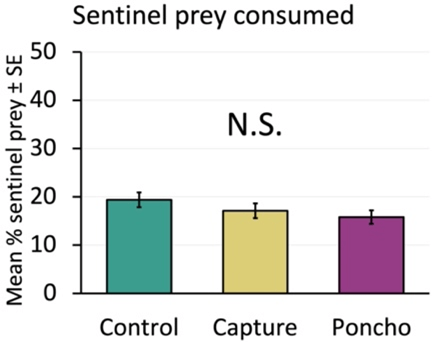
Predation on sentinel caterpillars was not decreased by insecticides.
We measured the percent of sentinel prey that were damaged by predators overnight (Figure 5) and saw no relationship between treatment and predation rates (Figure 6). This suggests that the insecticides did not decrease predator activity in treated plots. We did generally see some level of predation all weeks at our locations, indicating that predators are usually present in seedling corn.
Figure 5. Top: predators feeding on sentinel prey. Bottom: examples of damaged prey proportions. Images: M. Cramer, University of Maryland.Figure 6. Mean ± SE % sentinel prey caterpillars consumed across three UMD research farms from 2020-2022. Control, Capture, and Poncho did not significantly differ.
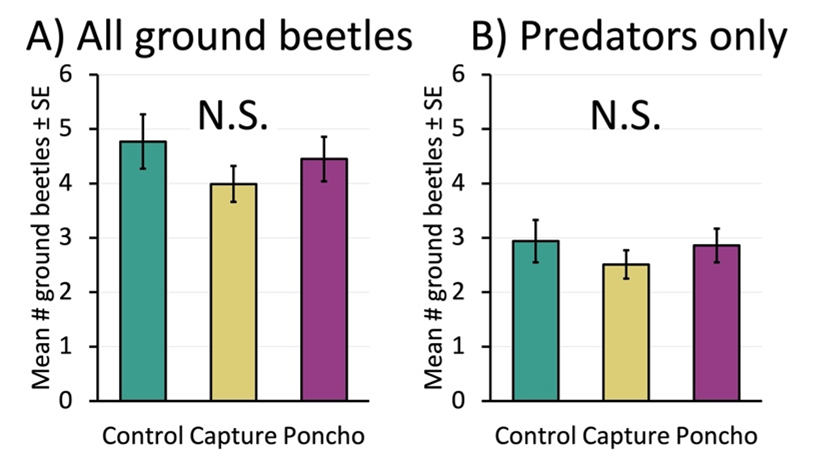
Predator abundance was not altered by insecticides.
When we measured the weekly counts of ground beetles, we found similar results between treatments. This was true when we looked at all ground beetles (predators, omnivores, and seed-eaters), as well as when we looked only at predatory beetles (Figure 7A and 7B).
Figure 7. Mean ± SE count of A) all ground beetles, and B) specifically predatory ground beetles, caught per week in pitfall traps across three UMD research farms from 2020-2022. No significant differences.
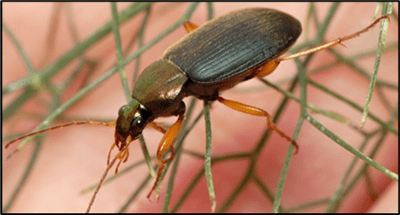
Slug natural enemies did occur throughout the study, suggesting that biocontrol could be more intentionally leveraged.
The two most abundant ground beetle species in our study were both predators. One of these species, Chlaenius tricolor (Figure 8) is a slug predator that consumes slugs in agricultural ecosystems5,10. Although its abundance was not affected by treatments, it was present at all locations in all years, suggesting that it is a particularly important slug natural enemy in Maryland crops.
Neither insecticide increased slug abundance or slug damage.
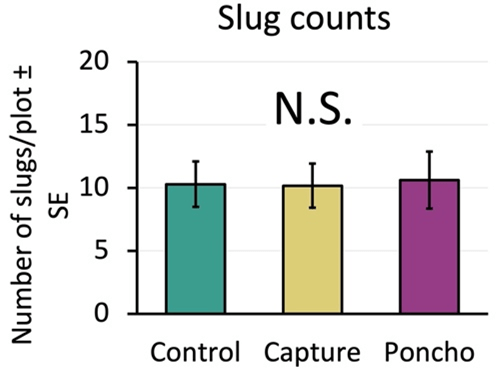
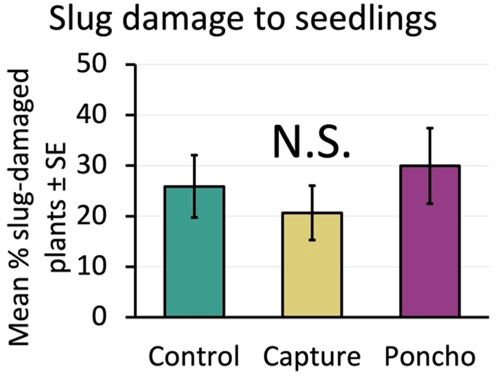
If treatments had negatively affected predators, we would expect to see more slugs and damage in the insecticide plots. However, when we compared slug counts between treatments, we found that the insecticide treatments were not different from the control (Figure 9). Slug damage to the seedling corn was also similar across the control and insecticide treatments (Figure 10).
Figure 9. Mean number of slugs per replicate plot ± SE the week closest to seedling sampling across three UMD research farms from 2020-2022. No significant differences.Figure 10. Mean ± SE % of corn seedlings damaged by slugs across three UMD research farms from 2020-2022. Control. No significant differences.
While slugs can be damaging in many crops, the worst slug damage in our study did not affect corn stand or yield, suggesting that corn is generally tolerant of slug damage at the levels we observed in this study.
Slug damage was scarce across years and locations except in 2021 at Keedysville. Even in that case where a high proportion of seedlings (42% ± 4% on average) were damaged by slugs, we did not see an associated decrease in stand or yield. Corn seedlings were able to outgrow the slug damage as the weather warmed, even when they appeared severely defoliated. The seedling resilience we observed is supported by work on hail damage in corn which shows that as long as the growing point is intact, corn can regrow from complete defoliation11.
Even though we did not see non-target effects in this study, both pyrethroids and neonicotinoids can decrease natural enemies in crop fields6,12–14.
Acknowledgments
We would like to thank the farm managers and staff of WYEREC, WMREC, and CMREC Beltsville for their expertise and assistance. We would also like to thank the Hamby lab’s many undergraduate researchers for helping complete this project with all their hard work.
Sources:
Kullik, S. A., Sears, M. K. & Schaafsma, A. W. Sublethal Effects of Cry 1F Bt Corn and Clothianidin on Black Cutworm (Lepidoptera: Noctuidae) Larval Development. J. Econ. Entomol.104, 484–493 (2011).
North, J. H. et al. Value of neonicotinoid insecticide seed treatments in mid-south corn (Zea mays) production systems. J. Econ. Entomol.111, 187–192 (2018).
Reisig, D. & Goldsworthy, E. Efficacy of Insecticidal Seed Treatments and Bifenthrin In-Furrow for Annual White Grub, 2016. Arthropod Manag. Tests43, 1–2 (2017).
Sappington, T. W., Hesler, L. S., Clint Allen, K., Luttrell, R. G. & Papiernik, S. K. Prevalence of sporadic insect pests of seedling corn and factors affecting risk of infestation. J. Integr. Pest Manag.9, (2018).
Douglas, M. R., Rohr, J. R. & Tooker, J. F. Neonicotinoid insecticide travels through a soil food chain, disrupting biological control of non-target pests and decreasing soya bean yield. J. Appl. Ecol.52, 250–260 (2015).
Dubey, A., Lewis, M. T., Dively, G. P. & Hamby, K. A. Ecological impacts of pesticide seed treatments on arthropod communities in a grain crop rotation. J. Appl. Ecol.57, 936–951 (2020).
Ding, J. et al. Thiamethoxam, clothianidin, and imidacloprid seed treatments effectively control thrips on corn under field conditions. J. Insect Sci.18, (2018).
Preetha, G. & Stanley, J. Influence of neonicotinoid insecticides on the plant growth attributes of cotton and okra. J. Plant Nutr.35, 1234–1245 (2012).
Flessner, M. & Taylor, S. V. 2021 Field Crops Pest Management Guide. Virginia Cooperative Extension (2021) doi:10.1016/B978-0-12-394807-6.00031-9.
Eskelson, M. J., Chapman, E. G., Archbold, D. D., Obrycki, J. J. & Harwood, J. D. Molecular identification of predation by carabid beetles on exotic and native slugs in a strawberry agroecosystem. Biol. Control56, 245–253 (2011).
Thomason, W. & Battaglia, M. Early defoliation effects on corn plant stands and grain yield. Agron. J. 5024–5032 (2020) doi:10.1002/agj2.20402.
Disque, H. H., Hamby, K. A., Dubey, A., Taylor, C. & Dively, G. P. Effects of clothianidin-treated seed on the arthropod community in a mid-Atlantic no-till corn agroecosystem. Pest Manag. Sci.75, 969–978 (2019).
Bhatti, M. A. et al. Field Evaluation of the Impact of Corn Rootworm (Coleoptera: Chrysomelidae)–Protected <I>Bt</I> Corn on Foliage-Dwelling Arthropods. Environ. Entomol.34, 1336–1345 (2006).
Taravati, S., Mannion, C., McKenzie, C. & Osborne, L. Lethal and Sublethal Effects of Selected Systemic and Contact Insecticides on Nephaspis oculata (Coleoptera: Coccinellidae), in a Tri-Trophic System. J. Econ. Entomol.112, 543–548 (2018).
Nicole Fiorellino, Extension Agronomist | nfiorell@umd.edu University of Maryland, College Park
Please find attached a copy of the 2023 Corn Hybrid Trials results performed annually at multiple UMD Research and Education Centers. The factsheet can also be downloaded from the MD Crops website at https://psla.umd.edu/extension/md-crops. Many thanks to Louis Thorne and Joe Crank for their leadership and management of the trials, from seed organization, to planting, to harvest. These trials could not be completed without them.
We are grateful for the funding provided by Maryland Grain Producers Utilization Board to support these trials. MGPUB provides our program with checkoff funding to support applied agricultural research and generate results that directly benefit Maryland producers.
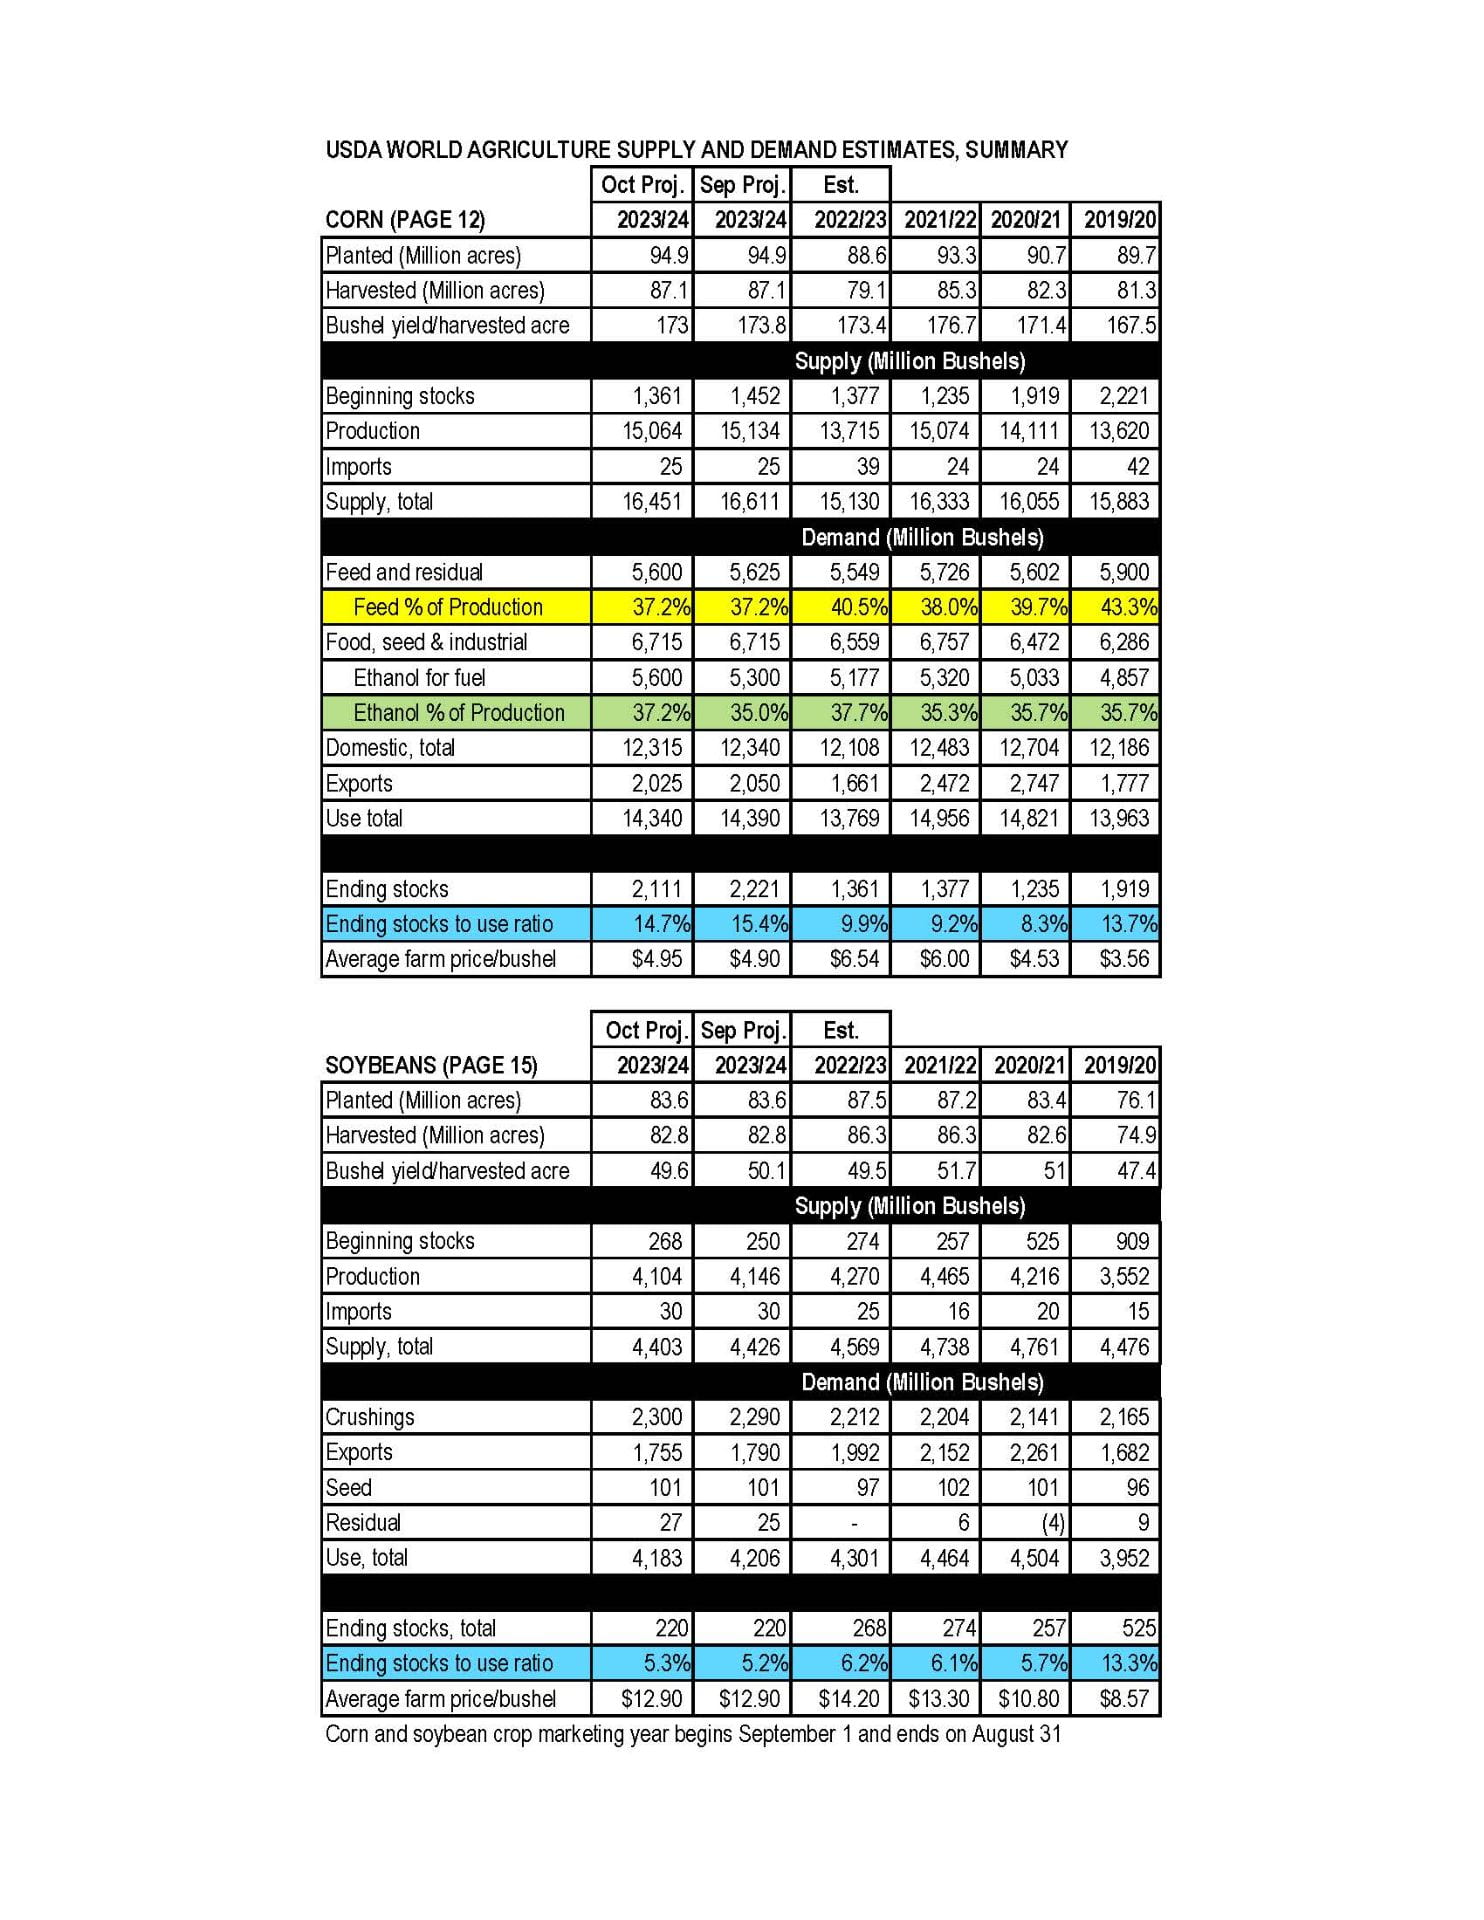
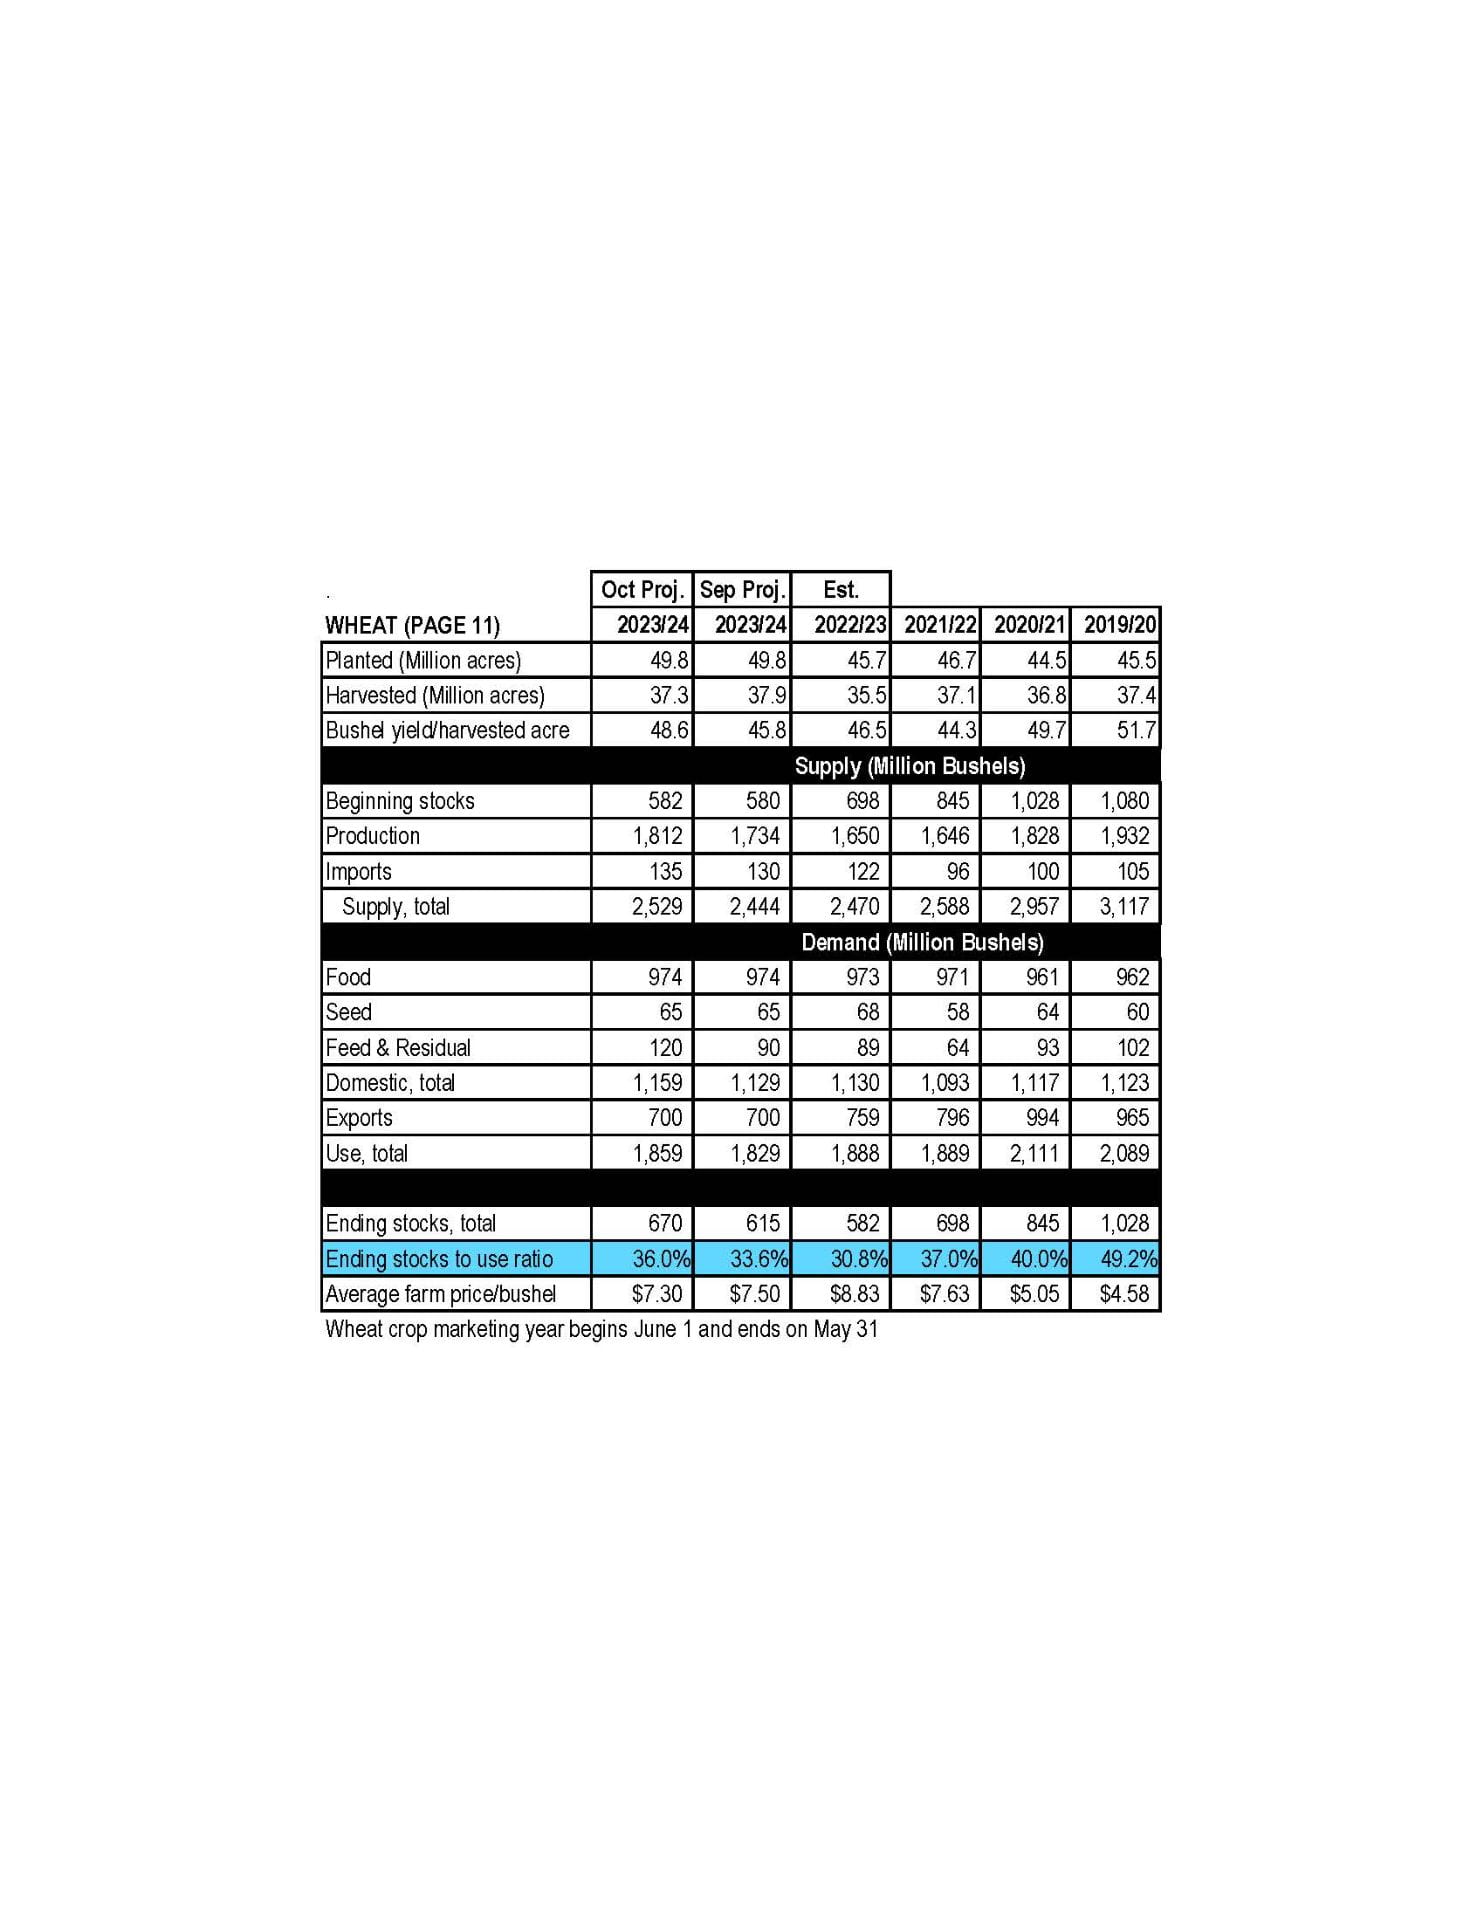
Attached is the summary for the October 2023 WASDE.
Corn
This month’s 2023/24 U.S. corn outlook is for reduced supplies, lower feed and residual use and exports, and smaller ending stocks. Corn production is forecast at 15.064 billion bushels, down 70 million on a cut in yield to 173.0 bushels per acre. Corn supplies are forecast at 16.451 billion bushels, a decline of 160 million bushels from last month, with lower production and beginning stocks. Exports are reduced by 25 million bushels reflecting smaller supplies and slow early-season demand. Feed and residual use is down 25 million bushels based on lower supply. With supply falling more than use, corn ending stocks for 2023/24 are lowered 110 million bushels. The season-average corn price received by producers is raised 5 cents to $4.95 per bushel.
Soybean
Soybean production is forecast at 4.1 billion bushels, down 42 million on lower yields. Harvested area is unchanged at 82.8 million acres. The soybean yield is projected at 49.6 bushels per acre, down 0.5 bushels from the September forecast. The largest production changes are for Kansas, Michigan, and Nebraska. With lower production partly offset by higher beginning stocks, supplies are reduced 24 million bushels. Soybean exports are reduced 35 million bushels to 1.76 billion with increased competition from South America. Soybean crush is projected at 2.3 billion bushels, up 10 million, driven by higher soybean meal exports and soybean oil domestic demand. Soybean oil domestic use is raised in line with an increase for 2022/23. With lower exports partly offset by increased crush, ending stocks are unchanged from last month at 220 million bushels.
Wheat
The outlook for 2023/24 U.S. wheat this month is for higher supplies, increased domestic use, unchanged exports, and higher ending stocks. Supplies are raised 85 million bushels, primarily on higher production as reported in the NASS Small Grains Annual Summary, released September 29. Domestic use is raised 30 million bushels, all on higher feed and residual use. The NASS Grain Stocks report released September 29 indicated a higher year-to-year increase for first quarter (June-August) domestic disappearance than previously expected. Exports remain at 700 million bushels with several offsetting by-class changes. Projected ending stocks are raised by 55 million bushels to 670 million, up 15 percent from last year. The season average farm price is reduced $0.20 per bushel to $7.30 on higher projected stocks and expectations for futures and cash prices for the remainder of the marketing year.
Andrew Kness, Senior Agriculture Agent | akness@umd.edu University of Maryland Extension, Harford County
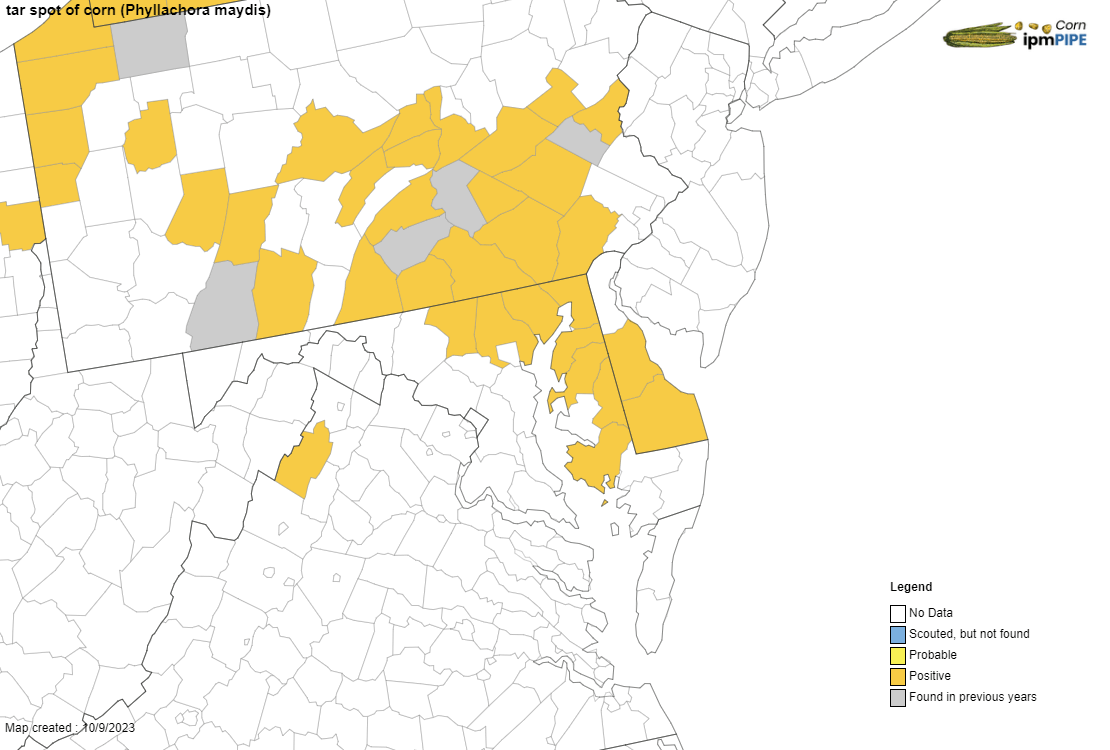
During the month of September we have confirmed the presence of tar spot of corn in four additional counties in Maryland. Fields with tar spot in Queen Anne’s and Kent County were found on September 19, Baltimore County on September 22, and Caroline County on September 25, and Dorchester County on October 6. This brings the confirmed distribution from Carroll County east to Cecil and south on the shore to Dorchester County (Figure 1). In my scouting travels a few weeks ago on the eastern shore, I was able to find tar spot in two out of a dozen fields that I visited.
Figure 1. Tar spot confirmed distribution as of October 9, 2023. Map downloaded from https://corn.ipmpipe.org/tarspot/.
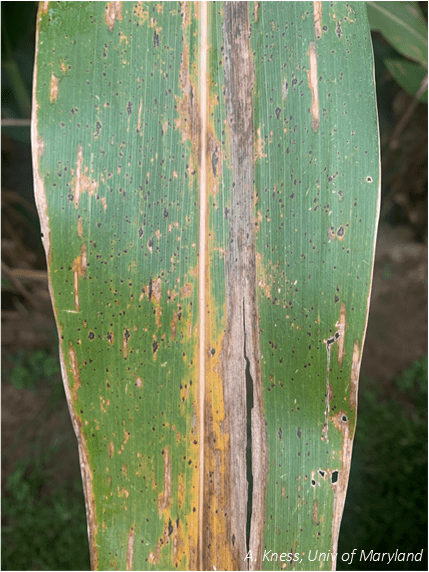
Note that this is the confirmed distribution—this is not to say that you will not find it outside of these reported counties; as a matter of fact, I’d be surprised if it’s not out there in several other areas across the state. As you harvest corn this fall, it might not be a bad idea to hop out of the cab and check around. Tar spot can still be visible on dry, senesced tissue. The signs of tar spot are dark black, raised spots that resemble spattered black paint (Figure 2). These spots are the reproductive structures of the fungus, Phyllachora maydis. These structures, called stromata, are embedded in the leaf tissue, are slightly raised (visible under a hand lens), and cannot be rubbed or scratched off the leaf.
Figure 2. Signs of tar spot on corn.
When you are scouting you may notice several look-alikes that can fool you. Insect frass (poop) is one that looks very similar but you can wipe the spots off the leaf. You may also notice other fungi present on senesced tissue, giving the leaves a black appearance. These fungi are not tar spot but are instead secondary decomposers—i.e. they colonize dead plant tissue. You can distinguish these fungi from tar spot by looking closely at the spots. Tar spot will be strikingly dark black against the dead tissue and slightly raised, whereas these secondary fungi are less distinct and not raised (Figure 3). Also, tar spot infections start on green tissue that is still alive, so check the few green leaves that are still present for signs.
Figure 3. Tar spot on a senesced corn leaf vs. look-a-likes. Stromata are still easily visible on dead leaves. Dull, faded/blurred spots are not tar spot.
As far as management considerations for this year and moving into 2024: tillage has varied success and generally has very little effect on tar spot. While tar spot does overwinter on old crop residue and tillage can help accelerate residue decomposition, research from the Midwest has shown highly inconsistent responses to tillage for managing tar spot. A couple of reasons for this is because tar spot can be wind-blown short distances; and with the concentration of corn fields present in many areas of the state, inoculum can blow into “clean” fields from nearby infected fields. Another reason that tillage doesn’t have a major effect is because most tillage equipment (besides a moldboard plow) leaves at least some residue on the soil surface. Those exposed crop residues can be enough to get an infection started the following year.
A more effective management tactic to consider is hybrid genetics. While there is no complete resistance to tar spot, there are hybrids that tolerate it much better than others. Using more resistant hybrids next year can help manage this disease, especially in fields where you suspect that tar spot could be an issue. In addition, you can use planting date and hybrid maturity to your advantage. The combination of early planting and a early-maturing hybrids can be used to “avoid” tar spot infections by having corn beyond its critical growth stages (VT-R2) before cooler weather sets in later in the season, which is favorable to tar spot infection.
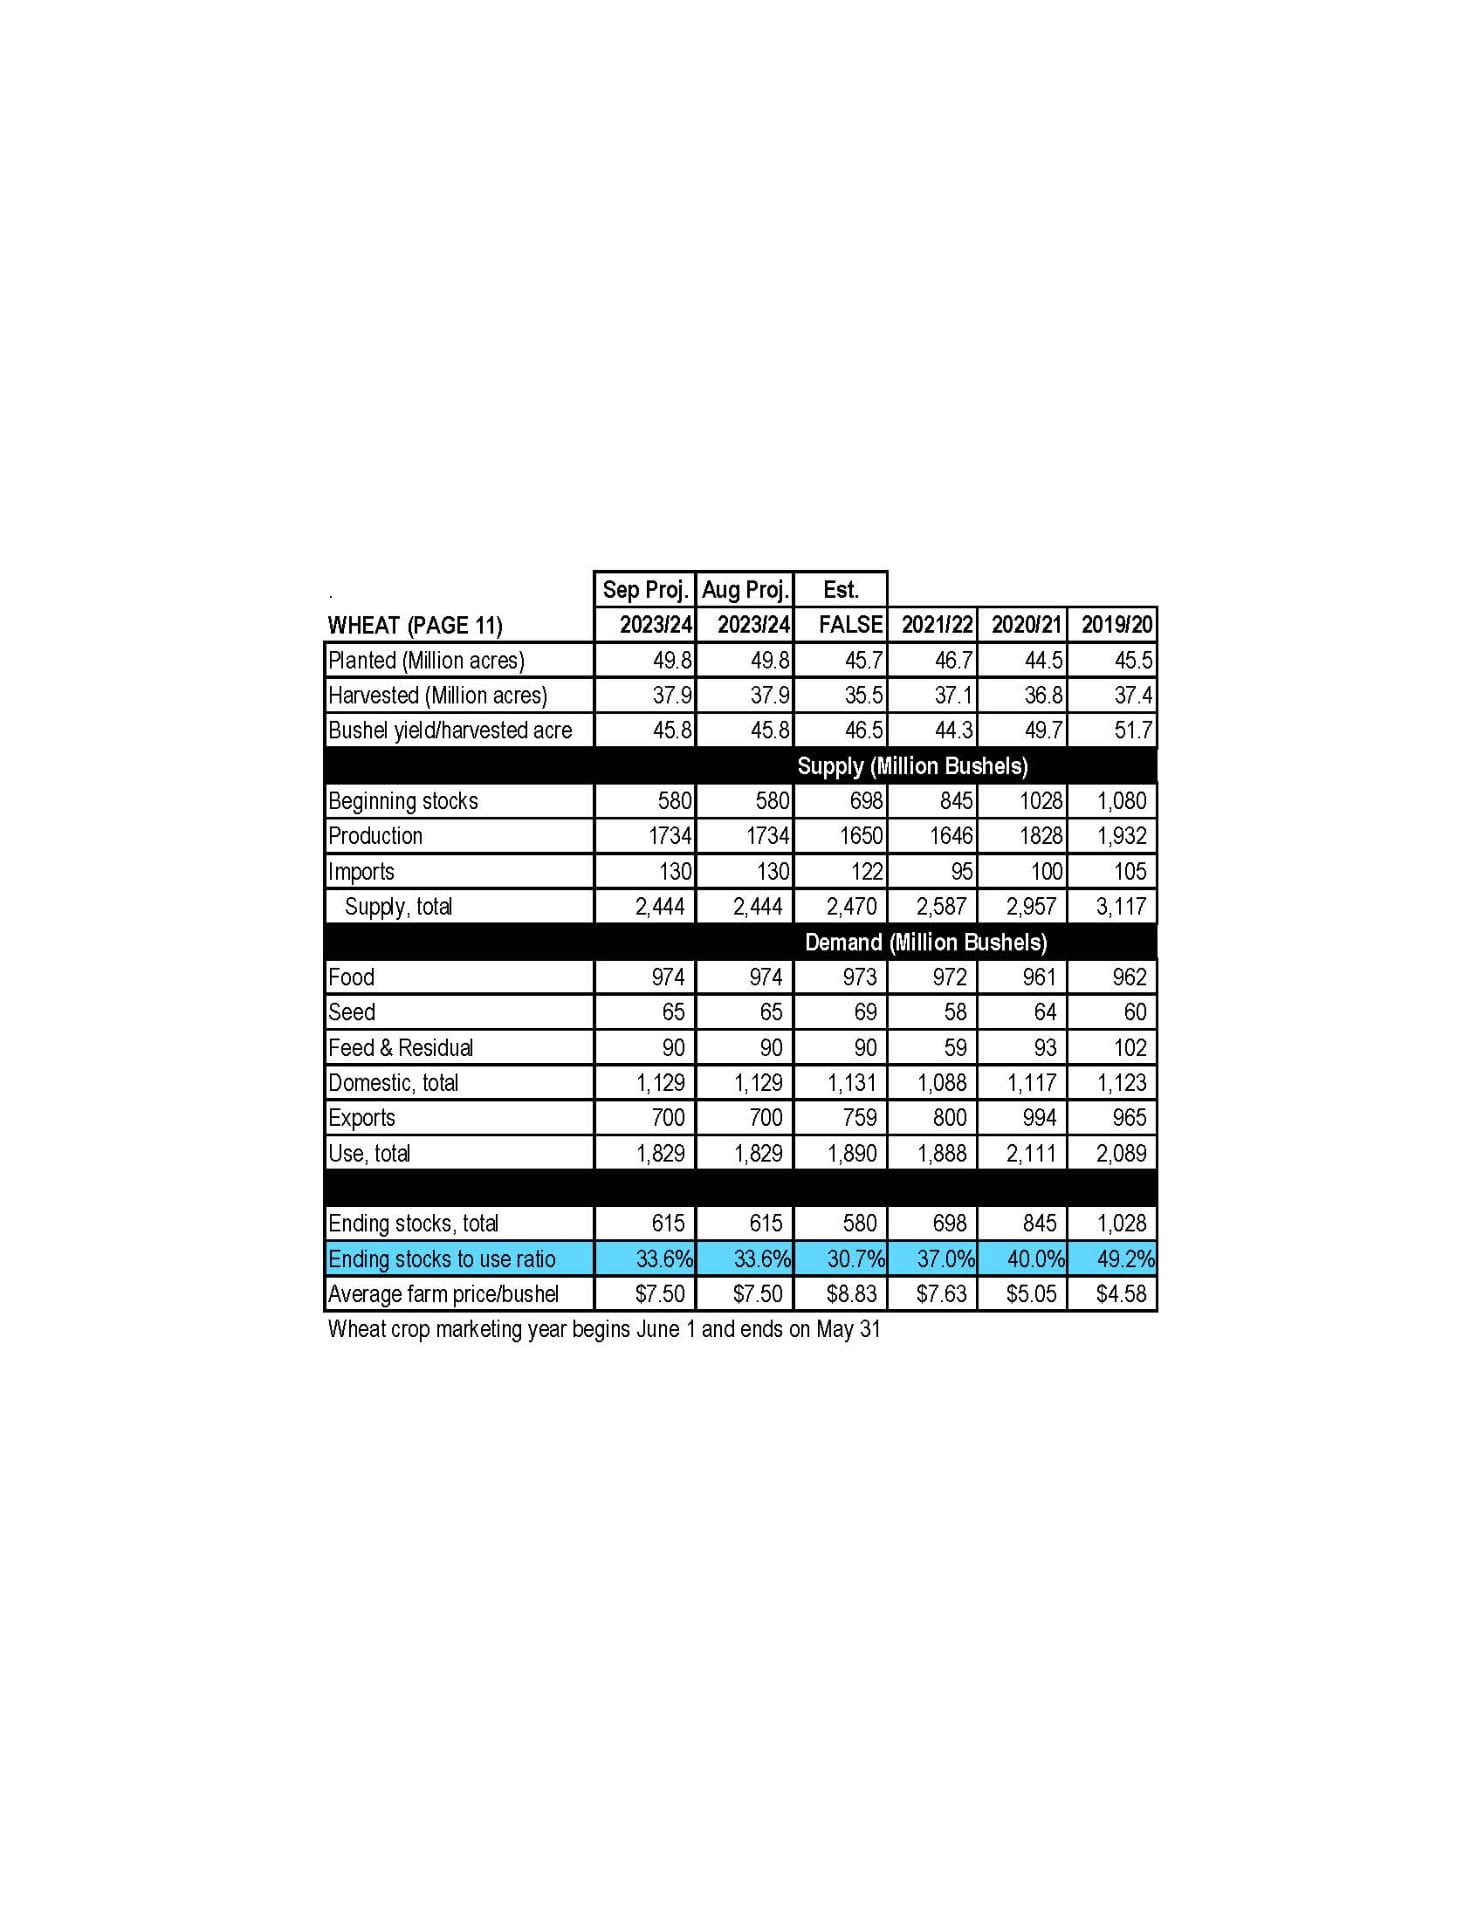
Attached is the summary for the September 2023 WASDE.
Corn
This month’s 2023/24 U.S. corn outlook is for slightly larger supplies and ending stocks. Projected beginning stocks for 2023/24 are 5 million bushels lower based on mostly offsetting trade and corn used for ethanol changes for 2022/23. Corn production for 2023/24 is forecast at 15.1 billion bushels, up 23 million from last month as greater harvested area more than offsets a reduction in yield. The national average yield is forecast at 173.8 bushels per acre, down 1.3 bushels. Harvested area for grain is forecast at 87.1 million acres, up 0.8 million. Total U.S. corn use is unchanged at 14.4 billion. With supply rising slightly and use unchanged, ending stocks are up 19 million bushels to 2.2 billion. The season-average corn price received by producers is unchanged at $4.90 per bushel.
Soybeans
U.S. soybean supply and use changes for 2023/24 include lower beginning stocks, production, crush, exports, and ending stocks. Lower beginning stocks reflect an increase for exports in 2022/23. Soybean production is projected at 4.1 billion bushels, down 59 million with higher harvested area offset by a lower yield. Harvested area is raised 0.1 million acres from the August forecast. The soybean yield of 50.1 bushels per acre is down 0.8 bushels from last month. The soybean crush forecast is reduced 10 million bushels and the export forecast is reduced 35 million bushels on lower supplies. Ending stocks are projected at 220 million bushels, down 25 million from last month. The U.S. season-average soybean price is forecast at $12.90 per bushel, up $0.20 from last month. The soybean meal price is unchanged at $380 per short ton and the soybean oil price is raised 1.0 cent to 63.0 cents per pound. Other changes this month include higher peanut and lower cottonseed production.
Wheat
The 2023/24 U.S. all wheat outlook for supply and use is unchanged this month with offsetting by-class changes on exports. The projected 2023/24 season-average farm price is also unchanged at $7.50 per bushel.
Andrew Kness, Senior Agriculture Agent | akness@umd.edu University of Maryland Extension, Harford County
Figure 1. Regional map of tar spot of corn for the 2023 growing season. Map generated from ipmpipe.org/tarspot.
Tar spot of corn has been confirmed in Maryland for the 2023 growing season. The first report came from a field in Cecil county on August 22, followed by several additional reports in Harford and Carroll county (Figure 1).
Tar spot is a relatively new fugal disease of corn in the United States and it was confirmed for the first time in Maryland in August of 2022. As daytime and nighttime temperatures begin to decline, now is a good time to look for symptoms in your corn fields. Tar spot is favored by cooler temperatures (60-70s), as well as prolonged periods (7+ hours) of leaf wetness from rainfall, dew, or humidity. Tar spot can cause infected plants to senesce prematurely, which can adversely affect yield, especially if infection occurs early in the reproductive stages. Yield losses are not as severe if infection occurs later in the reproductive stages.
Tar spot spores overwinter in old corn crop residue and are deposited onto corn leaves via splashing rain or wind (spores are only wind-blown for very short distances). Once a spore lands on corn tissue, it will germinate and infect the plant as long as the environmental conditions remain conducive. After an incubation period of about 14-21 days, black reproductive structures, called stroma, are visible on the leaf surface (Figure 2). These structures resemble black paint or tar, hence the name “tar spot.”
Figure 2. Symptoms of tar spot on corn leaf. Black specks are the reproductive structures of the fungus.
If you find tar spot in your field, you may want to take precautions to try to prevent its spread during harvest, as you could potentially inoculate new fields by bringing infected residue into the next harvested field. If you’re harvesting an infested field, it would be a good idea to try to remove as much corn fodder off of the equipment before moving to the next field.
Preparations for managing tar spot in 2024 should start in the winter with good seed selection. If possible, choose hybrids with good tar spot resistance (there is no complete resistance); seed companies are starting to rate hybrids for their tar spot resistance/tolerance.
If you find tar spot in your field, I would be interested in knowing about it. We have a grant from the Maryland Grain Producer’s Utilization Board and one objective of the study is to determine the distribution of tar spot in Maryland. Call (410-638-3255) or email me (akness@umd.edu); or submit a report at corn.ipmpipe.org.
Reports are for crop conditions up to August 3, 2023.
Western Maryland
Dry, dry, dry. Full season beans and corn are showing signs of drought stress. Many double crop beans are spotty and stressed. Hay yields are low so this winter could bring some hard decisions. The weatherman is giving us some hope with rain in the forecast but we have heard those predictions before only do be disappointed. The high heat has subsided and cooler overnight and morning temperatures are a welcome relief.—Jeff Semler, Washington Co.
Central Maryland
Scattered thunderstorms have resulted in above, at, or below typical rainfall for the month of July, depending on what part of the county you’re located in. For the year, though, we’ve received 50-100% of normal rainfall. Corn at R2-R3, and soybeans at R1-R2. We continue to catch zero moths in the fall armyworm trap or western bean cutworm traps. Japanese beetles are clipping corn silks, but with the kernels already pollinated, that should not cause yield damage. Insect pests are present in soybeans, but in low numbers.—Kelly Nichols, Montgomery Co.
The corn crop is finishing pollination and entering the early stages of kernel development. Recent scouting trips have revealed significant curling of upper leaves above the ear given the recent spell of dry weather. Interestingly, grey leaf spot is abundant in the central and lower portions of the county, though the majority of the infection appeared to be localized to the lower canopy away from the ear leaf. Full season soybeans are ending flowering and beginning pod-fill, while double crop beans are in the later stages of vegetative development and will shortly begin flowering. Japanese Beetle pressure in soybeans has been of primary concern with some fields reaching greater than 60% defoliation. Forage crop regrowth is limited at best given spotty rains, however quality is generally terrific.—Mark Townsend, Frederick Co.
Northern Maryland
Most of the region was fortunate to get sufficient and consistent rainfall for much of July needed for pollination in corn; although there are some areas in Carroll County that have remained excessively dry. Most of the corn crop has pollinated by now; looking at some ears, 16 rows around is quite common; I believe we lost a couple rows around due to the drought in May and June. With continued rainfall hopefully we can make up for it in kernels per row and kernel depth. Most soybeans are R3 and have very little disease or insect pressure. Double crop soybeans are out of the ground and growing rapidly. Some second cutting of hay was made but some farmers are holding off due to the slow regrowth.—Andy Kness, Harford Co.
Upper and Mid Shore
Most of the region has received adequate rainfall over the past few weeks with some areas getting excessive amounts. Corn yields will probably be pushing record yields again in most areas. Soybeans have excellent potential but still need rainfall to fill the pods. Most corn fields received a fungicide application whether needed or not. Stinkbugs are present in most fields. Troublesome weeds are outgrowing beans in some fields and being spot sprayed. Hay has been hard to make for the past month.—Jim Lewis, Caroline Co.
Lower Shore
It was a good year for wheat, with higher than average yields. Corn was hurt a bit by early dry weather, but has really turned around in the last three weeks after several rains. Most corn is currently in reproductive stages. Late corn will probably yield better than early planted corn. Most soybean is still in vegetative growth stage. Full season soybean was hurt a little due to dry weather, and are a little shorter than normal, but doing pretty well. Double-crop soybean is looking good. Cover crop sign-up acreage for the 2023-24 season has increased from last year.—Sarah Hirsh, Somerset Co.
Southern Maryland
We have continued to receive rain just in the nick of time during the last month. As is normally the case this time of year, there are areas with too much rain and others with too little, but overall, growing conditions have been favorable. Corn is mostly all pollinated and in the grain fill stage. Full season beans are also in good condition. We had adequate moisture during the week of hot weather which limited the adverse effect on crop condition. Double crop beans were late being planted following a late wheat harvest and most fields have not yet canopied. In both corn and soybean, Palmer amaranth, Waterhemp and common ragweed are making their normal debut above the crop canopy. Vegetable crops are coming off now with a consolidated harvest season due to the cooler May and hot temperatures as of late squeezing harvest the window.—Ben Beale, St. Mary’s Co.
 Reports are for crop conditions up to November 16, 2023.