Due to wet conditions across many parts of the state, the Maryland Department of Agriculture has extended the November 5 planting deadline by one week for farmers who signed up for grants to plant fall cover crops through the Maryland Agricultural Water Quality Cost-Share (MACS) Program. Farmers now have until November 12 to plant qualifying cover crops of wheat, spelt, rye, and triticale in their fields.
The extension is only available to farmers who use the following planting methods: no till, conventional, or broadcast with light, minimum, or vertical tillage. With the extension, farmers must certify their cover crop with their local soil conservation district within one week of planting and no later than November 19 in order to be reimbursed for associated seed, labor, and equipment costs.
Cover crops are cereal grains that grow in cool weather. As they grow, cover crops provide a protective cover against erosion and nutrient runoff while building the soil’s organic matter for the next year’s crop. Cover crops are widely considered one of the most cost-effective and environmentally-sustainable ways to protect water quality in local streams, rivers, and the Chesapeake Bay.
Maryland’s Cover Crop Program is administered by the MACS Program and the state’s 24 soil conservation districts. Funding is provided by the Chesapeake Bay Restoration Fund and the Chesapeake and Atlantic Coastal Bays Trust Fund. For more information, farmers should contact their local soil conservation district or the MACS Program’s office at 410-841-5864.
Reports are for crop conditions up to October 6, 2020.
Western Maryland
Soybeans and corn are being harvested with wheat and cover crops being planted as soon as combines leave the fields. Manure is also covering many fields planted with cover crops. Welcome rains of early September have been followed by another dry spell. Hopefully the clouds of October will be more generous with their moisture.—Jeff Semler, Washington Co.
Central Maryland
The cooler weather has been a welcome change from this summer. September’s rain amounts and locations were scattered across the region. Corn grain harvest has begun. Soybean fields are drying down, with some ready to be harvested in the next couple weeks. It’s not too early to start thinking about weed control for next season, especially if dealing with herbicide resistant weeds like marestail. If planting a small grain, be sure to start clean and stay clean!—Kelly Nichols, Montgomery Co.
Northern Maryland
We were a tad dry in September and recent rains have been welcome. Corn harvest has been occurring for approximately 3 weeks now, although not at full force until the last few days. Corn yields are certainly down compared to last year’s record numbers; probably 10-20% lower. Even with that said, corn yields are better than anticipated considering how dry June/July was. Full season soybeans are drying down quickly and what’s been harvested so far has yielded exceptionally well. The double crop beans do not look nearly as promising, as a dry July severely inhibited establishment and dry September reduced pod set/bean size. Cover crop establishment has been good and the 2021 wheat and barley crop are going in the ground smoothly.—Andy Kness, Harford Co.
Upper & Mid Shore
Corn harvest is around half complete. Dryland yields are well above average, and may end up near all time highs. Irrigated yields are off 10-15%- probably due to too many cloudy, humid, hazy, poor light quality days. Soybean harvest is just beginning. Beans look really good. It’s still too early to predict yield, but we definitely grew a tremendous amount of forage. Early planted cover crops are off to a great start. Small grain planting is just beginning.—Jim Lewis, Caroline Co.
Lower Shore
Harvest is underway. Approximately 25% of corn has been harvested. Corn yield reports are 125 plus or minus bushels per acre. Sorghum is also ready to be harvested. Soybean harvest has not yet begun, although fields are now beginning to reach full maturity. We had a 2-3” rain event last week, which prevented entry to fields for several days. So far, the weather has been sunny and breezy this week, helping to dry crops down. Palmer amaranth is apparent in some fields, and we urge growers to harvest these fields last and thoroughly clean equipment to prevent the spread of seed. The planting of fall cover crops is underway.—Sarah Hirsh, Somerset Co.
Southern Maryland
Sunny conditions this week are finally allowing for good progress on corn harvest. Corn moisture levels are stubbornly running around 18-22% and saturated ground has made corn harvest a challenge this year. We continue to see a fair amount of ear rot issues. Cover crop planting is behind schedule as farmers struggle to get corn in. Soybean harvest has not yet begun, but there are some really good-looking soybean fields. We expect excellent double crop beans and a very good full season crop. The drier weather has provided some opportunities for getting in dry hay. We continue to struggle with orchardgrass persistence in this area. Fields that looked picture perfect in the spring and early summer are now looking more like fields of weeds with patches of crabgrass and the majority of orchardgrass gone. We have some work to do to figure out the persistence issue or rely more heavily on other species. Vegetable harvest is winding up. The pumpkin and cucurbit crop was hurt by heavy rainfall.—Ben Beale, St. Mary’s Co.
The Maryland Department of Agriculture (MDA) is accepting applications for the Farming for Healthy Soil Program. This three-year program begins this fall and provides financial assistance to farmers for implementing soil health practices on their farm. All livestock and crop (including grain, forage, fruit, and vegetables) farms are eligible for this program. Approved soil health practices include conservation tillage/residue management, multi-species cover crop mixtures, extended season cover crops, prescribed grazing, and precision nutrient management. Practices must be new to the farm; for example, adopting a practice never used on site before or changing from a one species cover crop to a two species cover crop.
Rates range from $10 to $55 per acre. Fields eligible for the Maryland Agricultural Water Quality Cost Share (MACS) Cover Crop Program can receive financial assistance from this grant in addition to the MACS funding; however, MACS enrolled fields must be extended season (planted before October 1 and terminated after May 1) or multi-species cover crops. The maximum funding per participating producer is $5,000 annually. Farmers must be in compliance with MDA programs (i.e. nutrient management) in order to participate.
Farmers are expected to commit up to three years of practice implementation on the same field(s). Soil samples will be taken this fall and again in the fall of 2022 to compare before and after practice implementation. Soil samples will also be taken in adjacent or nearby fields which have not had soil health practices to serve as control fields. University of Maryland Extension Agriculture Agents will be collecting the soil samples for farms in Western and Central Maryland.
The application form should be submitted to Kevin Antoszewski, MDA Healthy Soils Program Coordinator, at kevin.antoszewski@maryland.gov. For questions, contact Kevin (email is preferred, but a voicemail can be left at 410-841-5866) or Kelly Nichols, University of Maryland Extension Ag Agent, at 301-600-3577 or kellyn@umd.edu.
Nicole Fiorellino, Extension Agronomist University of Maryland, College Park
Dairy farmers are constantly looking for sources of forage to meet their feed needs. One source that many of our region’s dairy farmers utilize is the fall planting of cereal grains that are green-chop harvested the following spring. Among the cereal species used for this purpose are rye, triticale, barley, and wheat. Per the Maryland Cover Crop Program guidelines, cereal grains planted as a cover crop prior to November 5 and suppressed via green-chop in the spring are eligible for the grant payment for participation in the Cover Crop Program. In addition, per the Nutrient Management Regulations, a fall application of dairy manure is allowed to a field planted to a cereal cover crop.
Planting a cereal cover crop that will be green chop harvested fits well into the crop rotation used by many dairy farmers. The scenario that many follow is to plant the cereal cover crop following harvest of corn silage. Prior to planting the cover crop, an application of manure is made to the field. The subsequent planting of the cover crop provides incorporation of the manure into the soil. The fall and spring growth of the cover crop is supplied nutrients from the manure. At the same time, the cover crop provides protection to the soil from loss of nutrients via leaching and/or erosion. The objective of this study was to evaluate select varieties of cereal species for cover crop performance and forage production and quality.
Cereal varieties (21) representing four species (rye, triticale, wheat, barley) were evaluated at Central Maryland Research and Education Center – Clarksville Facility. Three replications for each entry were planted using a randomized complete block experimental design. Planting date was October 11, 2019. The 3’ X 18’ plots were planted with a small plot planter with 6-inch spacing between each of the 7 rows. The germination percentage for each entry was used to calculate the seeding rate needed to establish 1.5 million seedlings. Good stands were established in most plots by late fall.
Our goal each year is to time spring biomass harvest with when entries reach late boot to early heading stage of development. With the cool spring this year, plant growth and development slowed, with heading delayed until mid-May for most entries (Table 2) and harvest dates varying among the entries (listed in Table 1). Each harvest sample was collected by cutting the plants just above ground-level from three center rows of each plot from an area 2.5 feet in length and from two areas within the plot. The samples were placed into cloth bags and dried using a forced air dryer set at 60o C where they remained until sample water content was zero. Each sample was weighed and is reported as pounds of dry matter production per acre (Table 1). Each of the dried samples was ground through a 20-mesh screen using a large plant grinder and the ground biomass samples were sent to Cumberland Valley Analytical Laboratory for standard forage quality analysis.
Cover crop performance is measured by amount of biomass produced and the concentration of nitrogen (N) in the biomass. These two factors were used to estimate N uptake (Table 2). The cool weather this spring delayed harvest of this study, likely contributing to the higher biomass and N uptake observed this year compared to last year’s trials. There was no significant difference in nitrogen uptake among the varieties tested. A number of forage quality characteristics for these cereals was measured (Table 2). The descriptions of the various quality characteristic are described here and in the footnotes at the bottom of Table 2. Crude protein (CP) is the N content of the forage, with higher protein representing better feed quality. This value was used to calculate nitrogen uptake of each variety (Nitrogen content = % CP/6.25). Both rye varieties and the barley check variety had significantly greater CP than the overall mean, with a number of triticale varieties having significantly less CP content than the overall mean. One rye and the barley variety also had rumen degradable protein (RDP) content significantly greater than the overall mean.
Neutral and acid detergent fiber (NDF, ADF) are measures of feed value and represent the less digestible components of the plant, with NDF representing total fiber and ADF representing the least digestible plant components. Low NDF and ADF values representing increased digestibility; ideally NDF values should be <50% and ADF values should be <35%. Values of both traits were above the ideal this year, as the late harvest resulted in more mature plants. Despite this, four triticale varieties (TriCal EXP 20T02, BCT 15509, BCT 18001, bCT 19005) had significantly lower NDF and ADF values than the overall mean, representing a digestible triticale varieties. This same variety also had significantly higher total digestible nutrients (TDN), net energy for lactation (NEL), relative feed value (RFV), and non-fiber carbohydrates (NFC), indicating good performing varieties.
The characteristic that best captures the overall forage quality performance is Relative Feed Value (RFV). A RFV of 100 is defined as the forage value that full bloom alfalfa would have. In addition to the triticale varieties mentioned previously, one additional triticale variety (TriCal Gainer 154) and the barley and wheat check varieties had RFV values significantly greater than the overall mean.
Though, none of these green-chop cereal forages are considered to be adequate as a stand-alone feed for a dairy operation, they can supply a source of forage used in a total mixed ration at the time of year when feed supply may be running short. When this forage benefit is added to the environmental benefit that is gained, planting winter cereal cover crops on a dairy farm can be a win-win decision.
This work could not be accomplished without the assistance and oversight of all field operations by Mr. Louis Thorne and Mr. Joseph Crank. We acknowledge the assistance of the undergraduate students who work with Dr. Jason Wight (Shana Burke and Deonna Cousins) for their assistance with seed packaging.
Table 1. Average harvest date for cereal species evaluated in Clarksville, MD in 2019-2020.
Variety
Species
Average harvest date
TriCal Exp 19R01
Rye
May 11
Rye VNS (check)
Rye
May 4
Mercer Brand Tri-Cow 814
Triticale
May 4
TriCal Gainer 154
Triticale
May 4
TriCal Flex 719
Triticale
May 13
TriCal Surge
Triticale
May 11
TriCal Merlin Max
Triticale
May 13
TriCal Thor
Triticale
May 13
TriCal Exp 20T02
Triticale
May 13
TriCal Exp 20T03
Triticale
May 13
TriCal Exp 20T04
Triticale
May 27
BCT 15509
Triticale
May 11
BCT 15513
Triticale
May 27
BCT 18001
Triticale
May 13
BCT 18002
Triticale
May 13
BCT 19003
Triticale
May 27
BCT 19004
Triticale
May 13
BCT 19005
Triticale
May 13
BCT 19006
Triticale
May 13
Nomini (check)
Barley
April 14
P25R25 (check)
Wheat
May 27
Table 2. Forage and cover crop performance of cereal species evaluated in Clarksville, MD during 2019-2020 growing season.
Variety
Species
Biomass Yield
lb DM/a
Head
Date
1Nitrogen
Uptake
lb N/a
2Crude
Protein %
3Soluble Protein
% DM
4RDP
% DM
5ADF
% DM
6NDF
% DM
7Ash
% DM
8Total
Digestible
Nutrients
% DM
9Net
Energy
Lactation
(Mcal/lb)
10RFV
11Non Fiber
Carb.
% DM
TriCal Exp 19R01
Rye
20655
April 17
395
11.9*
6.7*
9.3
41.8
64.0
7.4
56.5#
0.57#
82.0
15.2#
Rye VNS (check)
Rye
20490
May 3
351
10.7*
4.4
7.6*
42.5
65.6
7.4
57.2
0.58
79.2#
14.4#
Rye Mean
20573
April 25
373
11.3*
5.6
8.4
42.2
64.8
7.4
56.9
0.58
80.6
14.8
Mercer Brand Tri-Cow 814
Triticale
23096
April 23
344
9.4
3.9
6.6
39.3
62.4
7.0
59.1
0.60
87.0
19.5
TriCal Gainer 154
Triticale
22925
May 4
260
9.5
3.9
6.7
37.4
59.5
6.6
60.3
0.61
96.5*
22.7
TriCal Flex 719
Triticale
24363
May 13
296
7.6#
2.8#
5.2#
42.7*
64.6
7.2
57.3
0.58
80.0#
19.2
TriCal Surge
Triticale
22601
May 13
312
8.5
3.0
5.8
40.8
62.0
7.7
58.2
0.59
85.5
20.1
TriCal Merlin Max
Triticale
22618
May 13
295
8.1
3.1#
5.6#
41.1
63.4
8.0
57.3
0.58
83.5
19.0
TriCal Thor
Triticale
27172
May 14
357
8.2
3.6
5.9
44.7*
65.3
7.8
55.7#
0.56#
78.0#
17.4
TriCal Exp 20T02
Triticale
23820
May 12
290
7.6#
2.5#
5.1#
34.5#
54.5#
7.0
62.9*
0.64*
106.0*
29.0*
TriCal Exp 20T03
Triticale
24867
May 13
341
8.6
3.0#
5.8
41.6
61.5
8.5*
57.9
0.59
85.3
19.8
TriCal Exp 20T04
Triticale
28459*
May 15
343
7.6#
4.0
5.8
48.7*
72.6*
7.4
52.7#
0.53#
65.3#
11.3#
BCT 15509
Triticale
22927
May 14
318
8.6
3.8
6.2
35.3#
56.9#
6.9
62.1*
0.63*
100.5*
25.7*
BCT 15513
Triticale
28316*
May 16
358
7.8#
5.0*
6.3
42.6
64.7
6.4
57.1
0.58
80.5#
19.8
BCT 18001
Triticale
25363
May 11
347
8.6
3.4
6.0
37.1#
56.7#
7.7
61.4*
0.63*
98.3*
25.1*
BCT 18002
Triticale
25654
May 12
318
7.8#
3.1#
5.4#
41.6
63.2
6.5
58.4
0.60
84.0
21.1
BCT 19003
Triticale
28526*
May 16
329
7.2#
3.8
5.5#
47.4*
70.2*
5.7#
64.2*
0.55#
69.0
15.9#
BCT 19004
Triticale
28740*
May 13
366
7.9#
2.8#
5.4#
41.3
62.2
7.0
58.2
0.59
85.0
21.3
BCT 19005
Triticale
24173
May 13
332
8.6
3.0#
5.8
36.6#
57.7#
7.1
61.4*
0.63*
97.5*
24.7*
BCT 19006
Triticale
27915
May 12
330
8.5
3.1#
5.8
36.7#
58.6
7.2
60.7
0.62
95.5
23.9
Triticale Mean
25358
May 12
329
8.3
3.4
5.8
40.3
61.8
7.2
58.7
0.60
87.5
21.1
Nomini (check)
Barley
15044#
April 23
341
14.2*
6.6*
10.5*
34.4#
55.6
9.0*
61.7*
0.63*
104.2*
19.2
P25R25 (check)
Wheat
25376
May 16
189
7.3#
3.7
5.5#
34. 4#
53.7
5.3#
62.7*
0.64*
107.7*
32.4*
Overall Mean
24269
May 10
329
8.9
3.8
6.4
39.9
61.5
7.2
58.8
0.60
88.5
20.8
LSD0.1
3816
2 days
–
0.9
0.6
0.7
2.7
3.4
0.8
2.1
0.02
7.5
3.4
*,# Indicates the entry was either significantly greater (*) or significantly (#)less than the overall mean for that feed characteristic. 1Nitrogen uptake (lb N/acre) for each entry was estimated by multiplying the lb DM/ac X % nitrogen contained in the DM. The percent nitrogen for each entry was calculated by dividing crude protein by the conversion factor 6.25 which is the average amount of nitrogen (%) contained in protein. 2Crude Protein %: represents total nitrogen content of the forage; higher protein is usually associated with better feed quality. 3Soluble Protein %: non-protein N and portion of true proteins that are readily degraded to ammonia in the rumen. 4RDP (Rumen Degradable Protein): portion of crude protein that microbes can either digest or degrade to ammonia and amino acids in the rumen. 5ADF (Acid Detergent Fiber): represents the least digestible fiber portion of forage; the lower the ADF value the greater the digestibility. 6NDF (Neutral Detergent Fiber): insoluble fraction of forage used to estimate the total fiber constituents of a feedstock. 7Ash: mineral elements of the forage. 8TDN (Total Digestible Nutrients): measure of the energy value of the forage. 9Net Energy Lactation: estimate of the energy in a feed used for maintenance plus lactation during milk production. 10RFV (Relative Feed Value): indicates how well an animal will eat and digest a forage if it is fed as the only source of energy. 11Non Fiber Carbohydrates: represents all forms of digestible carbohydrates (starch, sugar, pectin, and fermentation acids) in the forage.
Table 3. Brands and companies in the 2019-2020 Maryland cereal forage trials.
Ray Weil1, Kevin Conover2, Mia Godbey1 1Dept of Environmental Science and Technology and 2Central Maryland Research and Education Center University of Maryland, College of Agriculture and Natural Resources
Weed control is almost invariably cited as one of the biggest challenges for the organic production of grain crops. Synthetic herbicides cannot be used in organic farming, leaving tillage as the main weed control option. Tillage is also the main method of terminating cover crops in organic farming, although roller-crimping can work under some circumstances. The lack of chemical means of weed control makes low disturbance or no-till organic farming extremely difficult if not impossible on a commercial scale.
This spring we conducted a preliminary trial to access the efficacy of a new organically-approved herbicide called Weed Slayer® (based on Eugenol, an essential oil from cloves, molasses, and a biological surfactant mixture). This product comes in two parts, the Clove Oil product, and the microbial surfactant product, that must be mixed together in equal parts. The manufacturer, Agro Research International, recommends a rate of 1-3 quarts/acre of each part in 20-25 gallons water/acre.
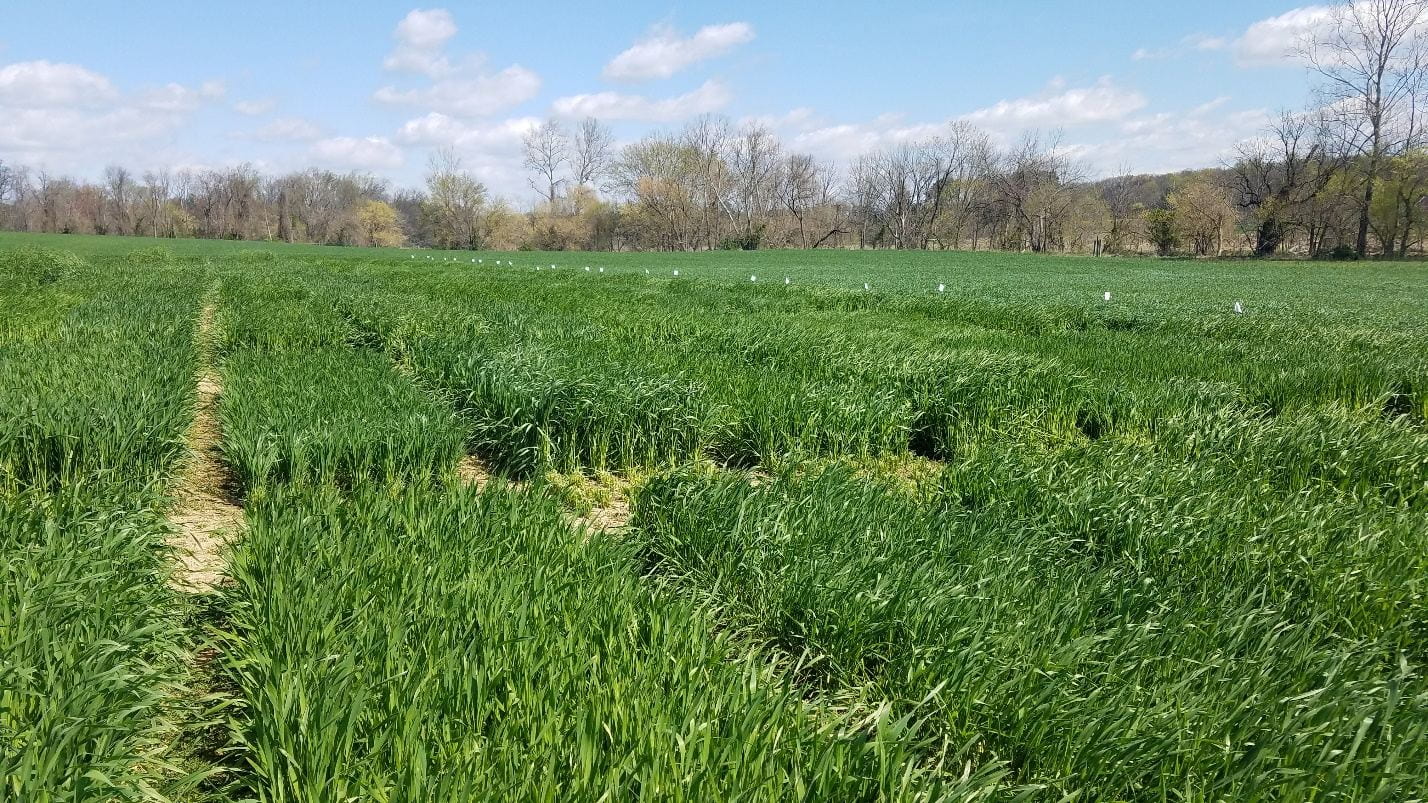
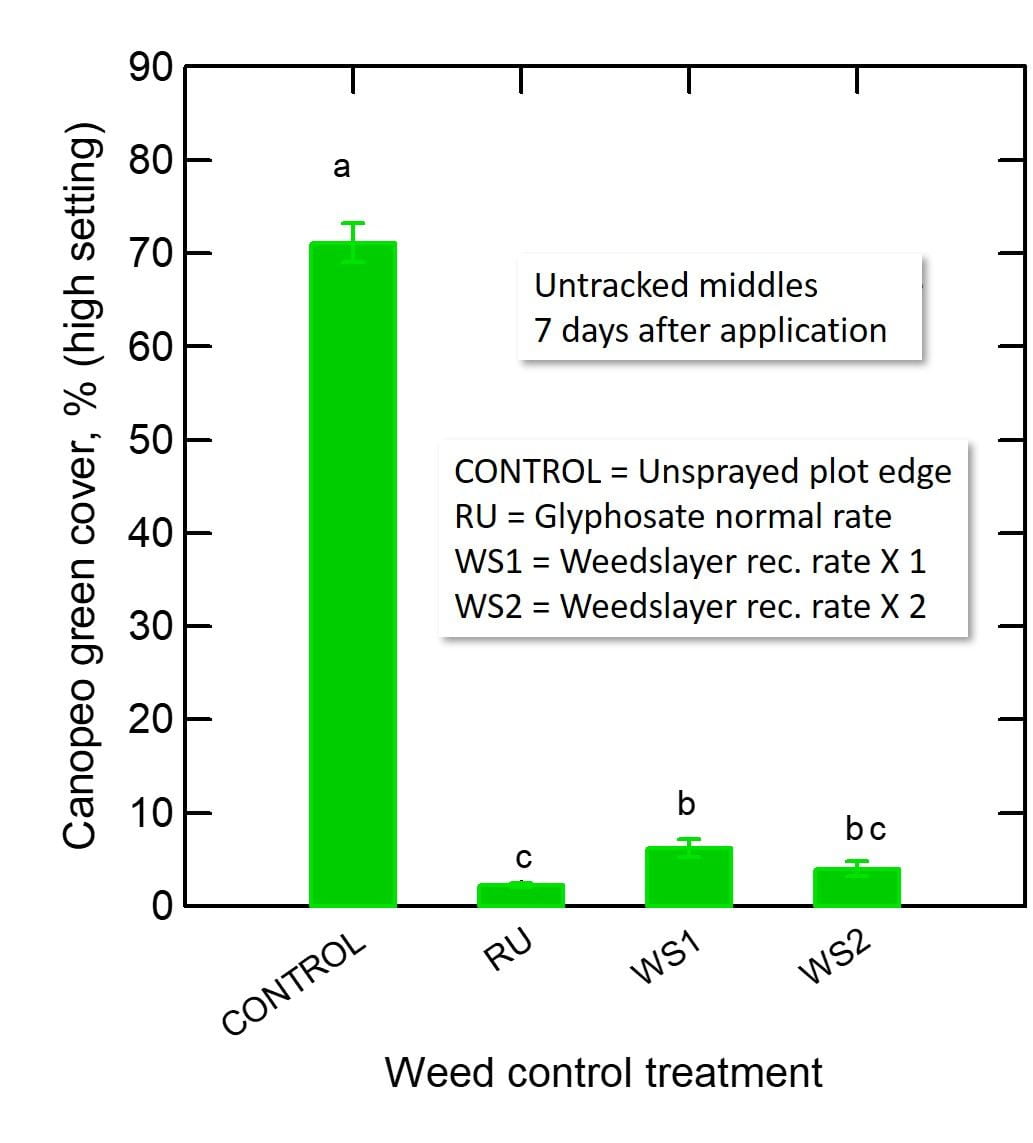
We established a cover crop stand that initially included 12 species (originally 4 legumes, 4 brassicas, and 4 kinds of grass) planted in fall 2019, but because of the very dry conditions in August-October 2019 and winter killing of the radish, we ended up with a few plots of good cover crop biomass (>3,000 lbs/acre dry matter) consisting of mainly red, white and crimson clovers, hairy vetch, annual ryegrass, and cereal rye with the occasional turnip or kale. The covers were allowed to grow into full flowering. On May 27, soybeans were “planted green” in and the plots were sprayed with three herbicide treatments: 1) RU: the normal rate of Glyphosate, 2) WS1: the recommended rate of 1 quart/acre each part of Weed Slayer®, and 3) WS2: a rate of 2 quart/acre rate of each part of Weed Slayer® (Figure 1).
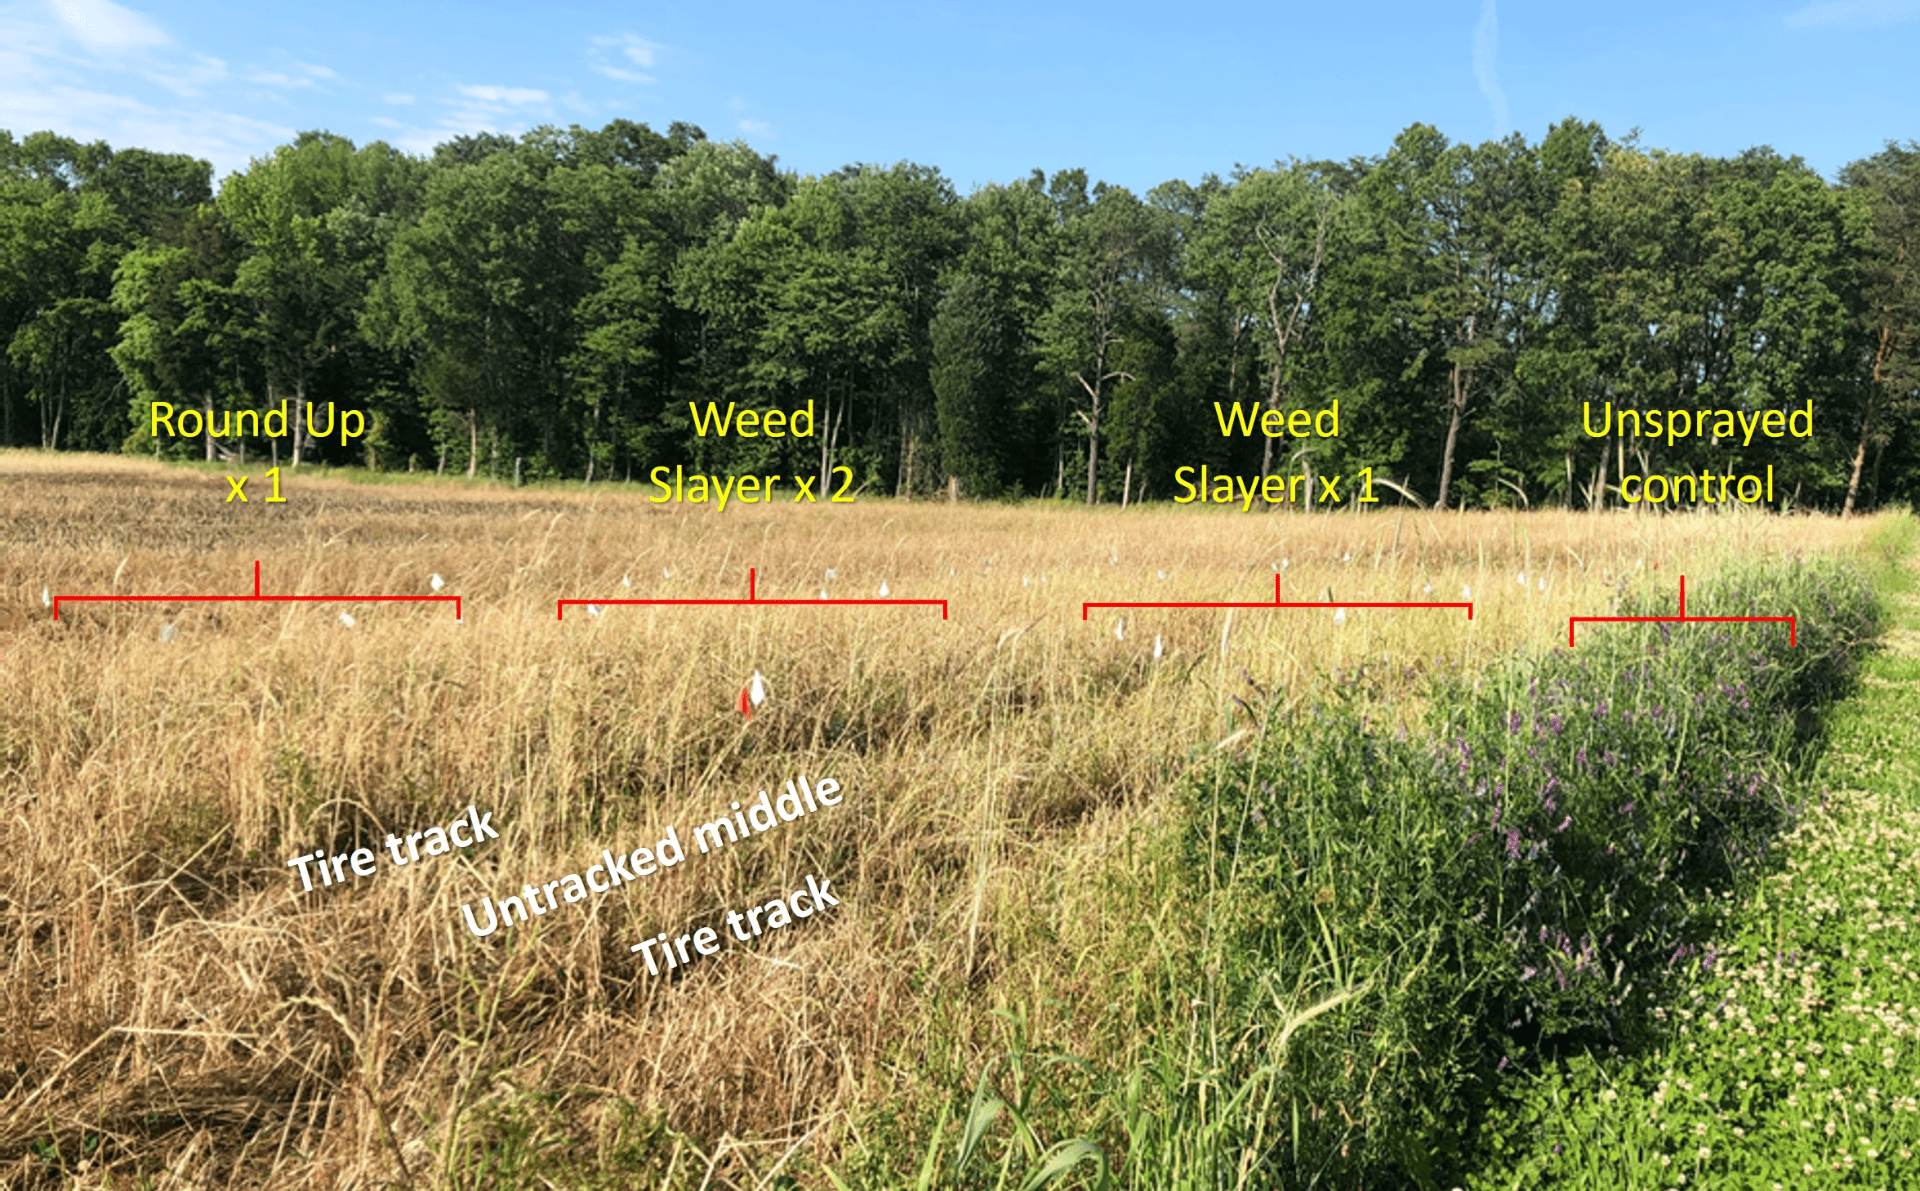
Figure 1. Appearance of sprayed multi-species cover crop plot 7 days after treatments were applied.
We used the Canopeo app (canopeoapp.com) to measure the green cover percentage at 2 and 7 days after spraying at 6 locations within the tire tracks and within the untracked middle area of each plot. On day 7 we also measured the green cover of the unsprayed cover crop at the edge of the field (to serve as a control). We did this in two blocks about 80 feet long and 45 ft wide. At four weeks after spraying, visual observations were made to access any possible regrowth of the cover crop.
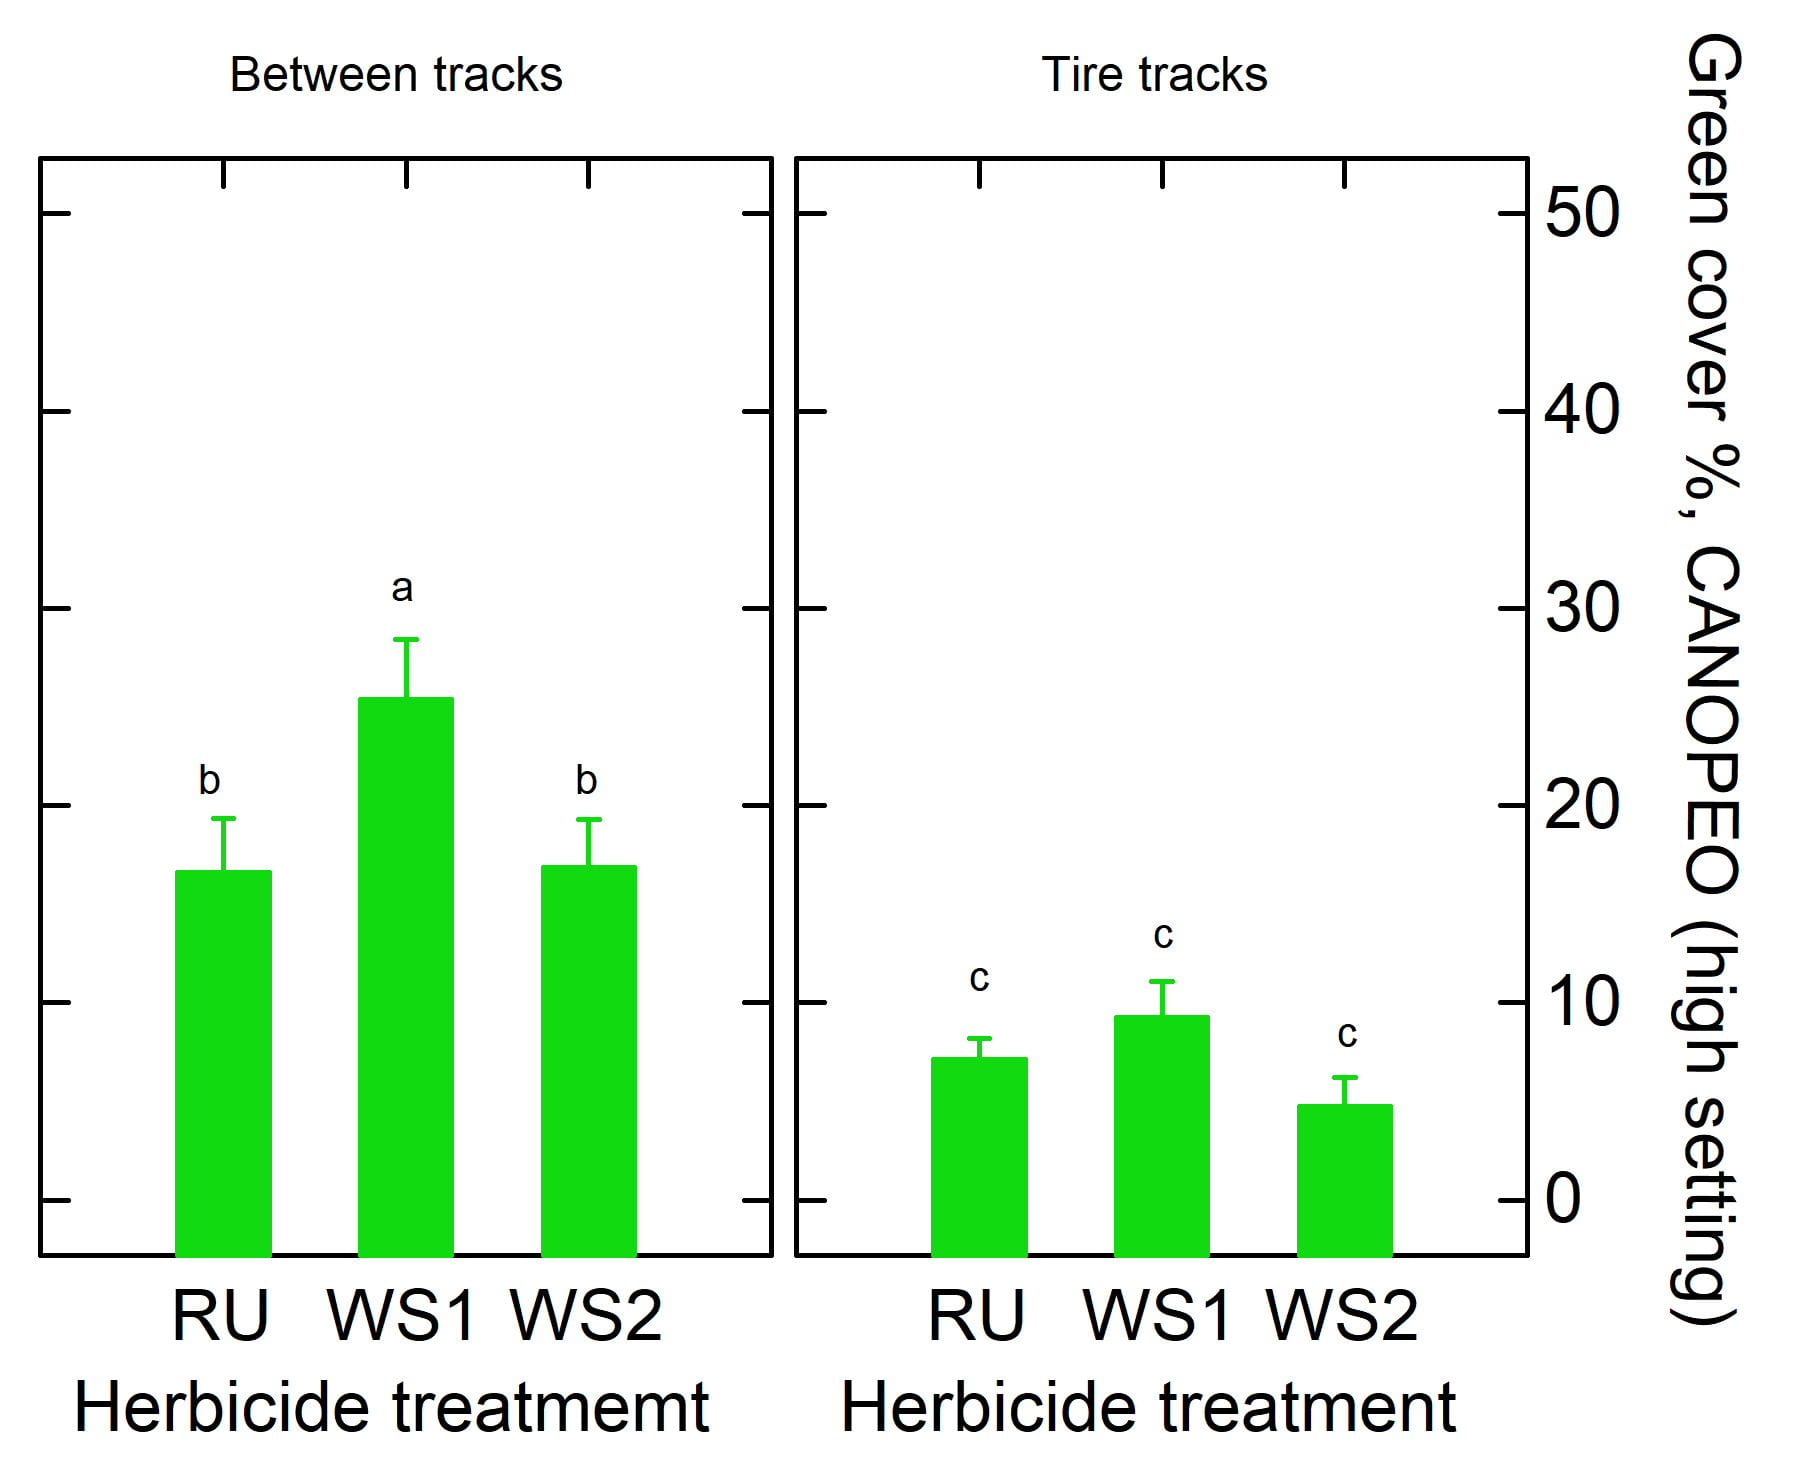
Results. Two days after spraying, the effect of the tractor tire tracks was quite evident, with less remaining green foliage in the tracks than in the untracked middle rows of the plot (Figure 2). In the untracked area, the 1 quart/acre rate of Weed Slayer® had about 25% green area remaining, which was greater than the 18% green area for the Round-Up and the 2-quart rate of Weed Slayer®. In the tire tracks, less than 10% green area remained for all three treatments.
Figure 2. Percent green (living foliage) area two days after herbicide treatments were sprayed on multi-species cover crop. Measurements were made in the tractor tire tracks (right) and in the untracked middle row (left) of the plot.
By the 7th day after application, there was no difference among the three spray treatments in green cover in the tire tracks where the only detectable green foliage was that of the emerging soybean seedlings (data not shown). There was also very little difference in the untracked middle of the plot with Round-Up and Weed Slayer®2X exhibiting statistically the same percent green area (Figure 3), which was almost entirely due to the emerged soybean seedlings. The Weed Slayer® 1 quart/acre rate had about 5% green area, which was statistically greater than the Round-Up plots, and about half due to cover crop and half to soybean seedlings. The grasses were killed earlier than the legumes by both herbicides, but by day 7 all cover crop species appeared to be nearly completely killed. Most of the green cover by day 7 was due to the soybean seedlings. However, visual inspections four weeks after the spray treatments revealed some re-growth of the hairy vetch in the Weed Slayer® plots but not in the Round-Up plots. No grass regrowth was observed.
Figure 3. Percent green (living foliage) area seven days after herbicide treatments were sprayed on multi-species cover crop. Measurements shown are for the untracked middle rows (right) of the plot.
Weed Slayer® currently costs about $60/acre for the 1 x rate (purchased online in a package of 1 gallon of each part). This is expensive by conventional grain production standards, but feasible for organic grain which brings about twice the price per bushel as conventional. An affordable, effective organic-certified burn-down herbicide for grassy species (and some broadleaves) could open up important opportunities for no-till and cover cropping practices not currently practical in organic farming.
Sarah Everhart, Agriculture Law Legal Specialist University of Maryland, Agriculture Law Education Initiative
This is not a substitute for legal advice. Reposted from the Ag Risk Management Blog
The Cover Crop Program is the Maryland Department of Agriculture’s largest and most popular cost-share program. During the 2017-2018 planting season, Maryland farmers planted 395,862 acres of cover crops statewide using $18.8 million in Maryland Agricultural Cost-Share (MACS). Due to COVID-19, the enrollment for the 2020-2021 Cover Crop Program will be conducted entirely by mail. Farmers who participated in last year’s cover crop program should have been mailed an application, instructions, and a return envelope. Completed applications must be mailed to the local soil conservation district and postmarked between July 1, 2020 and July 17, 2020.
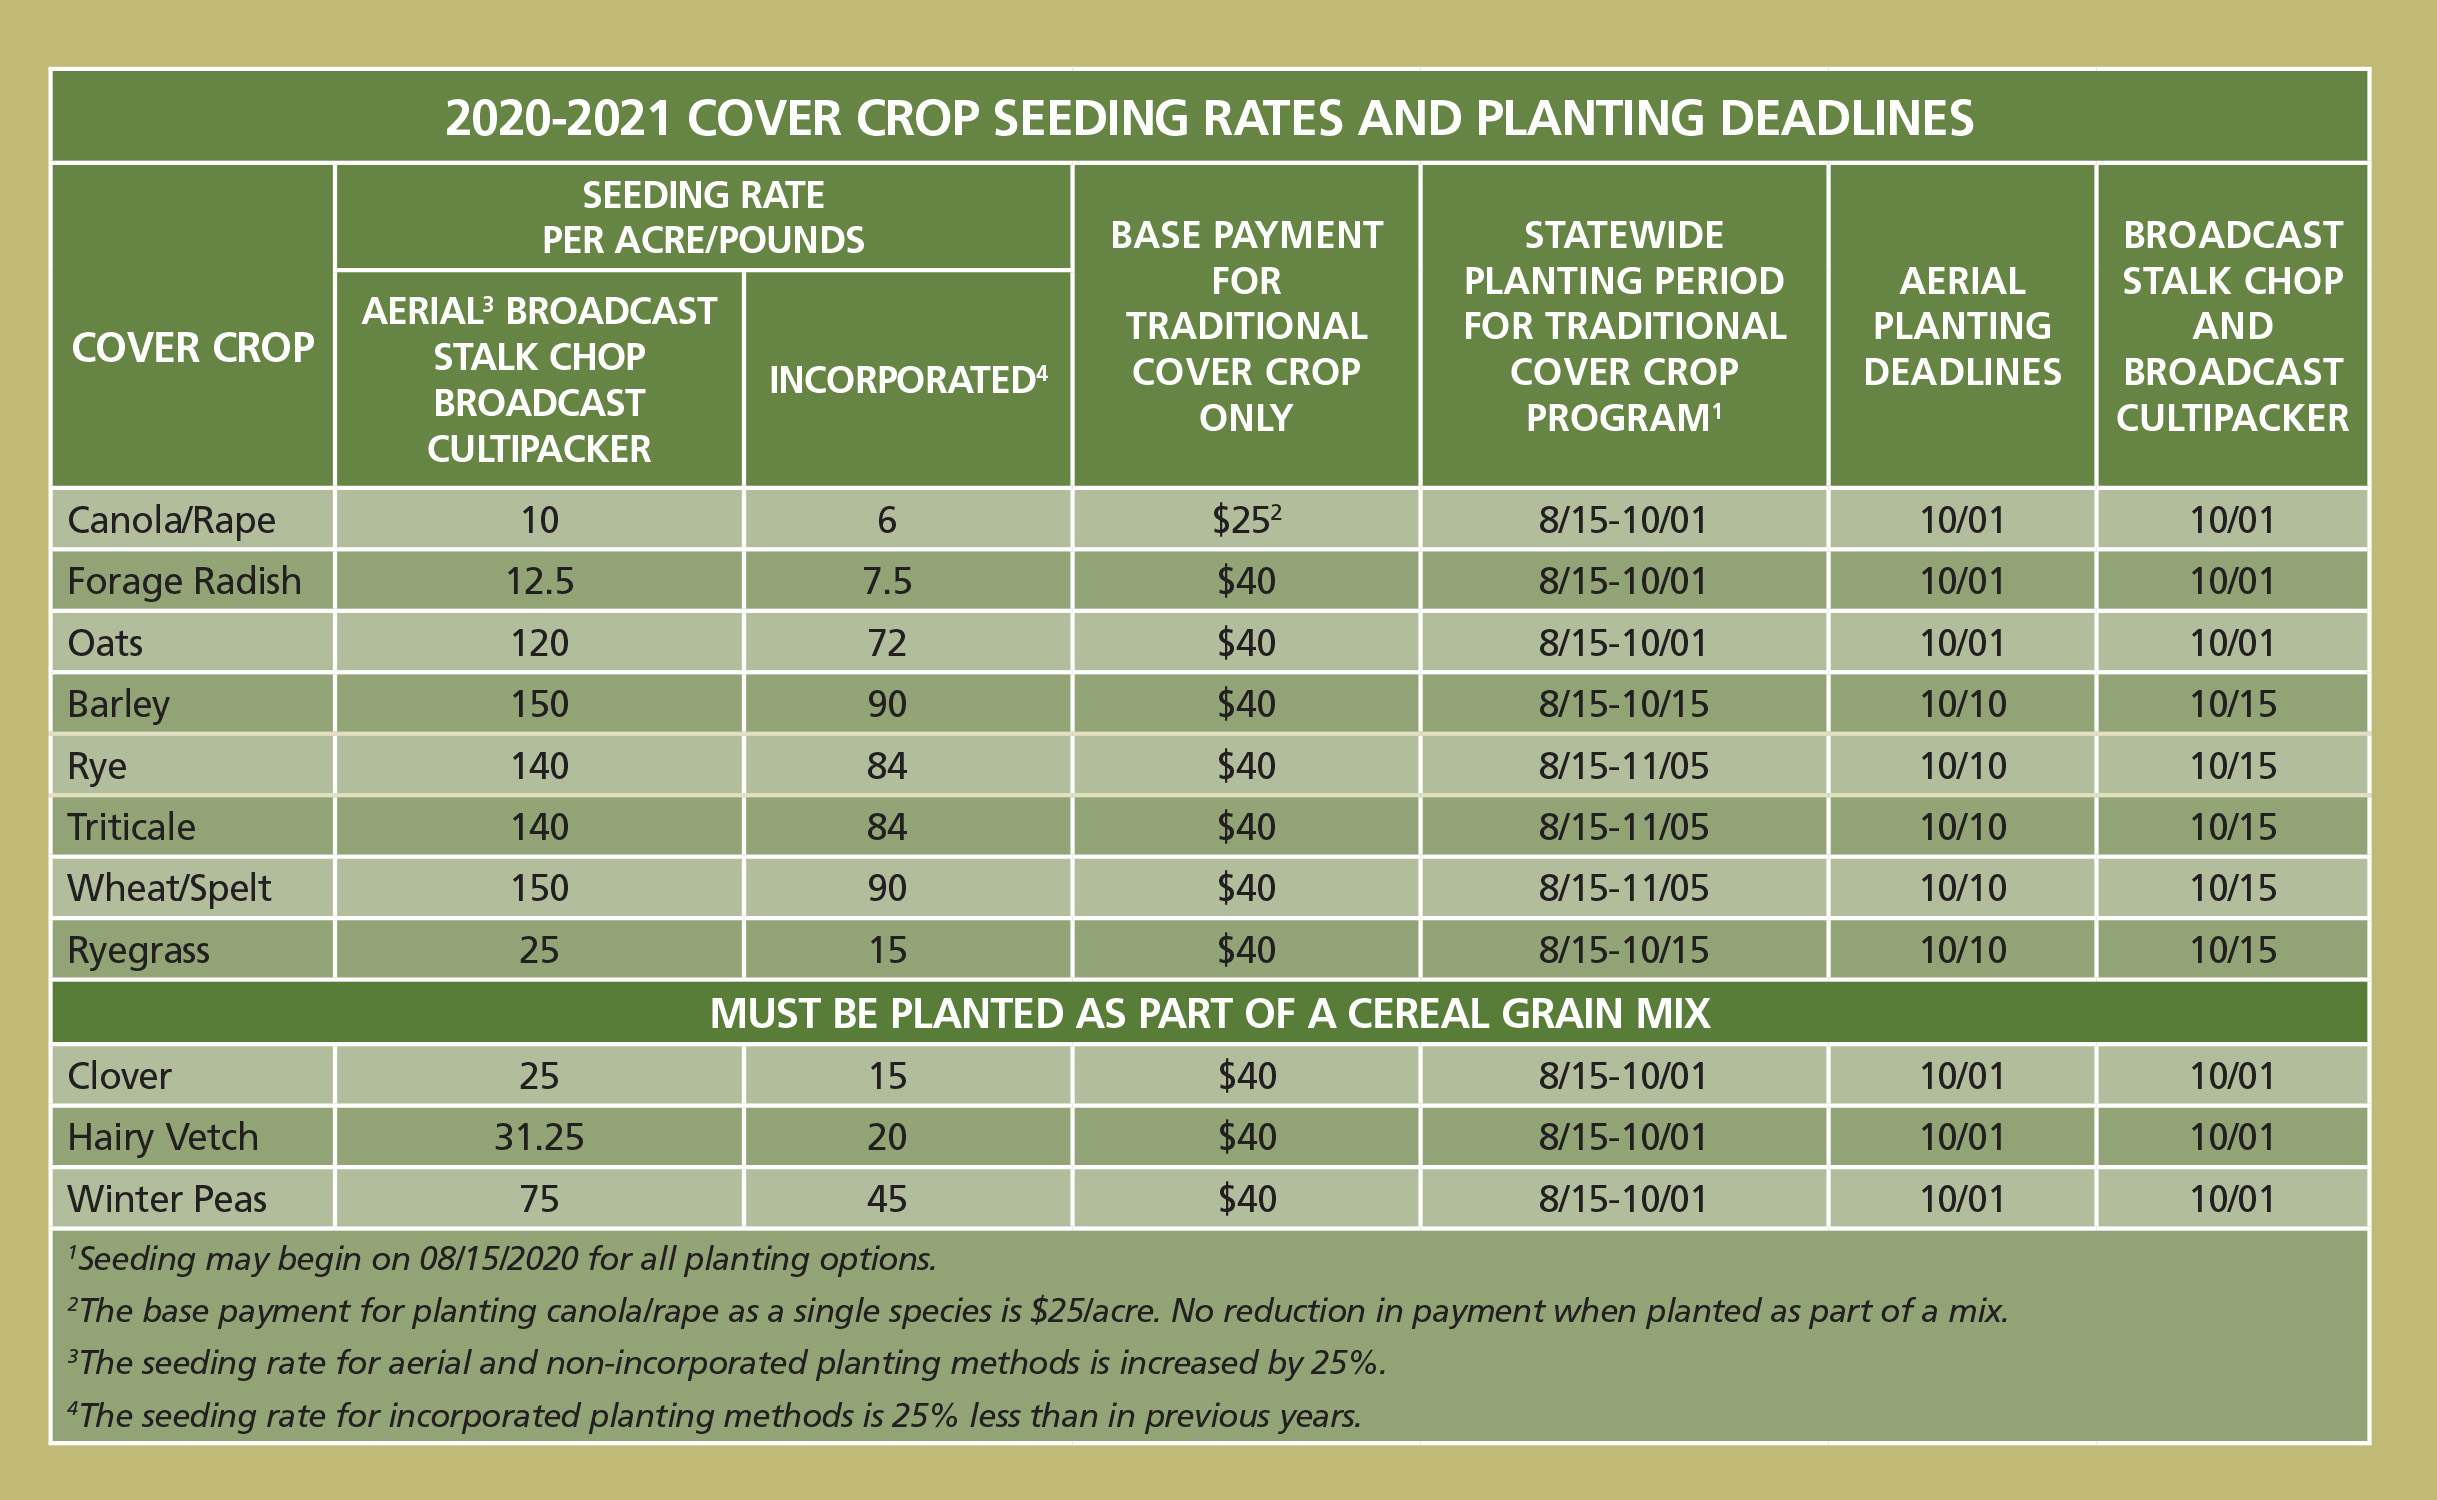
The 2020-2021 base payment is $40/acre and the base rate for aerial/aerial ground seeding is $45/acre. Farmers who aerial seed or aerial ground seed cover crops into standing corn on or before September 10, 2020 are eligible for a $10/acre incentive payment. There is also an available $10/acre early planting incentive for incorporated seed. If a farmer is able to wait until after May 1, 2021 to terminate cover crops, he/she may also be eligible for an extended season incentive payment of up to $10/acre. The maximum payment amount for the Program is $60.00/acre. Check out this chart for the 2020-2021 seeding rates and planting deadlines.
This year there are some key differences to the Program. To highlight a few, this year there are no incentive payments to plant rye. There is also only one early planting incentive in October (planting by October 10) rather than the two early planting incentives that were offered last year. Additionally, cover crops may be planted after corn, soybeans, sorghum, tobacco, vegetables, hemp, and millet.
In order to participate in the 2020-2021 Program, the applicant must be in good standing with MACS and in compliance with Maryland’s nutrient management regulations. A current Nutrient Management Plan Certification is also required and must be submitted with the application. For more information on the Program, check out this MDA webpage. Farmers who have questions or need assistance with their applications can contact their local soil conservation districts.
Farmer insights are now being sought for the sixth nationwide cover crop survey by SARE, the Conservation Technology Information Center (CTIC) and the American Seed Trade Association (ASTA). The online questionnaire is now open at https://bit.ly/CCSurvey2020.
The survey takes about 10 to 15 minutes to complete. Participants who complete the survey can enter a drawing for Visa gift cards worth $100 and $200.
“Since 2012, the SARE/CTIC/ASTA Cover Crop Survey has provided very important perspective into why and how farmers use cover crops—or why some don’t—and has helped guide resources in research, communications and policy around cover crops,” said Mike Smith, project director for CTIC. “The Cover Crop Survey has been a key tool for farmer organizations, conservation and extension service personnel, seed companies and other agribusinesses, and it has even been cited in testimony to Congress. This is a great opportunity to hear farmers’ voices on cover crops.”
Smith noted that the survey seeks answers not just from long-time cover crop fans, but also from new users and farmers who have not planted cover crops at all.
“Past surveys have provided significant insights on progress being made with cover crops and barriers still to address,” said Rob Myers of the North Central Region SARE Program.
The seed industry is especially interested in cover cropping trends, noted Jane DeMarchi, ASTA’s vice president of government and regulatory affairs, “Use of cover crops is evolving quickly and ASTA members who supply cover crop seed are looking forward to gaining insights on how they can better serve their customers in the future,” DeMarchi said.
1,2Cara Peterson, 2Steven Mirsky, 1Kate Tully, 1,2Victoria Ackroyd 1Department of Plant Science and Landscape Architecture, University of Maryland 2United States Department of Agriculture, Agricultural Research Service, Beltsville
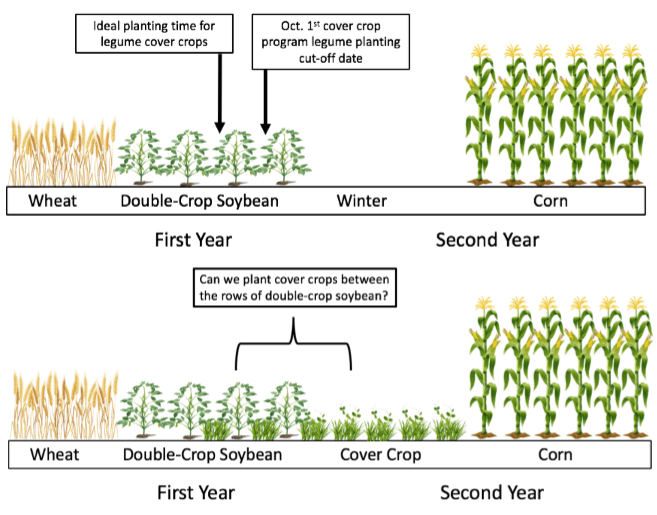
The mid-Atlantic region has the highest percentage of arable acreage in cover crops in the United States, with some reports placing Maryland and Delaware as the two states with the highest percentage of total cropland planted with cover crops (Wade et al., 2015; Hamilton et al., 2017). However, the majority of producers in the region are only using grass cover crops, since legumes require earlier planting dates in order to over-winter (Mirsky et al., 2011; Clark, 2012). Farmers in this region have success with legume cover crops when planting them after wheat harvest or frost-seeding in the spring. However, most mid-Atlantic crop rotations include double-crop soybeans planted after wheat, which limits opportunities for establishing a legume cover crop. Low legume adoption is particularly problematic as farmers could use this cover crop before corn to maximize the opportunity for nitrogen fixation benefits.
Figure 1. (Top) A typical mid-Atlantic crop rotation, with double-crop soybeans in the field at the pivotal points for establishing a successful legume cover crop. (Bottom) Proposed crop rotation scheme for interseeding a cover crop between 30-inch soybeans. The cover crop over-winters and is terminated before corn planting in the spring.
Some farmers interseed cover crops into growing cash crops to overcome this timing challenge. Current options for planting cover crops into standing corn and soybean include both aerial broadcasting via airplane and adapted high-boy sprayers. However, these two techniques often result in poor establishment due to low seed-to-soil contact and seed predation by rodents and birds (Hively et al., 2001; Baker and Griffis, 2009; Wilson et al., 2013).
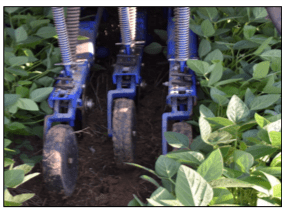
Figure 2. Interseeding cover crops with three planting units between 30-inch soybean rows.
To address the issue of planting cover crops into standing cash crops, our mid-Atlantic team ran numerous trials of an InterSeeder grain drill (InterSeeder Technologies, LLC; Fig. 2). Engineered by the Pennsylvania State University, this drill plants three rows of cover crops between 30-inch rows of standing cash crops. Field trials of this InterSeeder have been conducted in corn, as well as full-season soybeans, at various sites in the region with mixed results (Curran et al., 2018; Wallace et al. 2017). In Maryland, interseeding into full-season corn was moderately successful, whereas cover crops did not perform well in full season beans. However, exploratory research in Maryland identified wide-row double crop soybeans as a viable option for interseeding. The success of seeding grass-legume mixtures into 30-inch double-crop soybeans has led to an expanded on-station research program.
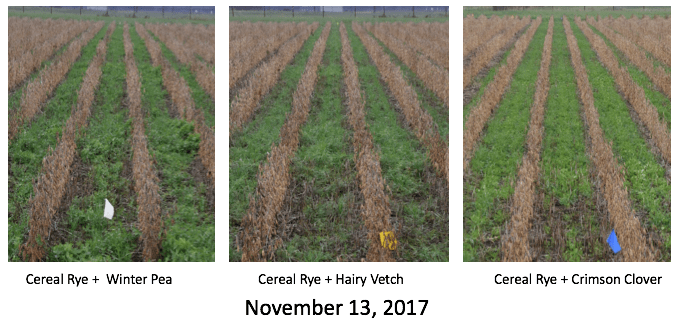
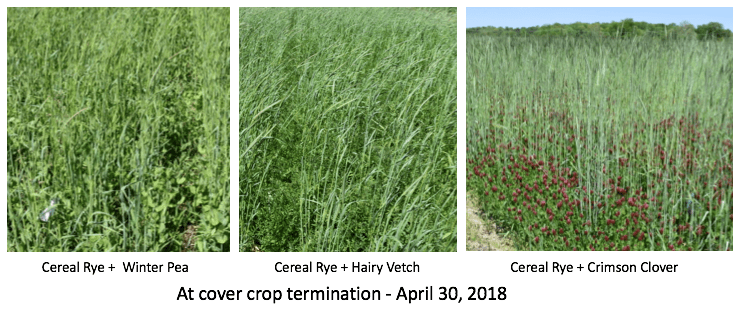
New Field Trials. Field trials with five different interseeded cover crop treatments were conducted to determine the optimal legume cover crop species to interseed in mixture with cereal rye and if interseeding a cover crop mixture affected wide-row double crop soybean yields. The five different cover crop treatments included: cereal rye alone, cereal rye independently mixed with four different legumes (hairy vetch, crimson clover, red clover, and winter pea), and a no cover crop control (Table 1).
Double-crop soybeans planted in June were then interseeded with the cover crop treatments in early September 2017 and late August 2018. The double-crop soybeans were harvested in November for 2017 and later in 2018 (December) due to wet field conditions. The interseeded cover crop treatments grew throughout the winter and were terminated with herbicides in April 2017 and 2018 before planting corn.
In an ideal interseeding scenario, the cover crop is planted as the double-crop soybeans are beginning to reach full canopy in early September. That way, the cover crops only have to survive a few weeks under the low light conditions of a soybean canopy until leaf drop. Once the soybean canopy is gone, the cover crops continue to grow but do not interfere with soybean harvest.
Insights from Interseeding Trials
Cereal rye + crimson clover produced the highest average cover crop biomass. The cereal rye + crimson clover fall 2017 seeding produced an average of 4,980 lbs per acre of biomass while the 2018 seeding produced 3,950 lbs per acre by the spring of 2019. Cereal rye + hairy vetch and cereal rye + winter pea reached similar levels of biomass in two out of the three field sites where the cover crops survived under the soybean canopy.
Interseeding did not decrease yield. There was no pattern of soybean yield differences between the 30-inch wide row double-crop soybeans that had or hadn’t been interseeded. Likewise, there were very minimal differences in soybean yields between the cover crop treatments.
Interseeding did not affect soybean grain quality. Green cover crop plant material was not found in any soybean grain subsampling. Moisture levels remained consistent, with very slight variance across the field as expected in a normal cropping system.
Row orientation matters. Out of the five trial sites, two of the cover crop plantings did not survive under the soybean canopy. Interestingly, the three field sites with strong cover crop survival rates had rows oriented in roughly the same direction: East-West or Southeast-Northwest. The two field sites where the cover crops sprouted but did not survive under the soybean canopy in the fall were on a perpendicular row orientation of Northeast-Southwest.
Row Spacing Considerations. The InterSeeder requires a 30-inch row spacing, while most double-crop soybean fields are planted in narrower rows of 15 inches or less. To account for the differing production practices, these field trials also included simple yield comparisons of 30- and 15-inch row double-crop soybeans. In the row spacing (15- vs 30-inches) trial, results were mixed. There was a yield penalty for wide row spacing in 2017, but not in 2018.
While the benefits of narrow row spacing have been well documented in full season beans, less is known about the potential advantages in double crop soybeans. We speculate that optimal production years enhance the effect of row spacing. For example, 2017 was a better soybean year compared to 2018 across the mid-Atlantic region. Higher levels of precipitation in 2018 than 2017 could have damaged yields. Previous research indicates that in lower yield years or for late-planted soybeans, the benefit of planting in 15 inch rows over 30 inch rows is lost (Alessi and Power, 1982; Hodges et al., 1983; Boquet, 1990; Weaver et al., 1990, Oplinger et al., 1992; Pederson and Lauer, 2003, Whaley et al., 2015).
Future Research. Nitrogen content analysis of the interseeded cover crop biomass is currently underway. Next, the research team will analyze how the following year’s corn crop responded to the interseeded cover crop mixtures.
References
Alessi, J., and J.F. Power. 1982. Effects of plant and row spacing on dryland soybean yield and water-use efficiency. Agronomy Journal 74:851–854. D.o.i.:10.2134/agronj1982.00021962007400050019x
Baker, J. M., and T. J. Griffis. 2009. Evaluating the potential use of winter cover crops in corn-soybean systems for sustainable co-production of food and fuel. Agricultural and Forest Meteorology, 149(12), 2120–2132. D.o.i.:10.1016 j.agrformet.2009.05.017
Boquet, D. J. 1990. Plant population density and row spacing effects on soybean at post-optimal planting dates. Agronomy. J.: 59–64. D.o.i:10.2134/agronj2009.0219.
Clark, A. (Ed.). 2012. Managing cover crops profitably (Third ed.). College Park, MD: Sustainable Agriculture Research and Education.
Curran, W.S., R.J. Hoover, S.B. Mirsky, G.W. Roth, M.R. Ryan, V.J. Ackroyd, J.M. Wallace, M.A. Dempsey and C.J. Pelzer. 2018. Evaluation of cover crops drill interseeded into corn across the mid-Atlantic region. Agronomy Journal 110, 435–443. D.o.i.:10.2134/agronj2017.07.0395
Fisher, K. A., B. Momen,, and R.J. Kratochvil. 2011. Is broadcasting seed an effective winter cover crop planting method? Agronomy Journal, 103(2), 472–478. D.o.i.:10.2134/agronj2010.0318
Hively, W.D. and W.J. Cox. 2001. Interseeding cover crops into soybean and subsequent corn yields. Agronomy. J. 93:308-313. D.o.i.:10.2134/agronj2001.932308x
Hodges, H.F., F.D. Whisler, N.W. Buehrig, R.E. Coast, J. Mcmillian, N.C. Edwards, and C. Hovermale. 1984. The Effect of Planting Date Row Spacing and Variety on Soybean Yield in Mississippi (Bulletin 912). Report prepared for the Mississippi Agricultural and Forestry Experiment Station.
Hamilton, A. V., D.A. Mortensen and M.K. Allen. 2017. The state of the cover crop nation and how to set realistic future goals for the popular conservation practice. Journal of Soil and Water Conservation. 72(5), 111-115A. DOI: 10.2489/jswc.72.5.111A
Mirsky, S.B., W.S. Curran, D.A. Mortensen, D.L. Shumway, and M.R. Ryan. 2011. Timing of cover crop management effects on weed suppression in no-till planted soybean using a roller-crimper. Weed Science 59:380–389
Oplinger, E.S. and B.D. Philbrook. 1992. Soybean planting date, row width, and seeding rate response in three tillage systems. Journal of Production Agriculture. 5: 94-99. DOI:10.2134/jpa1992.0094
Pedersen, P. and J.G. Lauer. 2004. Soybean growth and development response to rotation sequence and tillage system. Agronomy Journal 96(4), 1005–1012. D.o.i.:10.2134/agronj2004.1005
Wade, T., R. Claassen and S. Wallander. 2015. Conservation-Practice Adoption Rates Vary Widely by Crop and Region, EIB-147, U.S. Department of Agriculture, Economic Research Service. Available at https://www.ers.usda.gov/webdocs/publications/44027/56332_eib147.pdf?v=42403
Wallace, J.M., W. S. Curran, S. B. Mirsky, M.R. Ryan. 2017. Tolerance of interseeded annual ryegrass and red clover cover crops to residual herbicides in mid-Atlantic corn cropping systems,” Weed Technology, 31(5), 641-650.
Weaver, D.B., R.L. Akridge, and C.A. Thomas, C.A. 1991. Growth habit, planting date, and row-spacing effects on late-planted soybean. Crop Science (31) 805-810
Whaley, C., J. Adkins and P. Sylvester. 2015. Final report to Delaware soybean board: Evaluating the response of full season and double-cropped soybeans in narrow and wide rows to various soil moisture levels.
Wilson, M. L., J.M. Baker, and D.L. Allan. 2013. Factors affecting successful establishment of aerially seeded winter rye. Agronomy Journal, 105(6), 1868–1877.
Nicole Fiorellino, Extension Agronomist University of Maryland
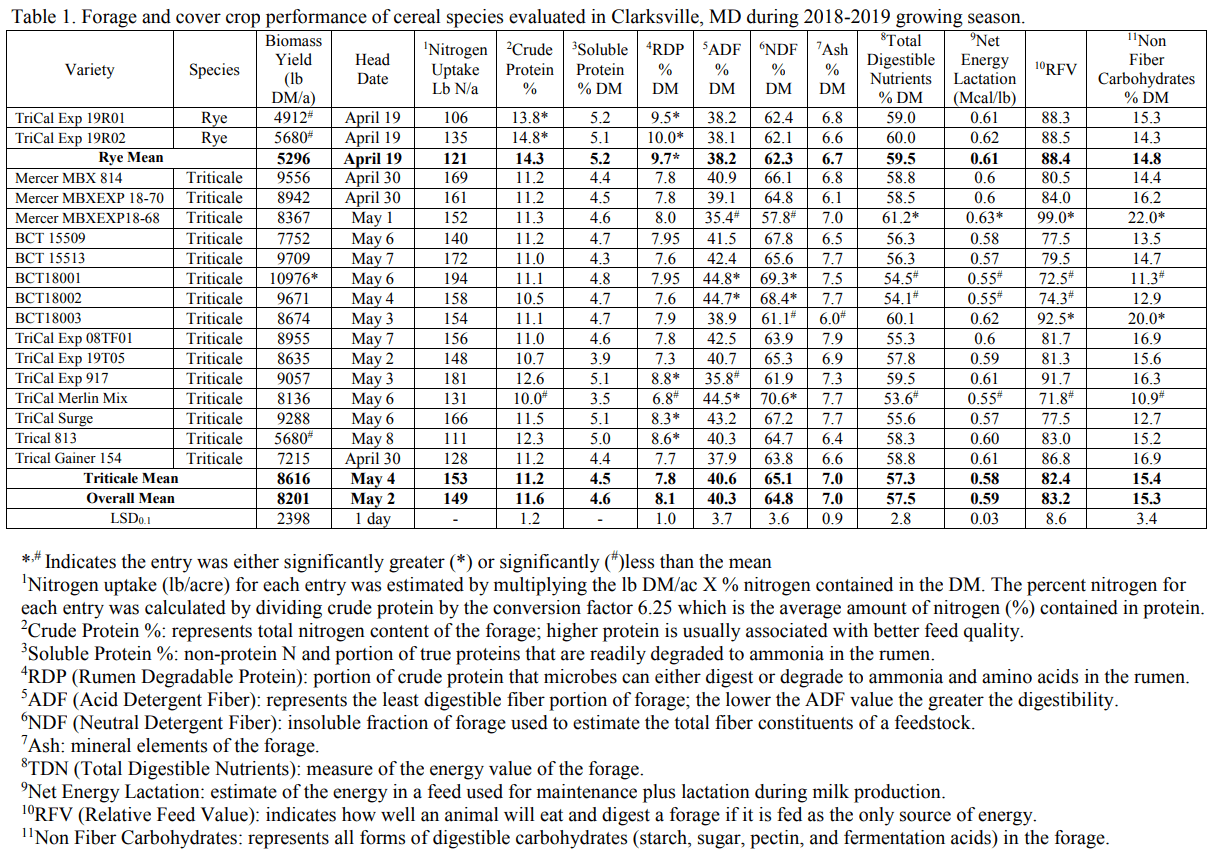
Dairy farmers are constantly looking for sources of forage to meet their feed needs. One source that many of this region’s dairy farmers utilize is the fall planting of cereal grains that are green-chop harvested the following spring. Among the cereal species used for this purpose are rye, triticale, barley, and wheat. Per the Maryland Cover Crop Program guidelines, cereal grains planted as a cover crop prior to November 5 and suppressed via green-chop in the spring are eligible for the grant payment for participation in the Cover Crop Program. In addition, per the Nutrient Management Regulations, a fall application of dairy manure is allowed to a field planted to a cereal cover crop.
Planting a cereal cover crop that will be green chop harvested fits well into the crop rotation used by many dairy farmers. The scenario that many follow is to plant the cereal cover crop following harvest of corn silage. Prior to planting the cover crop, an application of manure is made to the field. The subsequent planting of the cover crop provides incorporation of the manure into the soil. The fall and spring growth of the cover crop is supplied nutrients from the manure. At the same time, the cover crop provides protection to the soil from loss of nutrients via leaching and/or erosion. The objective of this study was to evaluate select varieties of cereal species for cover crop performance and forage production and quality.
Cereal varieties (17) representing two species (rye and triticale) were evaluated at Central Maryland Research and Education Center – Clarksville Facility. Three replications for each entry were planted using a randomized complete block experimental design. Planting date was October 10, 2018. The 3’ X 18’ plots were planted with a small plot planter with 6-inch spacing between each of the 7 rows. The germination percentage for each entry was used to calculate the seeding rate needed to establish 1.5 million seedlings. Good stands were established by late fall.
In order to compare forage quality among the entries that headed over a period of two weeks, the timing of the spring biomass harvest was when the entries had reached late boot to early heading stage of development. The two rye varieties were harvested on April 23, while the triticale varieties were harvest on either May 1 or May 6, basing on heading date (Table 1). Each harvest sample was collected by cutting the plants just above ground-level from three center rows of each plot from an area 2.5 feet in length and from two areas within the plot. The samples were placed into cloth bags and dried using a forced air dryer set at 60 C where they remained until sample water content was zero. Each sample was weighed and is reported as pounds of dry matter production per acre (Table 1). Each of the dried samples was ground through a 20-mesh screen using a large plant grinder. For each location, the ground biomass samples were sent to Cumberland Valley Analytical Laboratory for standard forage quality analysis.
Cover crop performance is measured by amount of biomass produced and the concentration of nitrogen in the biomass. These two factors were used to estimate nitrogen uptake (Table 1). There was no significant difference in nitrogen uptake among the varieties tested. A number of forage quality characteristics for these cereals was measured (Table 1). The descriptions of the various quality characteristic are described here and in the footnotes at the bottom of Table 1. Crude protein (CP) is the nitrogen content of the forage, with higher protein representing better feed quality. This value was used to calculate nitrogen uptake of each variety (Nitrogen content = % CP/6.25). Both rye varieties had significantly greater CP than the overall mean, with one triticale variety having significantly less CP content than the overall mean. Both rye varieties also had rumen degradable protein (RDP) content significantly greater than the overall mean.
Neutral and acid detergent fiber (NDF. ADF) are measures of feed value and represent the less digestible components of the plant, with NDF representing total fiber and ADF representing the least digestible plant components. Low NDF and ADF values representing increased digestibility; ideally NDF values should be <50% and ADF values should be <35%. One triticale variety had significantly lower NDF and ADF values than the overall mean, representing a digestible triticale variety. This same variety also had significantly higher total digestible nutrients (TD), net energy for lactation (NEL), relative feed value (RFV), and nonfiber carbohydrates (NFC).
The characteristic that best captures the overall forage quality performance is Relative Feed Value (RFV). A RFV of 100 is defined as the forage value that full bloom alfalfa would have. Two triticale varieties had significantly higher RFV than the overall average but both rye varieties also had high RFV values, though not significantly different than the overall mean. Though, none of these green-chop cereal forages are considered to be adequate as a stand-alone feed for a dairy operation, they can supply a source of forage used in a total mixed ration at the time of year when feed supply may be running short. When this forage benefit is added to the environmental benefit that is gained, planting winter cereal cover crops on a dairy farm can be a win-win decision.
Alan Leslie*, Armando Rosario-Lebron, Veronica L. Yurchak, Guihua Chen & Cerruti Hooks University of Maryland, Department of Entomology *University of Maryland Extension, Charles County
Farmers’ decisions about when and how to terminate their cover crops can enhance, decrease, or have no effect on weed establishment in the following crop. Winter cover crops are typically terminated with a burn-down herbicide during early to late spring, which also kills any germinated weeds before planting the cash crop. A residual herbicide is often included as a tank-mix to provide some protection from future weed germination. This practice provides weed suppression through cover cropping and herbicide usage. However, timing of cover crop termination can affect weed populations by influencing cover crop biomass and the amount of residue that remains on the soil surface.
Delaying cover crop termination has the potential to improve weed suppression through greater cover crop biomass accumulation. However, this delay can negatively affect the subsequent cash crop if the growing cover crops deplete soil moisture with increased evapotranspiration. As such, effects of cover crop termination date on weed management must take into account its impact on soil water availability. The Maryland Department of Agriculture’s cover crop program includes a new incentive for the 2019/2020 cover crop season called the Extended Season option. This new incentive encourages late termination by paying farmers an additional $15 per acre when they agree to terminate their cover crops after May 1. However, concerns about soil moisture and yield of the following soybean crop may keep some farmers from participating in this program.
Field experiments were conducted at two sites in Maryland in 2013 and 2014 to examine how varying the termination date and method of barley cover crop affects the weed community, soil moisture and yield in the following no-till soybean crop. This experiment compared four treatments: (1) early-kill with burn-down and residual herbicides (EK), (2) late- kill with burn-down and residual herbicides (LK), (3) late-kill with a flail mower and residual herbicides (FM), (4) and a fallow/bare-ground check with burn-down and residual herbicides (BG). Terminating the barley late or just prior to soybean planting resulted in significantly greater barley biomass accumulation in LK and FM than EK (Table 1).
Table 1. Mean cover crop or winter weed biomass at time of herbicide burn-down or flail mowing.
1EK = early kill, LK = late kill, FM = flail mow, BG = bare-ground. 2Different letters indicate statistically significant difference (P < 0.05).
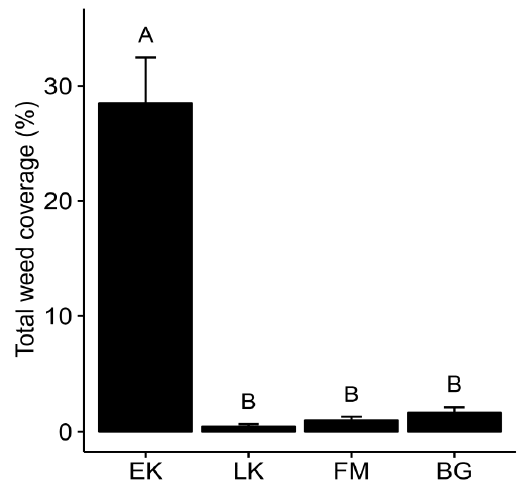
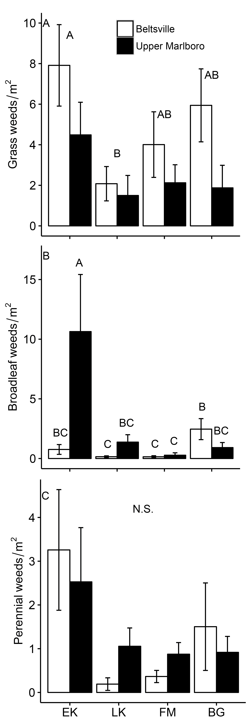
Weed density, soil coverage and species diversity were measured to determine effects of cover crop management tactics on weed suppression. Weed growth measurements were conducted after soybeans reached the early vegetative growth stage and continued until soybean canopy closure. Soil moisture was measured throughout the season at Beltsville using electrical resistance sensors to determine the effect of cover crop management on soil moisture dynamics. Soybeans were harvested using small plot combines. Weed composition, in terms of species and their relative abundances, was similar between study sites. There were 16 weed species identified at each site; the most abundant grass weeds at both sites were large crabgrass (Digitariasanguinalis) and goosegrass (Eleusine indica). The most abundant broadleaf weed at Beltsville was white clover (Trifolium repens), while white clover was second in abundance to carpetweed (Mollugo verticillata) in Upper Marlboro. The EK treatment had the greatest weed coverage (Fig. 1). In Upper Marlboro, total weed coverage was greater in EK than FM or LK treatments and more grass weeds were found in EK than LK plots (Fig. 2a). In Beltsville, BG had significantly more annual broadleaf weeds than FM or LK treatments (Fig. 2b). However, the number of perennial weeds was similar among treatments (Fig. 2c).
Figure 1. Mean percent weed coverage at Beltsville during 2013 and 2014. Different letters indicate significant differences between treatments.
Soil moisture levels fluctuated with rainfall events throughout the growing season, and appeared to show a response to increased water demand of soybean plants following canopy closure both years. There was no significant effect of treatment either before or after canopy closure on soil moisture either year. Similarly, soybean yields were similar among all treatments.
Figure 2. Mean weed counts from quadrat samples. Values are pooled across both years. Different letters indicate significant differences (P < 0.05) between treatments (A) or between treatment/site combinations (B).
In summary, the EK treatment had the lowest cover crop biomass and the highest weed pressure among treatments. However, increased biomass in LK and FM did not result in better weed suppression than the BG treatment, and there were no differences in weed pressure between LK and FM. Method and timing of termination had no significant effect on soil moisture or yield. Results from this experiment suggest that mechanically terminating a cover crop can be as effective as using a burn-down herbicide for managing weeds in a subsequent soybean crop if a residual herbicide is used, and that delaying cover crop termination or herbicide application until just prior to soybean planting can result in reduced weed pressure during the season.
Soybean farmers in Maryland generally kill their cover crop early partially out of concern that cover crops will dry out soils ahead of planting the next crop. During this experiment, there was no evidence of lower soil moisture or suppressive effects on soybean emergence, growth, or yield in cover crop treatments terminated late. From the perspective of weed management, these results encourage cover crop management strategies that delay termination until just prior to planting the soybean crop. As such, results from this study show that timing of cover crop termination is important for managing weeds and that in some instances mechanical termination of cover crops may substitute chemical termination without a loss in weed suppression benefits. Although this may not be true under all growing conditions, the best practice for weed management among methods tested during this study is using a combination of narrow row spacing and terminating the cover crop as late as possible, as this provides the best opportunity for preventing the need for further herbicide applications later in the season. Results of this study show that farmers can opt-in to the Maryland Department of Agriculture’s new Extended Season incentive without expecting negative impacts on soybean growth or yield.
We thank crews at the Upper Marlboro and Beltsville Research and Education Centers for logistics in establishing field trials. This work was supported by Hatch Project No. MD-ENTO-9107/project accession no. 227029 from the USDA National Institute of Food and Agriculture, Maryland Soybean Board and USDA NIFA EIPM number 2017-70006-27171.


