Maria Cramer, PhD Candidate and Kelly Hamby, Entomology Extension Specialist
Department of Entomology, University of Maryland
Background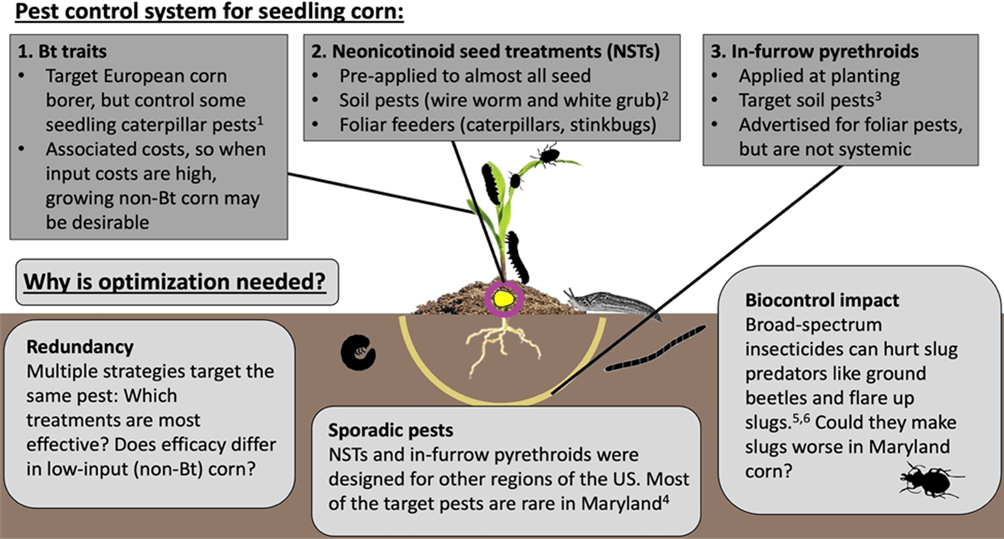
Research Questions
- Are the NST Poncho 250® and the in-furrow pyrethroid Capture LFR® effective at controlling pests and increasing yield in high-input (Bt) or low-input (non-Bt) field corn in Maryland?
- Do Poncho and Capture hurt slug predators and flare up slug damage?
Study Design
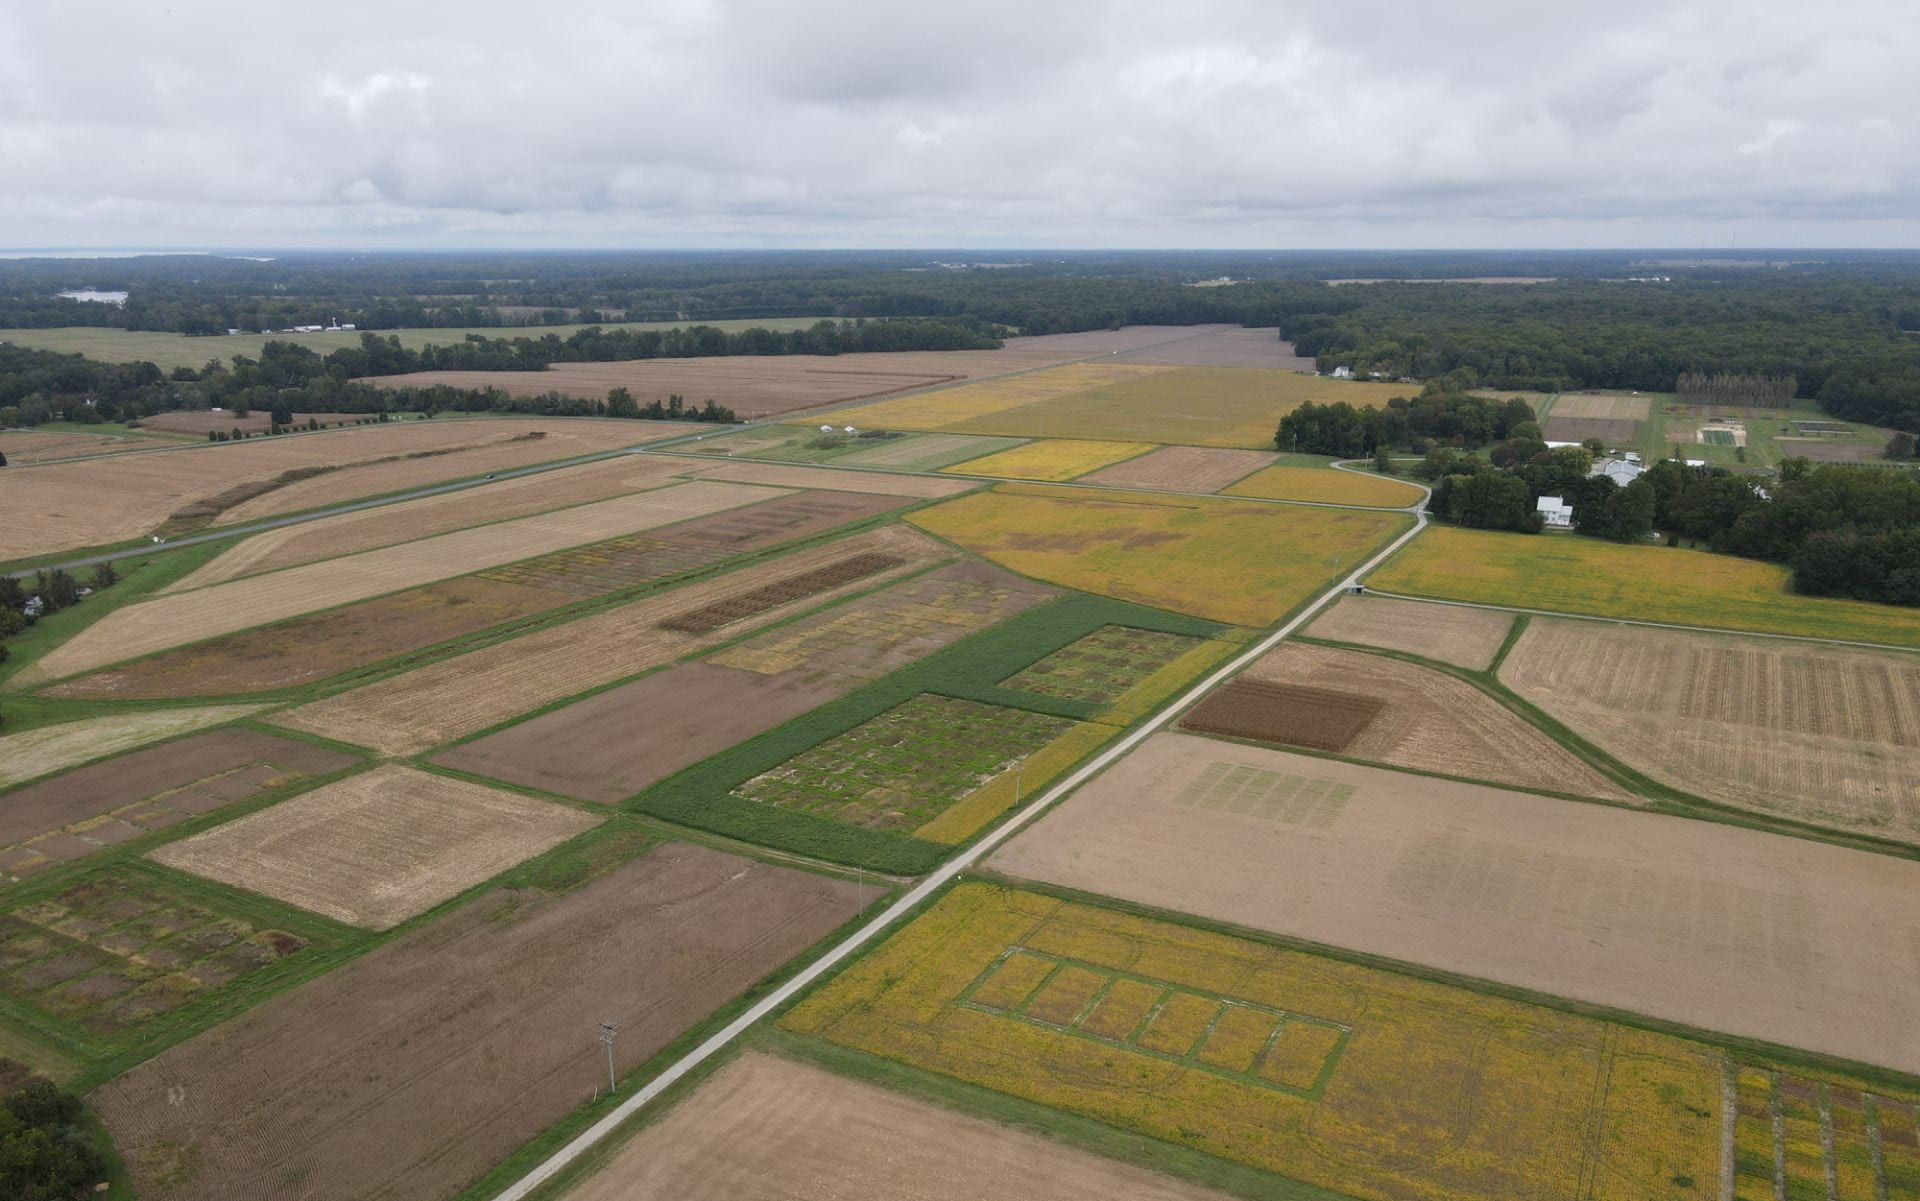
In order to capture the range of pest pressures and growing conditions in Maryland, we replicated our study across 3 UMD research farms (Keedysville, Beltsville, and Queenstown) and over 3 years (2020-2022). At each location we planted one field of a Bt hybrid and one field of a similarly-yielding non-Bt hybrid as early as possible in the growing season (Table 1). In 2020 our Bt hybrid was LC1196 VT2P (Local Seed, Memphis, TN) which expresses Cry1A.105/Cry2Ab2 proteins. In 2021 and 2022 we planted P1197YHR (Pioneer Hi-bred International. Johnston, IA) which contains Cry1Ab and Cry1F proteins. We planted P1197LR (Pioneer Hi-bred International, Inc. Johnston, IA) for our non-Bt hybrid all three years. All hybrids had excellent yield potential and were grown with standard no-till practices. In each field we established 3 replicates of 3 treatments at planting: 1) an untreated control, with bare seed and no in-furrow product, 2) an in-furrow pyrethroid treatment using Capture LFR® (active ingredient: bifenthrin, rate: 13.6 fl oz/acre), and 3) an NST treatment using Poncho® (active ingredient: clothianidin, rate: 0.25 mg/seed). Each replicate consisted of 24 rows of corn at 30 inch row spacing, and was 200 feet long.
| Year | Location | Planting date | Sampling dates |
| 2020 | Keedysville | May 18 | June 8 |
| Beltsville | May 21 | June 10 | |
| Queenstown | May 13 | June 3 and 4 | |
| 2021 | Keedysville | May 14 | June 1 and 3 |
| Beltsville | May 17 | June 2 | |
| Queenstown | May 4 | May 25 and 26 | |
| 2022 | Keedysville | May 26 | June 10 |
| Beltsville | June 2 | June 21 | |
| Queenstown | May 12 | May 31 |
Question 1: Are the NST Poncho 250® and the in-furrow pyrethroid Capture LFR® effective at controlling pests and increasing yield in high-input (Bt) or low-input (non-Bt) field corn in Maryland?
Data Collection
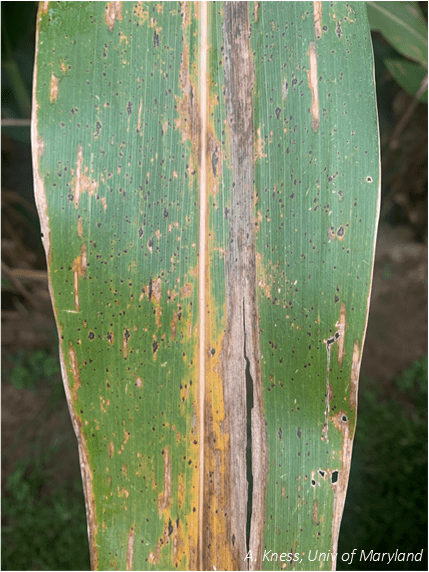
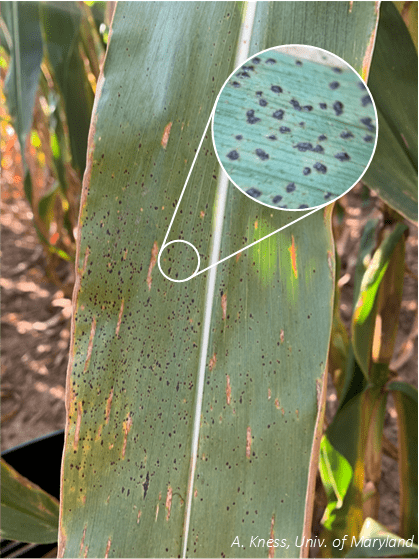
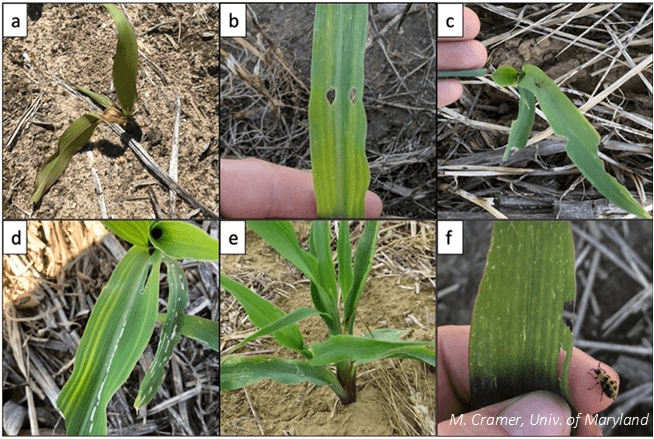
In order to evaluate how the treatments affected pest pressure, we visually sampled V2-V3 corn for types of pest damage (Figure 1), recording the number of plants and area damaged. We counted the number of healthy and stunted plants to determine if the treatments impacted stand. Because neonicotinoids can sometimes stimulate plant growth unrelated to pest damage7,8, we measured plant height to determine if plant growth was impacted by either treatment. At the end of the growing season, we measured stand again and harvested the corn to collect yield data.
Results and Takeaways for Question 1
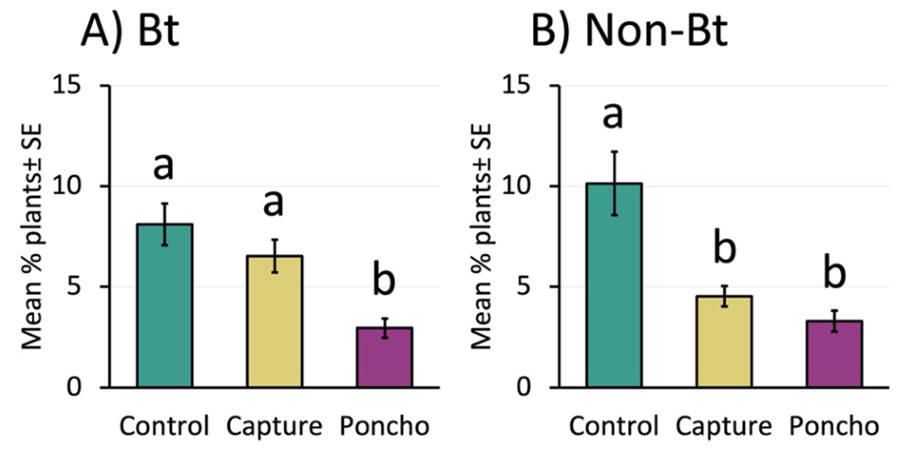
Poncho reduced insect damage more consistently than Capture LFR (in both Bt and non-Bt corn) and increased Bt corn stand. Capture LFR sometimes reduced insect damage (in non-Bt corn), but never improved stand.
We compared the number of seedlings with any type of pest damage between treatments and found that Poncho decreased damage about 62% in Bt corn and about 66% in non-Bt corn (Figure 2a and 2b). Compared to the control, Capture did not reduce damage in the Bt corn, but did reduce damage by about half in the non-Bt. Poncho increased stand about 8% compared to control in the Bt corn (25,731 ± 456 plants per acre and 23,623 ± 714 plants per acre, respectively), but did not improve it for non-Bt. Capture did not impact stand for either Bt or non-Bt corn.
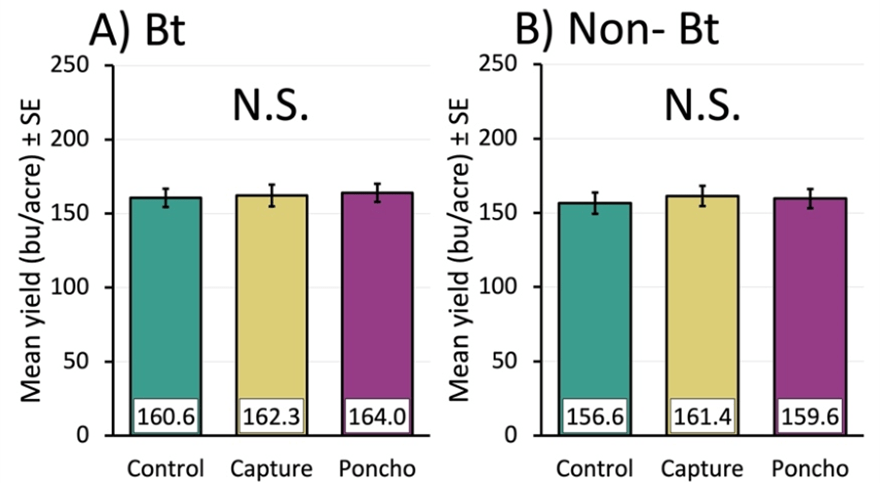
There were no yield benefits from using either insecticide in either corn. This was likely due to a lack of economic pest pressure.
Non-Bt and Bt yields were the same across treatments (Figure 3A and 3B). This was probably because pest pressure was so low. Even though Poncho and Capture decreased pest damage, pests were below treatment thresholds—for example, armyworm damage in the control ranged from 0% to 5.4% of Bt plants, and 0% to 22.9% of non-Bt plants, in both cases below the treatment threshold of 35%9. Cutworm damage was similarly low ranging from 1% to 6.3% in Bt control and 0.5% to 3.8% in non-Bt control, also below the treatment threshold of 10% feeding damage9.
Takeaway: Pest pressure and yield were similar between the Bt and non-Bt varieties, and non-Bt yielded well without any insecticides. In general, without pre-existing pest problems in a given field, at-planting insecticides are unlikely to pay off in Maryland.
Question 2: Do Poncho and Capture hurt slug predators and flare up slug damage?
Data Collection
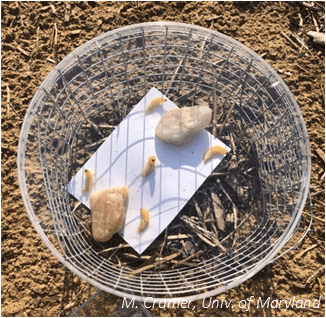
To assess the effect of treatments on slug biocontrol agents, we measured slug predatory ground beetles and predation. We measured predatory beetles with pitfall traps for three consecutive weeks. Because the predators that eat slugs also attack caterpillars, we used sentinel caterpillars to see how much predation was occurring (Figure 4). We placed sentinel caterpillars in the plots overnight, collected them the following morning, and assessed signs of damage from predators. To determine if slugs were flared up by the treatments, we measured slug abundance once a week for 6 weeks beginning between 14 to 21 days after planting and measured slug-damaged seedlings during V2-V3.
Results and Takeaways for Question 2
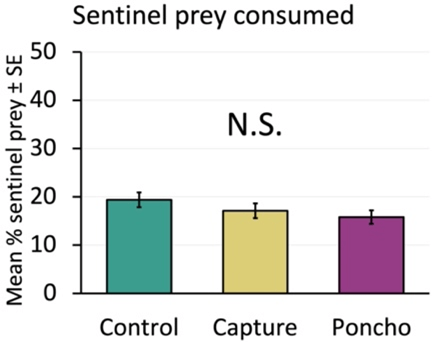
Predation on sentinel caterpillars was not decreased by insecticides.
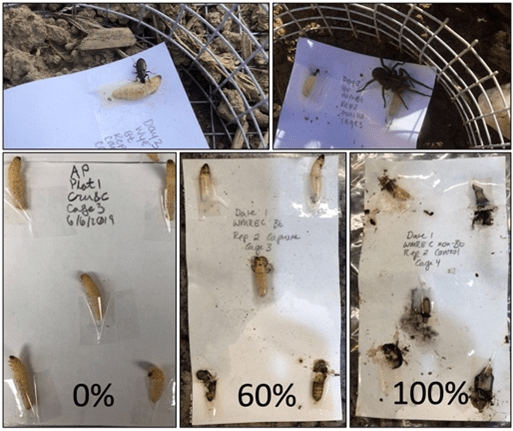
We measured the percent of sentinel prey that were damaged by predators overnight (Figure 5) and saw no relationship between treatment and predation rates (Figure 6). This suggests that the insecticides did not decrease predator activity in treated plots. We did generally see some level of predation all weeks at our locations, indicating that predators are usually present in seedling corn.
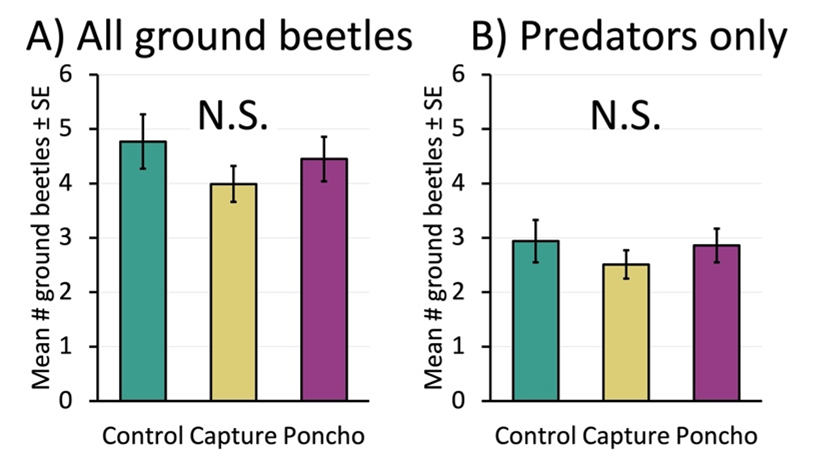
Predator abundance was not altered by insecticides.
When we measured the weekly counts of ground beetles, we found similar results between treatments. This was true when we looked at all ground beetles (predators, omnivores, and seed-eaters), as well as when we looked only at predatory beetles (Figure 7A and 7B).
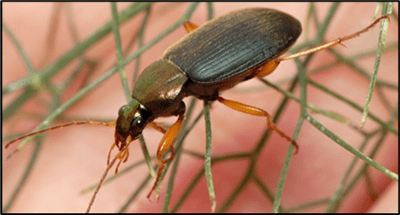
Slug natural enemies did occur throughout the study, suggesting that biocontrol could be more intentionally leveraged.
The two most abundant ground beetle species in our study were both predators. One of these species, Chlaenius tricolor (Figure 8) is a slug predator that consumes slugs in agricultural ecosystems5,10. Although its abundance was not affected by treatments, it was present at all locations in all years, suggesting that it is a particularly important slug natural enemy in Maryland crops.
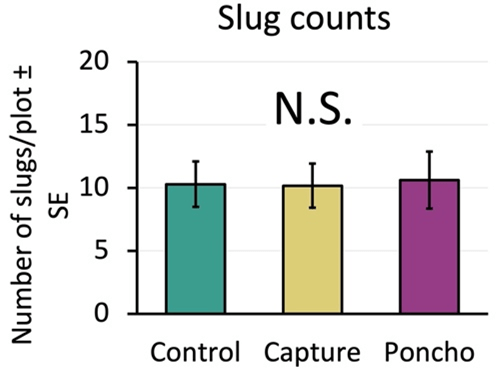
Neither insecticide increased slug abundance or slug damage.
If treatments had negatively affected predators, we would expect to see more slugs and damage in the insecticide plots. However, when we compared slug counts between treatments, we found that the insecticide treatments were not different from the control (Figure 9). Slug damage to the seedling corn was also similar across the control and insecticide treatments (Figure 10).
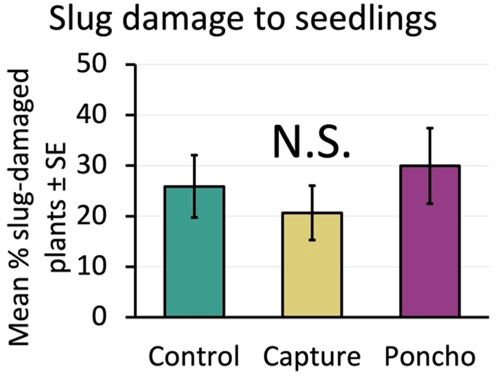
While slugs can be damaging in many crops, the worst slug damage in our study did not affect corn stand or yield, suggesting that corn is generally tolerant of slug damage at the levels we observed in this study.
Slug damage was scarce across years and locations except in 2021 at Keedysville. Even in that case where a high proportion of seedlings (42% ± 4% on average) were damaged by slugs, we did not see an associated decrease in stand or yield. Corn seedlings were able to outgrow the slug damage as the weather warmed, even when they appeared severely defoliated. The seedling resilience we observed is supported by work on hail damage in corn which shows that as long as the growing point is intact, corn can regrow from complete defoliation11.
Even though we did not see non-target effects in this study, both pyrethroids and neonicotinoids can decrease natural enemies in crop fields6,12–14.
Acknowledgments
We would like to thank the farm managers and staff of WYEREC, WMREC, and CMREC Beltsville for their expertise and assistance. We would also like to thank the Hamby lab’s many undergraduate researchers for helping complete this project with all their hard work.
Sources:
- Kullik, S. A., Sears, M. K. & Schaafsma, A. W. Sublethal Effects of Cry 1F Bt Corn and Clothianidin on Black Cutworm (Lepidoptera: Noctuidae) Larval Development. J. Econ. Entomol. 104, 484–493 (2011).
- North, J. H. et al. Value of neonicotinoid insecticide seed treatments in mid-south corn (Zea mays) production systems. J. Econ. Entomol. 111, 187–192 (2018).
- Reisig, D. & Goldsworthy, E. Efficacy of Insecticidal Seed Treatments and Bifenthrin In-Furrow for Annual White Grub, 2016. Arthropod Manag. Tests 43, 1–2 (2017).
- Sappington, T. W., Hesler, L. S., Clint Allen, K., Luttrell, R. G. & Papiernik, S. K. Prevalence of sporadic insect pests of seedling corn and factors affecting risk of infestation. J. Integr. Pest Manag. 9, (2018).
- Douglas, M. R., Rohr, J. R. & Tooker, J. F. Neonicotinoid insecticide travels through a soil food chain, disrupting biological control of non-target pests and decreasing soya bean yield. J. Appl. Ecol. 52, 250–260 (2015).
- Dubey, A., Lewis, M. T., Dively, G. P. & Hamby, K. A. Ecological impacts of pesticide seed treatments on arthropod communities in a grain crop rotation. J. Appl. Ecol. 57, 936–951 (2020).
- Ding, J. et al. Thiamethoxam, clothianidin, and imidacloprid seed treatments effectively control thrips on corn under field conditions. J. Insect Sci. 18, (2018).
- Preetha, G. & Stanley, J. Influence of neonicotinoid insecticides on the plant growth attributes of cotton and okra. J. Plant Nutr. 35, 1234–1245 (2012).
- Flessner, M. & Taylor, S. V. 2021 Field Crops Pest Management Guide. Virginia Cooperative Extension (2021) doi:10.1016/B978-0-12-394807-6.00031-9.
- Eskelson, M. J., Chapman, E. G., Archbold, D. D., Obrycki, J. J. & Harwood, J. D. Molecular identification of predation by carabid beetles on exotic and native slugs in a strawberry agroecosystem. Biol. Control 56, 245–253 (2011).
- Thomason, W. & Battaglia, M. Early defoliation effects on corn plant stands and grain yield. Agron. J. 5024–5032 (2020) doi:10.1002/agj2.20402.
- Disque, H. H., Hamby, K. A., Dubey, A., Taylor, C. & Dively, G. P. Effects of clothianidin-treated seed on the arthropod community in a mid-Atlantic no-till corn agroecosystem. Pest Manag. Sci. 75, 969–978 (2019).
- Bhatti, M. A. et al. Field Evaluation of the Impact of Corn Rootworm (Coleoptera: Chrysomelidae)–Protected <I>Bt</I> Corn on Foliage-Dwelling Arthropods. Environ. Entomol. 34, 1336–1345 (2006).
- Taravati, S., Mannion, C., McKenzie, C. & Osborne, L. Lethal and Sublethal Effects of Selected Systemic and Contact Insecticides on Nephaspis oculata (Coleoptera: Coccinellidae), in a Tri-Trophic System. J. Econ. Entomol. 112, 543–548 (2018).