Kurt Vollmer, Extension Weed Management Specialist | kvollmer@umd.edu University of Maryland Extension
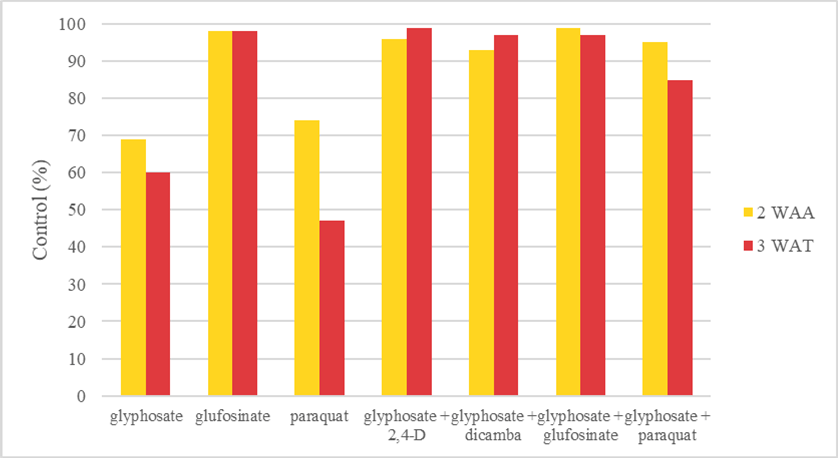
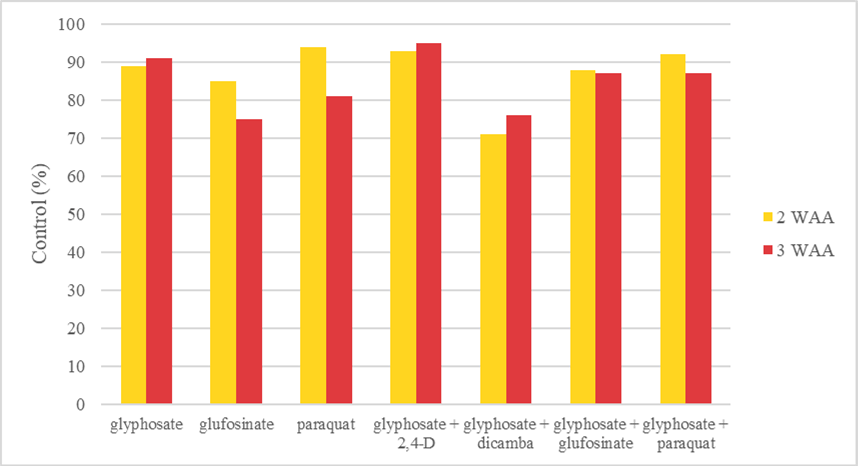
In last month’s issue of Agronomy News, I discussed considerations for glyphosate-based burndown programs. This month I wanted to share some of my results using similar programs to manage a rye (Fig. 1) and hairy vetch (Fig. 2) cover crop. Treatments were applied on April 11, and consisted of glyphosate, glufosinate, paraquat, glyphosate + 2,4-D, glyphosate + dicamba, glyphosate + glufosinate, and glyphosate + paraquat. Currently, this is what I am seeing:
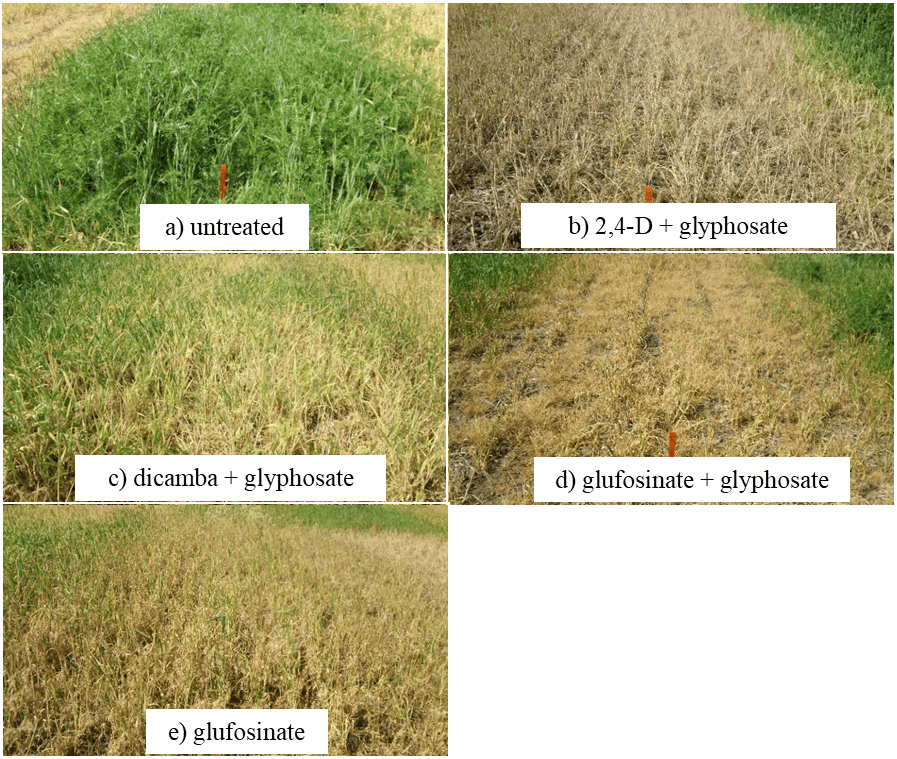
Glyphosate tank mixed with 2,4-D, dicamba, and glufosinate are doing an excellent job controlling hairy vetch, and glufosinate alone is providing similar control (Fig 3.);
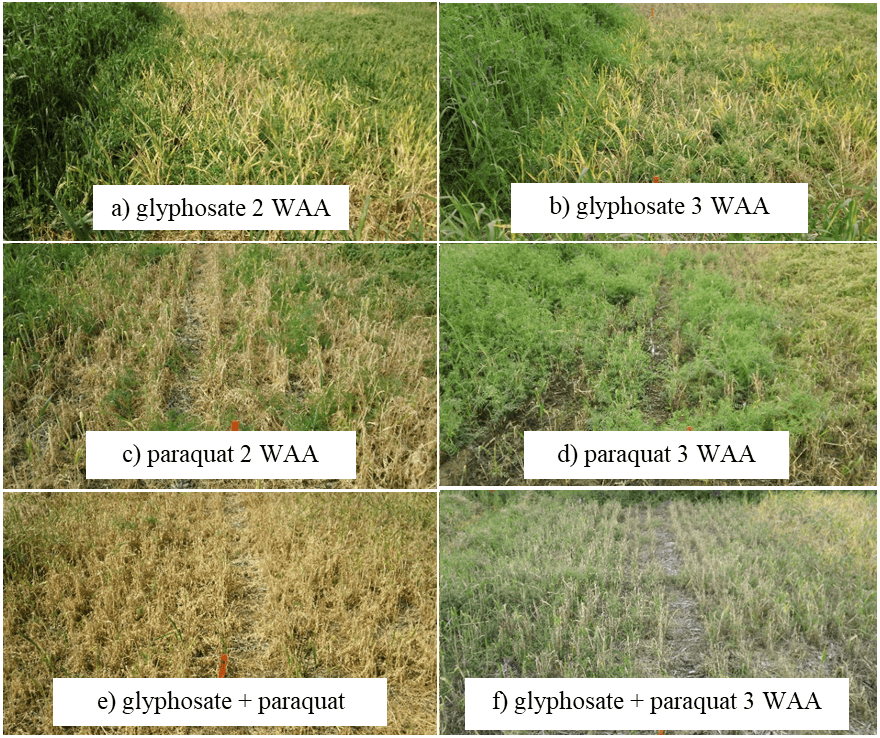
Vetch control appears to be declining with individual treatments of glyphosate and paraquat, as well as the mixture of the two (Fig. 4);
Glyphosate + 2,4-D is doing an excellent job controlling cereal rye (Fig. 3b), but control with glyphosate alone has improved (Figs. 4a, 4b).
Figure 1. Hairy vetch control 2 and 3 weeks after application (WAA).Figure 2. Cereal rye control 2 and 3 weeks after application (WAA). *Glyphosate containing treatments consisted of 20.5 fl. oz./A Roundup PowerMax3®; glufosinate containing treatments consisted of 43 fl. oz./a Liberty 280®, paraquat containing treatments consisted of 3 pt/A Gramoxone SL 2.0®, 2,4-D containing treatments consisted of 2 pt./A Enlist One®, and dicamba containing treatments consisted of 12.8 fl. oz./A Engenia® *Ammonium sulfate (8.5 lb./A) was included in all treatments except the glyphosate + dicamba treatment, nonionic surfactant (0.25% v/v) was included with 2,4-D and dicamba treatments, crop oil (1% v/v) was included with paraquat treatments. *Treatments were applied using Turbo Teejet 11002 nozzles at spray volume of 15 gal/A.
As previously discussed, the same herbicide program may not have the same desired effect on all species. Here are some things to remember.
There are certain species where control with glyphosate can be difficult, even if those species are not classified as being glyphosate-resistant. Additional trials from the Mid-Atlantic have also indicated lower vetch control with glyphosate alone (Figs. 4a, 4b) compared to glyphosate tank mixtures (Figs. 3b, 3c, 3d).
Group 4 herbicides such as 2,4-D and dicamba, will not control grasses. In addition, including dicamba in a tank mix with glyphosate has been shown to reduce glyphosate’s ability to control grasses (Fig. 3c).
Contact herbicides such as glufosinate and paraquat require good spray coverage for optimal control. If plants are too large, if spray volume is too low, or if nozzles do not provide adequate spray coverage, then plants can regrow (Figs. 4c, 4d).
Figure 3. Efficacy of preplant herbicides for managing a rye/vetch cover crop 2 weeks after applicationFigure 4. Differences in herbicide efficacy for managing a rye/vetch cover crop 2 and 3 weeks after application.
Dairy farmers are constantly looking for sources of forage to meet their feed needs. One source that many of our region’s dairy farmers utilize is the fall planting of cereal grains that are green-chop harvested the following spring. Among the cereal species used for this purpose are rye, triticale, barley, and wheat. Per the Maryland Cover Crop Program guidelines, cereal grains planted as a cover crop prior to November 5 and suppressed via green-chop in the spring are eligible for the grant payment for participation in the Cover Crop Program. In addition, per the Nutrient Management Regulations, a fall application of dairy manure is allowed to a field planted to a cereal cover crop.
Planting a cereal cover crop that will be green chop harvested fits well into the crop rotation used by many dairy farmers. The scenario that many follow is to plant the cereal cover crop following harvest of corn silage. Prior to planting the cover crop, an application of manure is made to the field. The subsequent planting of the cover crop provides incorporation of the manure into the soil. The fall and spring growth of the cover crop is supplied nutrients from the manure. At the same time, the cover crop provides protection to the soil from loss of nutrients via leaching and/or erosion. The objective of this study was to evaluate select varieties of cereal species for cover crop performance and forage production and quality.
Cereal varieties (26) representing three species (rye, triticale, wheat) were evaluated at Central Maryland Research and Education Center – Clarksville Facility. Three replications for each entry were planted using a randomized complete block experimental design. Planting date was November 5, 2020. Planting was delayed in 2020 due to multiple large rain events that kept equipment out of the field. The 3’ X 18’ plots were planted with a small plot planter with 6-inch spacing between each of the 7 rows. The germination percentage for each entry was used to calculate the seeding rate needed to establish 1.5 million seedlings. Good stands were established in most plots by late fall.
Our goal each year is to time spring biomass harvest with when entries reach late boot to early heading stage of development. We reached this growth stage from late April to mid May in 2021, with three harvest dates to capture the variation in maturity (April 20, May 4, May 14). Each harvest sample was collected by cutting the plants just above ground-level from three center rows of each plot from an area 2.5 feet in length and from two areas within the plot. The samples were placed into cloth bags and dried using a forced air dryer set at 60o C where they remained until sample water content was zero. Each sample was weighed and is reported as pounds of dry matter production per acre (Table 1). Each of the dried samples was ground through a 20-mesh screen using a large plant grinder and the ground biomass samples were sent to Cumberland Valley Analytical Laboratory for standard forage quality analysis.
Cover crop performance is measured by amount of biomass produced and the concentration of nitrogen (N) in the biomass. These two factors were used to estimate N uptake (Table 1). Despite late planting 2020, all varieties amassed good biomass during the growing season. Nitrogen uptake in 2021 was lower than in 2020, but still good, with only two varieties significantly different from the overall mean (one greater, one less). Several forage quality characteristics for these cereals were measured (Table 1). The descriptions of the various quality characteristics are described here and in the footnotes at the bottom of Table 1. Crude protein (CP) is the N content of the forage, with higher protein representing better feed quality. This value was used to calculate nitrogen uptake of each variety (Nitrogen content = % CP/6.25). Three rye varieties (Aroostook, TriCal Exp 19R01, and the check variety) had significantly greater CP than overall mean, with two triticale varieties (BCT 19004 and Hi Octane) having significantly less CP than the overall mean. Both Aroostook and TriCal Exp 19R01 also had soluble protein and rumen degradable protein (RDP) significantly greater than the overall mean.
Neutral and acid detergent fiber (NDF, ADF) are measures of feed value and represent the less digestible components of the plant, with NDF representing total fiber and ADF representing the least digestible plant components. Low NDF and ADF values representing increased digestibility; ideally NDF values should be <50% and ADF values should be <35%. Our plots were slightly more mature than ideal this year, with overall mean NDF of 60.2% and ADF of 36%. Despite this, one rye variety (KWS Propower) had ADF significantly less than the mean and both Aroostook and TriCal Exp 19R01 had ADF numerically less than 35%, although they likely would have ADF similar to the overall mean of 36%. Aroostook and TriCal Exp 19R01 also had total digestible nutrients (TDN), net energy for lactation (NEL) significantly greater than the overall mean, indicating good performing varieties. Some good performing wheat varieties included LW2068 and LW2958, which had lower ADF values, low NDF values, high TDN and NEL.
The characteristic that best captures the overall forage quality performance is Relative Feed Value (RFV). An RFV of 100 is defined as the forage value that full bloom alfalfa would have. Two triticale varieties (KWS Propower and Aroostook) had RFV significantly greater than the overall mean (95.0) and over 100. TriCal Exp 19R01 had RFV similar to the overall mean, but combined with the other forage quality factors indicate a good performing triticale variety. Three wheat varieties (LW2068, LW2958, Pioneer 25R25) had RFV significantly greater than the overall mean, and combined with other forage quality factors, indicate good performing wheat varieties.
Though none of these green-chop cereal forages are considered to be adequate as a stand-alone feed for a dairy operation, they can supply a source of forage used in a total mixed ration at the time of year when feed supply may be running short. When this forage benefit is added to the environmental benefit that is gained, planting winter cereal cover crops on a dairy farm can be a win-win decision.
Acknowledgements
This work could not be accomplished without the assistance and oversight of all field operations by Mr. Louis Thorne and Mr. Joseph Crank. We acknowledge the assistance of Ms. Shana Burke with seed packaging and harvested sample drying and weighing.
Table 1. Forage and cover crop performance of cereal species evaluated in Clarksville, MD during 2020-2021 growing season.
Variety
Species
Brand
Biomass Yield
lb DM/a
Head
Date
1Nitrogen
Uptake
lb N/a
2Crude
Protein %
3Soluble Protein
% DM
4RDP
% DM
5ADF
% DM
6NDF
% DM
7Ash
% DM
8Total
Digestible
Nutrients
% DM
9Net
Energy
Lactation
(Mcal/lb)
10RFV
Wheeler
Rye
TriCal
13241
May 9
266*
12.5
6.0
9.3
38.5
60.7
6.2
60.1
0.61
90.0
Hazlet
Rye
TriCal
10736
May 6
202
11.5
4.9
8.2
36.4
61.3
6.8
60.1
0.61
92.2
KWS Propower
Rye
TriCal
9412
May 9
182
12.5
6.9*
9.7*
32.2
57.5
6.5
62.8*
0.64*
104.2*
Aroostook
Rye
TriCal
8117#
April 25
211
16.7*
7.0*
11.9*
34.7
55.4
8.6*
62.1
0.63
104.5*
TriCal Exp 19R01
Rye
TriCal
8251
April 25
197
14.8*
6.8*
10.8*
34.2
57.4
7.3
62.0
0.63
101.0
Rye VNS
Rye
check
10065
May 4
240
15.1*
5.5
10.3*
35.4
55.8
7.9*
61.8
0.63
102.5
Rye Mean
9970
May 3
216
13.9
6.2
10.0
35.2
58.0
7.2
61.5
0.63
99.1
TriCal Gunner
Triticale
TriCal
11936
May 14
176
9.2
4.2
6.7
39.1*
63.6*
7.2
58.2
0.59
85.7
TriCal Exp 20T02
Triticale
TriCal
12531
May 14
186
9.3
3.1
6.2
37.2
62.1
6.1
59.4
0.60
90.0
TriCal Flex 719
Triticale
TriCal
12329
May 14
205
10.4
5.4
7.9
41.7*
65.8*
7.0
56.2
0.57
80.0
TriCal Merlin Max
Triticale
TriCal
14641*
May 14
233
9.9
5.7
7.8
41.4*
65.5*
6.4
56.0
0.57
81.0
TriCal Surge
Triticale
TriCal
10535
May 14
188
11.1
5.1
8.1
37.0
61.0
6.9
57.9
0.59
92.0
TriCal Gainer 154
Triticale
TriCal
10458
May 6
176
10.4
4.2
7.3
32.7
58.0
6.9
61.8
0.63
101.7
TriCal Thor
Triticale
TriCal
12646
May 14
196
9.7
4.8
7.2
39.9*
64.6*
6.8
57.8
0.59
84.0
BCT18001
Triticale
SeedLink
8817
May 6
172
12.4
4.6
8.5
33.0
55.6
7.3
63.6*
0.65*
106.0*
BCT18002
Triticale
SeedLink
11878
May 14
186
9.9
5.3
7.6
38.3
64.5*
7.1
56.6
0.57
85.5
BCT19003
Triticale
SeedLink
13001
May 14
204
9.8
3.5
6.6
36.3
61.5
5.5
60.1
0.61
92.0
BCT19004
Triticale
SeedLink
15064*
May 14
208
8.6
3.7
6.1
42.6*
67.6*
5.5
55.9
0.57
77.0
BCT19005
Triticale
SeedLink
12406
May 14
209
10.7
5.5
8.1
35.5
61.9
5.9
60.2
0.61
92.2
BCT19007
Triticale
SeedLink
13500
May 14
199
9.2
3.3
6.2
37.4
62.7
6.9
58.3
0.59
88.7
MBX Tri-Cow Arcia
Triticale
Eddie Mercer
11849
May 6
242
12.8
5.6
9.2
35.7
60.8
7.4
60.5
0.62
93.5
Hi Octane
Triticale
check
10957
May 14
139
8.1
4.1
6.1
40.2*
63.5
6.5
57.0
0.58
85.2
Triticale Mean
12170
May 12
195
10.1
4.5
7.3
37.9
62.6
6.6
58.6
0.60
89.0
LW2169
Wheat
Local Seed
10554
May 14
172
10.2
4.7
7.5
33.9
58.6
5.2
61.9
0.63
99.3
LW2148
Wheat
Local Seed
10410
May 14
180
10.8
5.1
8.0
32.0
56.7
6.0
61.3
0.63
105.5*
LW2068
Wheat
Local Seed
12300
May 14
205
10.4
5.8
8.1
30.7
54.4
5.7
63.2*
0.65*
111.5*
LW2958
Wheat
Local Seed
10679
May 14
172
10.2
4.7
7.4
30.1
45.6
5.8
63.8*
0.66*
111.2*
P25R25
Wheat
check
11274
May 14
177
9.8
4.8
7.3
30.0
53.3
5.8
64.1
0.66*
115.0*
Wheat Mean
11069
May 14
182
10.3
5.0
7.7
31.2
55.4
5.7
62.9
0.64
109.0
Overall Mean
11454
May 10
197
11.0
5.0
8.0
36.0
60.2
6.6
60.1
0.61
95.0
LSD0.1
2257
<1 day
47
1.9
1.8
1.6
3.1
3.4
1.1
2.4
0.03
8.8
*,# Indicates the entry was either significantly greater (*) or significantly (#) less than the overall mean for that feed characteristic.
1Nitrogen uptake (lb N/acre) for each entry was estimated by multiplying the lb DM/ac X % nitrogen contained in the DM. The percent nitrogen for each entry was calculated by dividing crude protein by the conversion factor 6.25 which is the average amount of nitrogen (%) contained in protein.
2Crude Protein %: represents total nitrogen content of the forage; higher protein is usually associated with better feed quality.
3Soluble Protein %: non-protein N and portion of true proteins that are readily degraded to ammonia in the rumen.
4RDP (Rumen Degradable Protein): portion of crude protein that microbes can either digest or degrade to ammonia and amino acids in the rumen.
5ADF (Acid Detergent Fiber): represents the least digestible fiber portion of forage; the lower the ADF value the greater the digestibility.
6NDF (Neutral Detergent Fiber): insoluble fraction of forage used to estimate the total fiber constituents of a feedstock.
7Ash: mineral elements of the forage.
8TDN (Total Digestible Nutrients): measure of the energy value of the forage.
9Net Energy Lactation: estimate of the energy in a feed used for maintenance plus lactation during milk production.
10RFV (Relative Feed Value): indicates how well an animal will eat and digest a forage if it is fed as the only source of energy.
Jeff Semler, Principal Agriculture Agent University of Maryland Extension, Washington County
Each year, someone, somewhere, ends the growing season short on forage. There are many more this year. For much of our area, dry conditions are continuing as the jet stream tends to not move for extended periods during the present solar minimum we are experiencing. One area gets dumped on while the other goes begging for water. This has impacted the second (and some areas the first) cutting. Hay crop yields are reported to be down 30 to 40%. The extended days with temperature over 85 F can decrease corn silage yields as corn stops growing above that and we have had many days that fit that picture. Added to it the dry conditions and the potential is for corn yields both be down and later maturity as the corn stopped growing for extended days this summer. It is nearly the beginning of September, and you need to identify how much feed you need and what will supply that. There are still a few options open for last chance forage this year. There are also steps you can take this fall to get very early forage next spring when you run out of haylage.
If you are looking for high-quality dairy forage, no mechanically harvested crop will produce as much and as high a quality as late summer planted spring oats. Because of the increasingly cool fall temperatures, the forage quality is incredibly high (higher than forage oats in the spring). You may want plant later to wait for the cooler nights to reduce the aphid population which can bring in in Barley Yellow Dwarf Virus. Aphids can infect the plant with BYDV in less than 30 minutes. If you are planting early or on time, it is recommended using a neonic seed treatmentas they are effective in limiting aphid feeding, based on research from the Cornell IPM coordinator. A moist fall can hammer this excellent plan by a major outbreak of rust. It could reduce quality and yield. Normally it starts to show a week or so before harvest. If scouting finds it, a highly suggested practice is to apply a fungicideto the oats when they are starting stem elongation. If you have a cereal leaf beetle outbreak an insecticide can be applied at the same time as the fungicide. Both are low cost assurance of top forage yield.
It is suggested 3 bu/acre of oats. Klicer’s research found NO yield increase from increased fall oat seeding rate.If you use grain type oats, remember it will go through its life cycle quicker and so be ready to plan your timing to dry it for silage. If you are not going to be able to plant until later or have to harvest or graze later, then the slower forage oat type would be the better recommendation based on Ohio State research. Be liberal with the preplant manure but within your Nutrient Management Plan recommendations. In a 2010 study, Cornell studies had a relatively low yield of 2 tons DM/acre due to extremely dry weather. Despite the low yields, over 120 lbs of nitrogen/acre was removed as protein. *NOTE: If you applied manure don’t feed this to dry cows because of high potassium.
For high producing dairy cows, mow as soon as the flag leaf is out, or early boot. Even early boot is still very good forage. The reason for this is because of the very cool night temperatures inhibit respiration of the most digestible parts, and they accumulate in the plant. As soon as it hits flag leaf, mow wide swath. You are trying to dry something that can yield 2 – 3 times more tons of dry matter than a heavy alfalfa first cutting, compounded by cooler temperatures and much less intensity and hours of sunlight. Even with wide swath, the high yield sheer mass will allow only the top to dry. As soon as the top has a light grey cast (pick up a surface plant and see if it is greener underneath) tedd to get the lower layers spread and drying. Watch forward speed so you don’t make tedder lumps. It is critical that it be ensiled the same day you mow because of the very high sugar levels (exception to rule: if it goes into the 30’s F at night it stops respiration and sugar loss and you can go to the next day). Leaving it overnight in warmer temperatures burns off the sugars and produces higher populations of Clostridia and higher levels of butyric acid. With same-day haylage, these are reduced or eliminated even at higher moisture conditions. On the flip side, the very high sugar levels, if preserved until you ensile the crop; will speed the process and produce an excellent fermented forage if inoculated.
Fall Spring Oats plus Winter Triticale. This is a triple crop system where oats and winter triticale (100 lbs. oats/acre with 80 lbs. of triticale/acre) are planted after corn silage harvest or in fallow wheat ground. After the oat harvest, the triticale continued to grow and produced an excellent forage the next year. It is CRITICAL that you mow the oats with the cutter bar set at a minimum of 4 inches. Where 4 inches or more is left, the triticale thrived. Where mowed less than 3.5 inches the triticale died. Target flag leaf oat harvest to maximize triticale fall regrowth. Fertilize the triticale as normal the next spring and had an excellent harvest. This can give you two very high-quality forage crops in one planting.
Last Chance Forage: If it rains, cool-season grasses put on a burst of growth in late August, September, and early October. Feeding the crop with nitrogen and sulfurcan give you some very high-quality forage for your dairy herd. It will be wet so chop it ¾ to 1 inch long to reduce leachate. As with the oats above, use a homolactic inoculant and ensile it the same day it is mowed (unless temperatures drop to the 30’s at night). Remember to cut grass at 4-inch cutting height to maintain the stand.
First Chance for Very High-Quality Forage Next Year. Now is the time to get seed for winter forage. This will be the earliest highest quality forage you can get into your cows next spring. Fermented energy levels are equal to corn silage, protein (with sulfur fertilization) can equal good alfalfa. Both rye and winter triticale could be used to produce winter forage. Winter triticale is preferred as it is 35% higher yielding than rye in side by side tests. Flag leaf triticale resists lodging at nitrogen rates over 100 lbs.N/a which gives high crude protein, while rye lodges.
The Key to High Winter Forage Yields is Planting on Time, which is: 10 DAYS TO TWO WEEKS BEFORE WHEAT-FOR-GRAIN PLANTING DATE IN YOUR AREA.This has proven true over the past 20 years of winter forage research. Earlier planting means more tillers which means more spring yield potential. On-time planting research showed a 25-35% yield increase next springvs late (same date or later than wheat).
Should we skip winter forage? NO! Go ahead and plant. You will protect the soil against long term yield-robbing soil erosion; improve the soil health and structure for long term yield gain and still could have economical yields of very high-quality forage. There are several steps that our research has found to improve the yield and survival of late winter forage. Don’t fall for the old story that if you plant late you can make up for it by putting down more seed. Research has not seen any advantage planting over 100 lbs winter triticale seed/acre. If you are forced this year to plant later than the optimum two weeks before wheat grain planting; instead of spending money on extra seed, spend it on having a 3-way fungicide seed treatment applied to the seed. In replicated trials at the on-time planting date, the treated seed yielded 15% more than the control of untreated seed. For the late planting date, the treated seed yielded 28% more than the untreated seed. The late seeding still produced 2.8 tons of dry matter (8 tons/a 35% dm) yield which is a very profitable crop. Much depends on fall weather. The management most critical to survival in late planting is to plant at 1.25 inches at a minimum. If you don’t, in early spring thaw the heaving will push the plant up and they don’t grow. For keys on planting watch the YouTube video Establishing Winter Triticale Forage.
Like cool season grass, oats with an under-crop of winter triticale must be mowed at 4-inch cutterbar height or it will be killed. Mowed properly, this triticale crop is growing very nicely the next spring.
(adapted from research by Tom Klicer; Cornell University Emertis).
1,2Cara Peterson, 2Steven Mirsky, 1Kate Tully, 1,2Victoria Ackroyd 1Department of Plant Science and Landscape Architecture, University of Maryland 2United States Department of Agriculture, Agricultural Research Service, Beltsville
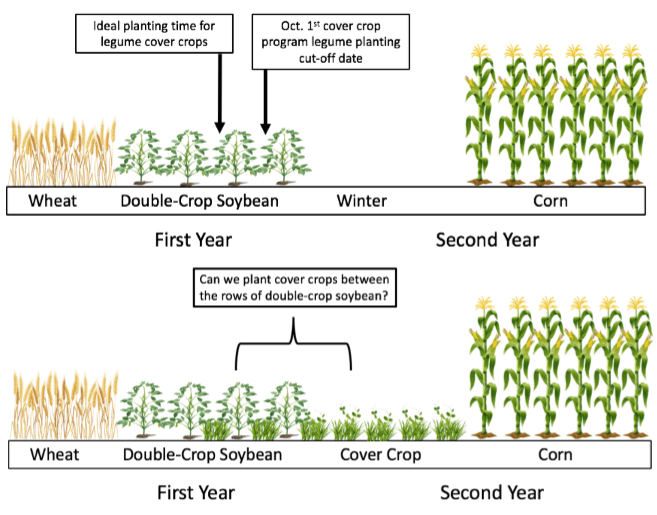
The mid-Atlantic region has the highest percentage of arable acreage in cover crops in the United States, with some reports placing Maryland and Delaware as the two states with the highest percentage of total cropland planted with cover crops (Wade et al., 2015; Hamilton et al., 2017). However, the majority of producers in the region are only using grass cover crops, since legumes require earlier planting dates in order to over-winter (Mirsky et al., 2011; Clark, 2012). Farmers in this region have success with legume cover crops when planting them after wheat harvest or frost-seeding in the spring. However, most mid-Atlantic crop rotations include double-crop soybeans planted after wheat, which limits opportunities for establishing a legume cover crop. Low legume adoption is particularly problematic as farmers could use this cover crop before corn to maximize the opportunity for nitrogen fixation benefits.
Figure 1. (Top) A typical mid-Atlantic crop rotation, with double-crop soybeans in the field at the pivotal points for establishing a successful legume cover crop. (Bottom) Proposed crop rotation scheme for interseeding a cover crop between 30-inch soybeans. The cover crop over-winters and is terminated before corn planting in the spring.
Some farmers interseed cover crops into growing cash crops to overcome this timing challenge. Current options for planting cover crops into standing corn and soybean include both aerial broadcasting via airplane and adapted high-boy sprayers. However, these two techniques often result in poor establishment due to low seed-to-soil contact and seed predation by rodents and birds (Hively et al., 2001; Baker and Griffis, 2009; Wilson et al., 2013).
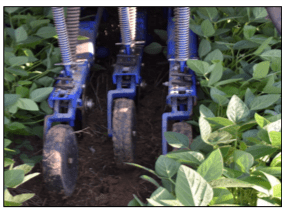
Figure 2. Interseeding cover crops with three planting units between 30-inch soybean rows.
To address the issue of planting cover crops into standing cash crops, our mid-Atlantic team ran numerous trials of an InterSeeder grain drill (InterSeeder Technologies, LLC; Fig. 2). Engineered by the Pennsylvania State University, this drill plants three rows of cover crops between 30-inch rows of standing cash crops. Field trials of this InterSeeder have been conducted in corn, as well as full-season soybeans, at various sites in the region with mixed results (Curran et al., 2018; Wallace et al. 2017). In Maryland, interseeding into full-season corn was moderately successful, whereas cover crops did not perform well in full season beans. However, exploratory research in Maryland identified wide-row double crop soybeans as a viable option for interseeding. The success of seeding grass-legume mixtures into 30-inch double-crop soybeans has led to an expanded on-station research program.
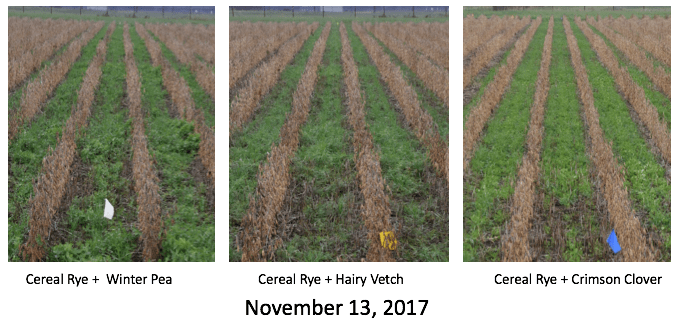
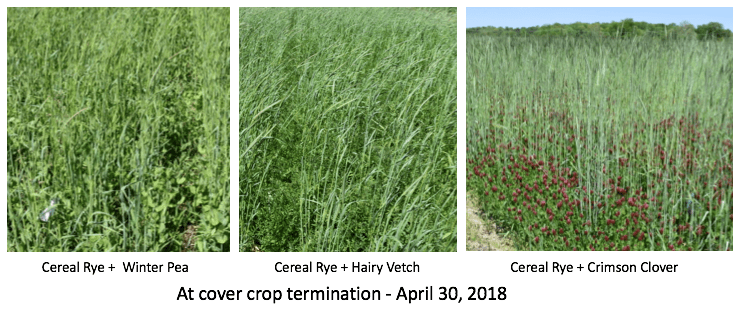
New Field Trials. Field trials with five different interseeded cover crop treatments were conducted to determine the optimal legume cover crop species to interseed in mixture with cereal rye and if interseeding a cover crop mixture affected wide-row double crop soybean yields. The five different cover crop treatments included: cereal rye alone, cereal rye independently mixed with four different legumes (hairy vetch, crimson clover, red clover, and winter pea), and a no cover crop control (Table 1).
Double-crop soybeans planted in June were then interseeded with the cover crop treatments in early September 2017 and late August 2018. The double-crop soybeans were harvested in November for 2017 and later in 2018 (December) due to wet field conditions. The interseeded cover crop treatments grew throughout the winter and were terminated with herbicides in April 2017 and 2018 before planting corn.
In an ideal interseeding scenario, the cover crop is planted as the double-crop soybeans are beginning to reach full canopy in early September. That way, the cover crops only have to survive a few weeks under the low light conditions of a soybean canopy until leaf drop. Once the soybean canopy is gone, the cover crops continue to grow but do not interfere with soybean harvest.
Insights from Interseeding Trials
Cereal rye + crimson clover produced the highest average cover crop biomass. The cereal rye + crimson clover fall 2017 seeding produced an average of 4,980 lbs per acre of biomass while the 2018 seeding produced 3,950 lbs per acre by the spring of 2019. Cereal rye + hairy vetch and cereal rye + winter pea reached similar levels of biomass in two out of the three field sites where the cover crops survived under the soybean canopy.
Interseeding did not decrease yield. There was no pattern of soybean yield differences between the 30-inch wide row double-crop soybeans that had or hadn’t been interseeded. Likewise, there were very minimal differences in soybean yields between the cover crop treatments.
Interseeding did not affect soybean grain quality. Green cover crop plant material was not found in any soybean grain subsampling. Moisture levels remained consistent, with very slight variance across the field as expected in a normal cropping system.
Row orientation matters. Out of the five trial sites, two of the cover crop plantings did not survive under the soybean canopy. Interestingly, the three field sites with strong cover crop survival rates had rows oriented in roughly the same direction: East-West or Southeast-Northwest. The two field sites where the cover crops sprouted but did not survive under the soybean canopy in the fall were on a perpendicular row orientation of Northeast-Southwest.
Row Spacing Considerations. The InterSeeder requires a 30-inch row spacing, while most double-crop soybean fields are planted in narrower rows of 15 inches or less. To account for the differing production practices, these field trials also included simple yield comparisons of 30- and 15-inch row double-crop soybeans. In the row spacing (15- vs 30-inches) trial, results were mixed. There was a yield penalty for wide row spacing in 2017, but not in 2018.
While the benefits of narrow row spacing have been well documented in full season beans, less is known about the potential advantages in double crop soybeans. We speculate that optimal production years enhance the effect of row spacing. For example, 2017 was a better soybean year compared to 2018 across the mid-Atlantic region. Higher levels of precipitation in 2018 than 2017 could have damaged yields. Previous research indicates that in lower yield years or for late-planted soybeans, the benefit of planting in 15 inch rows over 30 inch rows is lost (Alessi and Power, 1982; Hodges et al., 1983; Boquet, 1990; Weaver et al., 1990, Oplinger et al., 1992; Pederson and Lauer, 2003, Whaley et al., 2015).
Future Research. Nitrogen content analysis of the interseeded cover crop biomass is currently underway. Next, the research team will analyze how the following year’s corn crop responded to the interseeded cover crop mixtures.
References
Alessi, J., and J.F. Power. 1982. Effects of plant and row spacing on dryland soybean yield and water-use efficiency. Agronomy Journal 74:851–854. D.o.i.:10.2134/agronj1982.00021962007400050019x
Baker, J. M., and T. J. Griffis. 2009. Evaluating the potential use of winter cover crops in corn-soybean systems for sustainable co-production of food and fuel. Agricultural and Forest Meteorology, 149(12), 2120–2132. D.o.i.:10.1016 j.agrformet.2009.05.017
Boquet, D. J. 1990. Plant population density and row spacing effects on soybean at post-optimal planting dates. Agronomy. J.: 59–64. D.o.i:10.2134/agronj2009.0219.
Clark, A. (Ed.). 2012. Managing cover crops profitably (Third ed.). College Park, MD: Sustainable Agriculture Research and Education.
Curran, W.S., R.J. Hoover, S.B. Mirsky, G.W. Roth, M.R. Ryan, V.J. Ackroyd, J.M. Wallace, M.A. Dempsey and C.J. Pelzer. 2018. Evaluation of cover crops drill interseeded into corn across the mid-Atlantic region. Agronomy Journal 110, 435–443. D.o.i.:10.2134/agronj2017.07.0395
Fisher, K. A., B. Momen,, and R.J. Kratochvil. 2011. Is broadcasting seed an effective winter cover crop planting method? Agronomy Journal, 103(2), 472–478. D.o.i.:10.2134/agronj2010.0318
Hively, W.D. and W.J. Cox. 2001. Interseeding cover crops into soybean and subsequent corn yields. Agronomy. J. 93:308-313. D.o.i.:10.2134/agronj2001.932308x
Hodges, H.F., F.D. Whisler, N.W. Buehrig, R.E. Coast, J. Mcmillian, N.C. Edwards, and C. Hovermale. 1984. The Effect of Planting Date Row Spacing and Variety on Soybean Yield in Mississippi (Bulletin 912). Report prepared for the Mississippi Agricultural and Forestry Experiment Station.
Hamilton, A. V., D.A. Mortensen and M.K. Allen. 2017. The state of the cover crop nation and how to set realistic future goals for the popular conservation practice. Journal of Soil and Water Conservation. 72(5), 111-115A. DOI: 10.2489/jswc.72.5.111A
Mirsky, S.B., W.S. Curran, D.A. Mortensen, D.L. Shumway, and M.R. Ryan. 2011. Timing of cover crop management effects on weed suppression in no-till planted soybean using a roller-crimper. Weed Science 59:380–389
Oplinger, E.S. and B.D. Philbrook. 1992. Soybean planting date, row width, and seeding rate response in three tillage systems. Journal of Production Agriculture. 5: 94-99. DOI:10.2134/jpa1992.0094
Pedersen, P. and J.G. Lauer. 2004. Soybean growth and development response to rotation sequence and tillage system. Agronomy Journal 96(4), 1005–1012. D.o.i.:10.2134/agronj2004.1005
Wade, T., R. Claassen and S. Wallander. 2015. Conservation-Practice Adoption Rates Vary Widely by Crop and Region, EIB-147, U.S. Department of Agriculture, Economic Research Service. Available at https://www.ers.usda.gov/webdocs/publications/44027/56332_eib147.pdf?v=42403
Wallace, J.M., W. S. Curran, S. B. Mirsky, M.R. Ryan. 2017. Tolerance of interseeded annual ryegrass and red clover cover crops to residual herbicides in mid-Atlantic corn cropping systems,” Weed Technology, 31(5), 641-650.
Weaver, D.B., R.L. Akridge, and C.A. Thomas, C.A. 1991. Growth habit, planting date, and row-spacing effects on late-planted soybean. Crop Science (31) 805-810
Whaley, C., J. Adkins and P. Sylvester. 2015. Final report to Delaware soybean board: Evaluating the response of full season and double-cropped soybeans in narrow and wide rows to various soil moisture levels.
Wilson, M. L., J.M. Baker, and D.L. Allan. 2013. Factors affecting successful establishment of aerially seeded winter rye. Agronomy Journal, 105(6), 1868–1877.
Nicole Fiorellino, Extension Agronomist University of Maryland
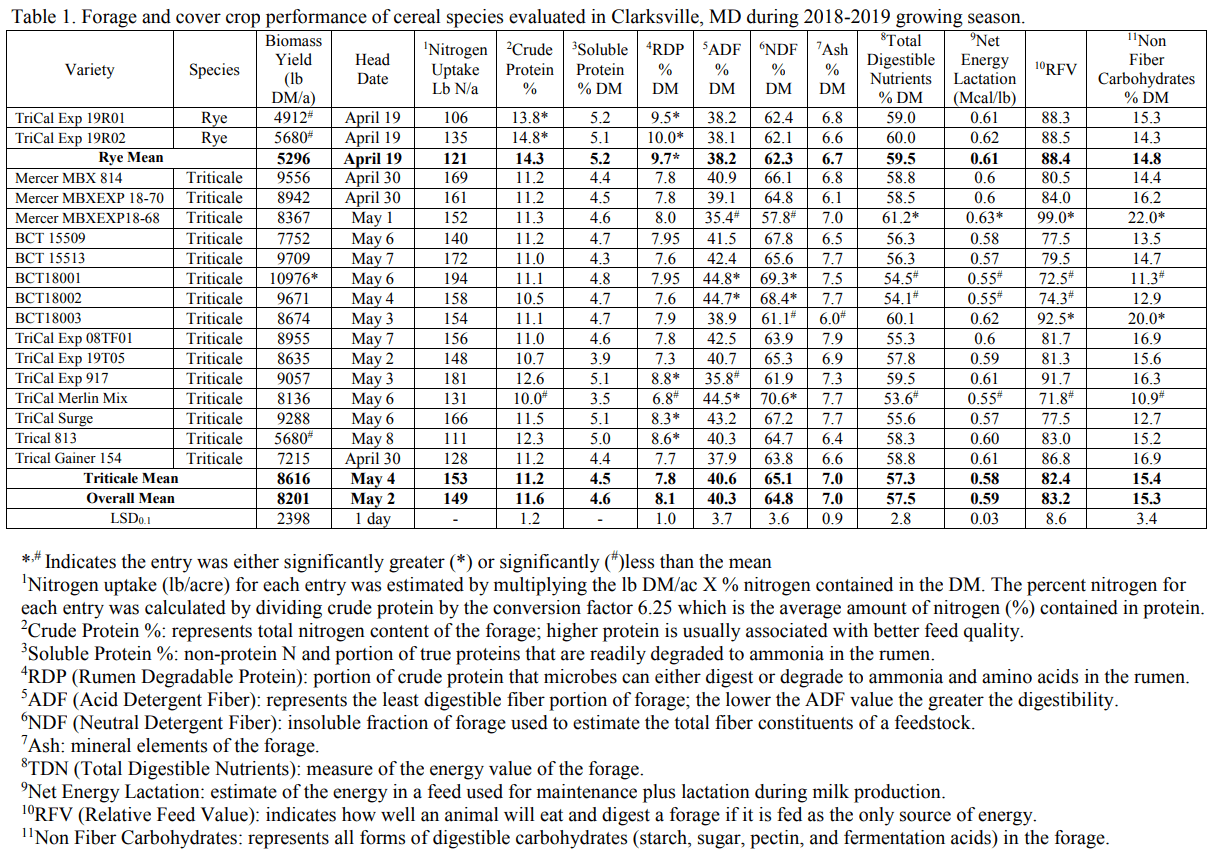
Dairy farmers are constantly looking for sources of forage to meet their feed needs. One source that many of this region’s dairy farmers utilize is the fall planting of cereal grains that are green-chop harvested the following spring. Among the cereal species used for this purpose are rye, triticale, barley, and wheat. Per the Maryland Cover Crop Program guidelines, cereal grains planted as a cover crop prior to November 5 and suppressed via green-chop in the spring are eligible for the grant payment for participation in the Cover Crop Program. In addition, per the Nutrient Management Regulations, a fall application of dairy manure is allowed to a field planted to a cereal cover crop.
Planting a cereal cover crop that will be green chop harvested fits well into the crop rotation used by many dairy farmers. The scenario that many follow is to plant the cereal cover crop following harvest of corn silage. Prior to planting the cover crop, an application of manure is made to the field. The subsequent planting of the cover crop provides incorporation of the manure into the soil. The fall and spring growth of the cover crop is supplied nutrients from the manure. At the same time, the cover crop provides protection to the soil from loss of nutrients via leaching and/or erosion. The objective of this study was to evaluate select varieties of cereal species for cover crop performance and forage production and quality.
Cereal varieties (17) representing two species (rye and triticale) were evaluated at Central Maryland Research and Education Center – Clarksville Facility. Three replications for each entry were planted using a randomized complete block experimental design. Planting date was October 10, 2018. The 3’ X 18’ plots were planted with a small plot planter with 6-inch spacing between each of the 7 rows. The germination percentage for each entry was used to calculate the seeding rate needed to establish 1.5 million seedlings. Good stands were established by late fall.
In order to compare forage quality among the entries that headed over a period of two weeks, the timing of the spring biomass harvest was when the entries had reached late boot to early heading stage of development. The two rye varieties were harvested on April 23, while the triticale varieties were harvest on either May 1 or May 6, basing on heading date (Table 1). Each harvest sample was collected by cutting the plants just above ground-level from three center rows of each plot from an area 2.5 feet in length and from two areas within the plot. The samples were placed into cloth bags and dried using a forced air dryer set at 60 C where they remained until sample water content was zero. Each sample was weighed and is reported as pounds of dry matter production per acre (Table 1). Each of the dried samples was ground through a 20-mesh screen using a large plant grinder. For each location, the ground biomass samples were sent to Cumberland Valley Analytical Laboratory for standard forage quality analysis.
Cover crop performance is measured by amount of biomass produced and the concentration of nitrogen in the biomass. These two factors were used to estimate nitrogen uptake (Table 1). There was no significant difference in nitrogen uptake among the varieties tested. A number of forage quality characteristics for these cereals was measured (Table 1). The descriptions of the various quality characteristic are described here and in the footnotes at the bottom of Table 1. Crude protein (CP) is the nitrogen content of the forage, with higher protein representing better feed quality. This value was used to calculate nitrogen uptake of each variety (Nitrogen content = % CP/6.25). Both rye varieties had significantly greater CP than the overall mean, with one triticale variety having significantly less CP content than the overall mean. Both rye varieties also had rumen degradable protein (RDP) content significantly greater than the overall mean.
Neutral and acid detergent fiber (NDF. ADF) are measures of feed value and represent the less digestible components of the plant, with NDF representing total fiber and ADF representing the least digestible plant components. Low NDF and ADF values representing increased digestibility; ideally NDF values should be <50% and ADF values should be <35%. One triticale variety had significantly lower NDF and ADF values than the overall mean, representing a digestible triticale variety. This same variety also had significantly higher total digestible nutrients (TD), net energy for lactation (NEL), relative feed value (RFV), and nonfiber carbohydrates (NFC).
The characteristic that best captures the overall forage quality performance is Relative Feed Value (RFV). A RFV of 100 is defined as the forage value that full bloom alfalfa would have. Two triticale varieties had significantly higher RFV than the overall average but both rye varieties also had high RFV values, though not significantly different than the overall mean. Though, none of these green-chop cereal forages are considered to be adequate as a stand-alone feed for a dairy operation, they can supply a source of forage used in a total mixed ration at the time of year when feed supply may be running short. When this forage benefit is added to the environmental benefit that is gained, planting winter cereal cover crops on a dairy farm can be a win-win decision.
Catherine Gaudlip2, Nathan Sedghi2, Rebecca Fox2, Leslie Sherman and Ray Weil1 1University of Maryland and 2Washington College
Thanks, in part, to the Maryland Agriculture Cost Share (MACS) incentive program, Maryland farmers have long led the nation in cover crop adoption. Over the past few years, many farmers have graduated from single-species to multiple-species cover crops that can increase biodiversity, soil health and resilience in the face of unpredictable weather extremes. Fine-tuning cover crop management as part of the whole farm system can enhance the benefits that cover crops provide to farmers and the Bay. For example, waiting until harvest is completed to plant cover crops in fall (hopefully by the last MACS deadline) and then terminating the covers as early as possible in spring is still a common approach that severely limits the benefits derived from multi-species cover crops. To perform effectively in preventing nitrogen leaching over the winter, cover crops need to get as early a start as possible so their roots will clean up the mobile nitrate from the deep soil layers where it is most susceptible to being lost to the Bay. Accomplishing this requires finding innovative ways to provide sufficient growing degree days (GDD) in fall. The same cover crop that prevented nitrogen leaching over the winter can pivot to providing nutrient cycling, weed suppression and soil and water conservation during the spring and summer if – and this is a big if – it is allowed to produce a large diverse biomass before it is terminated.
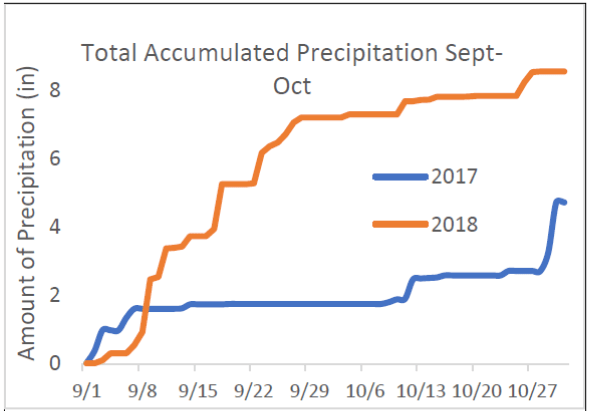
Figure 1. Daily precipitation in fall during cover crop planting time. Fall 2017 was very dry while fall 2018 was extremely wet.
A common practice in Maryland is to drill a cover crop after harvest, which would typically be in October or November, and then kill it as early as mid-March to early April in the spring. We are conducting research that compares this common practice to a cover cropping season that is extended both in fall and in spring. There are many innovations that farmers are devising to extend the cover cropping season, but the most common and simplest are; 1) flying cover crop seed into standing crops weeks or even months ahead of harvest in the fall and 2) delaying cover crop termination right up to or even beyond cash crop planting in the spring using a technique known as “planting green.” Flying on cover crop seed may have the advantage of giving the covers a head start; however, it is more weather-dependent, can less reliably establish a good stand, and may produce less even stands than drilling after harvest. Planting green has been practiced successfully for almost a decade by a few innovative farmers in Maryland and elsewhere, but there is little research yet to document its performance. The strikingly different weather patterns of the past two years has allowed our research to assess how well these cover crop season-extending practices perform under a wide range of conditions.
Our study was conducted in collaboration with four farmers in Talbot and Kent Counties for two years. Seven fields (5 corn and 2 full season soybean) were used in fall 2017, and six fields (1 corn and 5 full season soybean) in fall 2018. Each field received two different cover crop planting treatments using a mix that included a brassica, legume, and cereal. The idea was to compare typical current cover crop management to an experimental extended-season cover crop. Therefore, cover crops were seeding either 1) by airplane into standing corn or soybeans between late August and the end of September, or 2) by drilling the seed after cash crop harvest (usually in October or November). In fall 2018, a third treatment, a no-cover control strip, was also included in each field. In spring the entire field was planted to a cash crop (corn or soybeans) on the same date, but the drilled cover crop was terminated at the farmer’s earliest convenience (2-4 weeks before cash crop planting), while the flown-on cover crop was planted green and terminated simultaneously with, or shortly after, cash crop planting.
Cover crop above-ground biomass (including the above ground portion of radish tuber) was harvested at random locations, separated by species, and weighed during the late fall, just before radishes were winter killed. Spring cover crop biomass was harvested just before herbicide application on the early killed treatment, and just before cash crop planting on the treatment that was planted green. Cover crop biomass was recorded by plant family, and the effects of planting/termination treatment was analyzed. We also analyzed the relationship between cover crop biomass and local weather conditions. Air temperature of 4 ᵒC (39 ᵒF) was used as the base in GDD calculations for the cover crop. The number of GDDs between cover crop planting and December 1st was determined for each treatment on every field, representing the number of growing degree days available to each cover crop. Cumulative daily rainfall for September and October was also analyzed to differentiate fall cover cropping conditions between the two years.
The amount of rainfall during September and October, when cover seeds were flown or drilled, differed greatly between 2017 and 2018. The fall of 2017 was hot and dry (Figure 1), with approximately 2” of rainfall for the entire month of September, and no autumn day having greater than 1” of rainfall until October 12th. In September and October of 2018 there were several rainfall events of greater than 1”, and there was no two week period without a daily rainfall of at least 0.5”. Unless irrigation is applied (a practice worth considering if available) the effectiveness of aerially seeding a cover crop is highly dependent on timely rainfall to germinate seeds that are broadcast without much seed-to-soil contact. On the other hand, excessively wet conditions can delay harvest operations and push cover crop drilling dates into November or beyond.
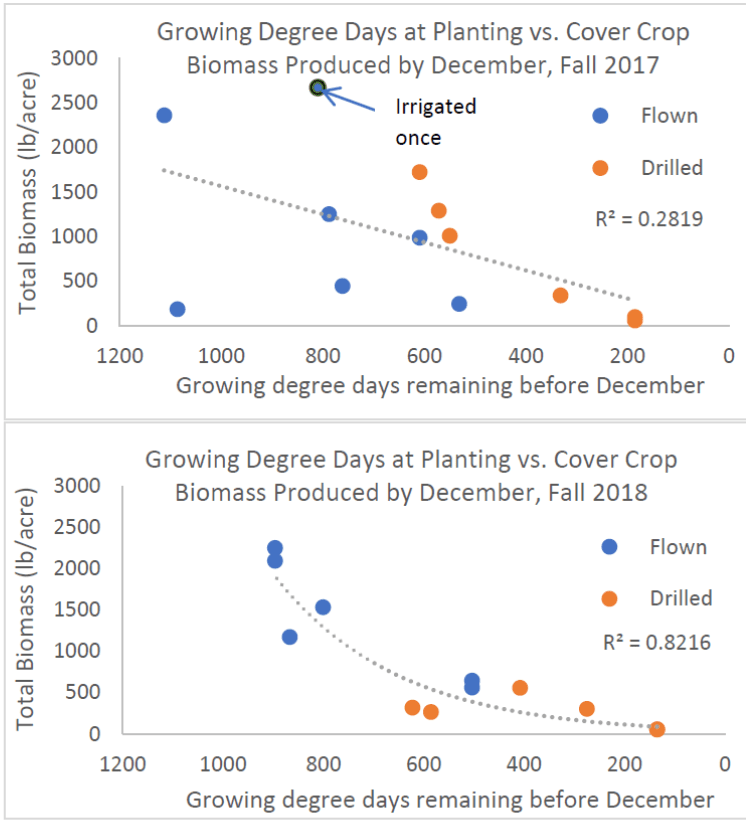
The contrast between fall 2017 and fall 2018 was dramatic. In 2017, harvest was on-time and some cover crops were drilled before the end of September, leading to only a two week difference, on average, between flown and drilled cover crops in our study. The flown cover crop stands were not very uniform and stand establishment was not always successful, likely due lack of rain after seeding causing late germination. In 2017, two fields were excluded from data collection because the flown cover crop failed to establish. The higher uniformity of the drilled cover crop resulted in a strong correlation between available growing degree days and total cover crop biomass (Figure 2, upper).
Figure 2. Total cover crop biomass harvested in late fall by treatment, correlated with growing degree days left in the season at the time of planting (avg. temp of each day added together). Upper graph shows the average of 7 fields for the flown treatment and 6 fields for the drilled treatment for fall 2017. Lower graph shows the average of 6 fields for both the flown and drilled treatments.
In 2018, by contrast, wet conditions led to timely germination and lush, fairly uniform stands on the flown cover crop treatments. However, the wet conditions delayed cash crop harvest, delaying and reducing the effectiveness of post-harvest cover crop drilling. The delays led to the drilled cover crop stand being a failure in one field and the time difference between flying-on and drilling cover crop seed was about 4 weeks, on average. In 2018, available growing degree days correlated closely with fall biomass achieved for flown-on cover crops, but the correlation was weak for drilled cover crops (Figure 2, lower).
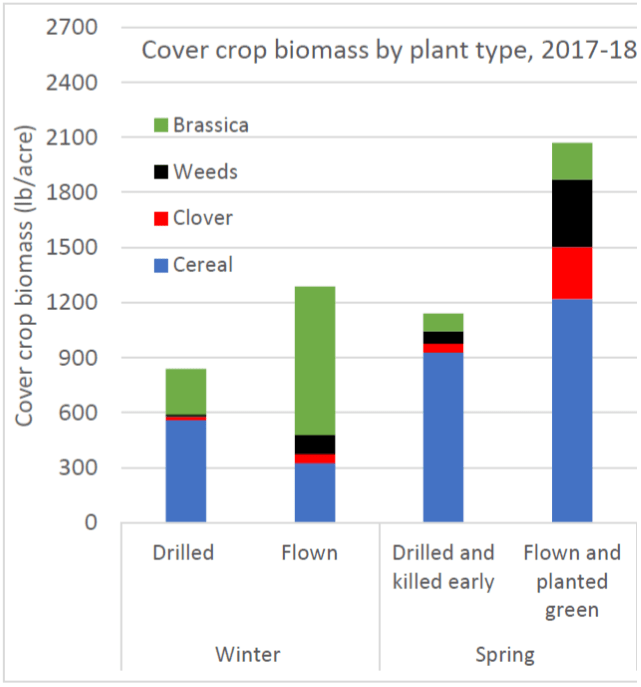
Figure 3. Cover crop biomass by type in fall 2017 and spring 2018 on the same fields. The previously drilled cover crop was killed in early April, and the previously flown cover crop being killed in late April.
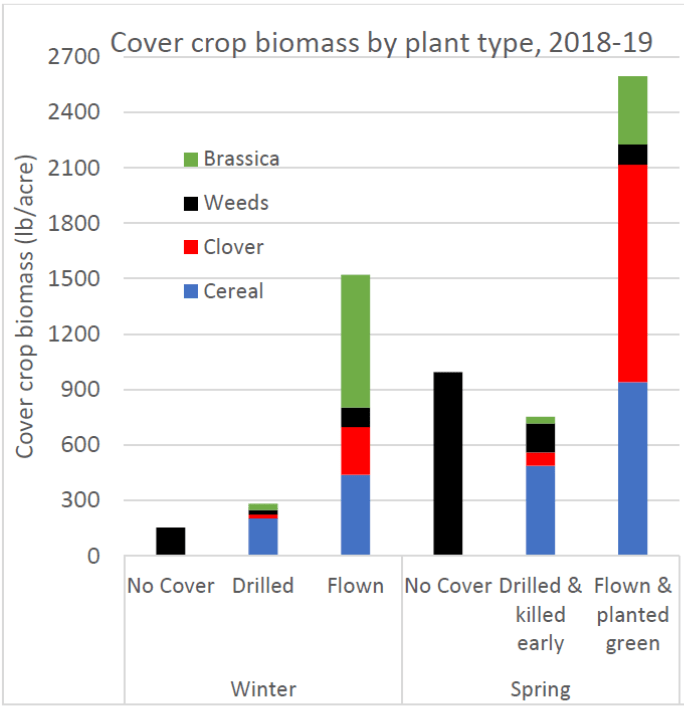
While there were several individual fields with higher drilled than flown cover crop biomass in 2017, the overall average winter biomass did not differ between the two seeding methods. The cover crop biomass was not evenly distributed among the species planted. The majority of biomass in the drilled treatment came from cereals. Cereals, more than legumes and brassicas, germinate and grow well in the cooler conditions of late fall. The majority of fall 2017 biomass in the flown treatment was from brassicas (rapeseed, radish). The brassicas are very quick to germinate and grow aggressively in the warmer condition of early fall/late summer, crowding out the cereals, but apparently co-existing with the legumes. In the spring of 2018, the same pattern was observed. The drilled cover crop, which was also killed in early April, consisted almost entirely of cereals. Cereals were also made up about 60% of total biomass in the flown and planted green treatment, but there was much higher clover biomass in this treatment than in the drilled and killed early treatment (Figure 3). Cereals are good at reducing nutrient leaching, but also tend to tie up nutrients for the spring cash crop. In the wet fall of 2018, the flown biomass was substantially higher and more diverse (Figure 4). Brassicas dominated the flown biomass, but the clover biomass was almost as high as the cereals. In the drilled treatment, cereals provided almost all the biomass, but this was still lower than the cereal biomass in the flown treatment. In spring 2019, cereals still dominated the drilled and killed early treatment, but there were more weeds than either clover or brassicas. The flown and planted green cover crop biomass was approximately 45% clover. This high proportion of clover can be expected to eliminate nitrogen tie-up and may allow some reduction in fertilizer nitrogen application for the following cash crop. High weed biomass in the spring of the no cover treatments indicate that the cover crops in both management systems substantially suppressed weed growth.
Figure 4. Cover crop biomass by type in fall 2018 and spring 2019. These were collected from the same fields, with the previously drilled cover crop being killed in early April, and the previously flown cover crop being killed in mid-late April or early May.
We can draw some preliminary conclusions from these data. While drilling a cover crop stand resulted in greater uniformity in the dry year, this did not necessarily produce greater cover crop biomass. Waiting until after harvest to drill a mixed species cover crop reduced the relative and absolute amount of brassica and clover growth. A cover crop dominated by cereals in the fall can lead to nitrogen tie up in the spring. In the wet year, flying a cover crop early was substantially more effective than drilling a cover crop, leading to higher biomass produced and greater diversity in mixed stands. These observed benefits are increased by delaying kill time in the spring. While there’s always a possibility that a cover crop stand can fail, our data suggest that even in a dry fall when weather conditions favor drilling, flying a cover crop on before harvest can still be an effective practice, on average. In the extremely wet year, flying on the seed early was far more effective, on average, than drilling after harvest. While more site-years of data are needed, these data are encouraging for inter-seeding, especially for mixed-species cover crops.
Note: This research is generously supported by ShoreRivers, Inc. and the Maryland Soybean Board.
ANNAPOLIS, MD – Due to a late harvest and saturated soil conditions, the Maryland Department of Agriculture has extended the Nov. 5 planting deadline by one week for farmers who have signed up to plant cover crops this fall with the Maryland Agricultural Water Quality Cost-Share (MACS) Program. Farmers now have until Nov. 12 to plant qualifying cover crops of rye, wheat and triticale on their fields.
The extension is only available to farmers who use the following planting methods: no till, conventional, or broadcast with light, minimum or vertical tillage. With the extension, farmers must certify their cover crop with their local soil conservation district within one week of planting and no later than Nov. 19 in order to be reimbursed for associated seed, labor, and equipment costs.
“Extending the planting deadline allows farmers enrolled in our popular Cover Crop program to plant more acres of protective cover crops on their fields this fall in order to control soil erosion, reduce nutrient runoff, build healthy soils, and protect water quality in the Chesapeake Bay and its tributaries,” said Hans Schmidt, the department’s Assistant Secretary of Resource Conservation. “Importantly, the extended forecast calls for mild temperatures which should allow for germination to take place.”
Cover crops are cereal grains that grow in cool weather. They help slow down rainwater runoff during the winter, when the soil would otherwise be exposed, and recycle any nutrients remaining in the soil from the previous summer crop. Cover crops are a key feature in Maryland’s efforts to reduce the amount of nutrients entering the Bay.
Maryland’s Cover Crop program is funded by the Chesapeake Bay Restoration Fund and the Chesapeake and Atlantic Coastal Bays Trust Fund. For more information, farmers should contact their local soil conservation district or the Maryland Agricultural Water Quality Cost-Share Program at 410-841-5864.
Dr. Bob Kratochvil – Extension Agronomist Mr. Louis Thorne – Agricultural Research Technician Supervisor Dr. Jason Wight – Field Trials Coordinator Ms. Jessica Whitaker – Student Assistant Ms. Sonia Agu – Student Assistant University of Maryland, College Park
The majority of dairy farmers are constantly looking for sources of forage to meet their feed needs. One source that many of this region’s dairy farmers utilize is the fall planting of cereal grains that are green-chop harvested the following spring. Among the cereal species used for this purpose are rye, triticale, barley, and wheat. Per the Maryland Cover Crop Program guidelines, cereal grains planted as a cover crop prior to November 5 and suppressed via green-chop in the spring are eligible for the grant payment for participation in the Cover Crop Program. In addition, per the Nutrient Management Regulations, a fall application of dairy manure is allowed to a field planted to a cereal cover crop.
Planting a cereal cover crop for green chop harvest fits well into the crop rotation used by many dairy farmers. The scenario that many follow is to plant the cereal cover crop following harvest of corn silage. Prior to planting the cover crop, an application of manure is made to the field. The subsequent planting of the cover crop provides incorporation of the manure into the soil. The fall and spring growth of the cover crop is supplied nutrients from the manure. At the same time, the cover crop provides protection to the soil from loss of nutrients via leaching and/or erosion. The objective of this study was to evaluate the performance of 18 triticale varieties submitted by participating companies along with select varieties of four cereal species (3 triticale, 3 rye, 1 barley and 1 wheat) for cover crop performance and forage production and quality.
The location for this study was the Central Maryland Research and Education Center – Clarksville Facility. Four replications for each entry were planted at the field site using a randomized complete block experimental design. Planting date was October 3, 2017. The 3.5’ X 18’ plots were planted with a small plot planter with 6-inch spacing between each of the 7-rows. Each entry’s germination percentage was used to calculate the seeding rate needed to establish 1.5 M seedlings. Good stands were observed for all entries by late fall.
In order to compare forage quality among the entries that headed over a period of ten days, the timing of the biomass harvest was when each entry reached the late boot stage of development. Each harvest sample was collected by cutting the plants just above ground level from two center rows of each plot from an area 2.5 feet in length. Each sample was placed into a cloth bag and dried using a forced air dryer set at 60o C where they remained until sample water content was zero. Biomass yield is reported as pounds of dry matter production per acre (Table 1). Each of the dried samples was ground through a 20-mesh screen using a large plant grinder. All samples were sent to the Cumberland Valley Analytical Laboratory (Waynesboro, PA; http://www.foragelab.com/) for standard forage quality analysis. Data for all agronomic and forage quality measurements are found in Table 1. Table 2 identifies the Company/Source and address/phone number for the participants who supplied the cereal varieties tested in this study.
Producers are always interested in biomass production. Notable entries for biomass production were BCT15513 (Seed-link, Inc.) and Mercer EXP508 (Eddie Mercer Agri-Services, Inc.). Cover crop performance is measured by amount of biomass produced and the concentration of nitrogen in the biomass. These two factors were used to estimate nitrogen uptake (Table 1). The top two entries for cover crop performance were Cover Crop Rye and the triticale variety, Mercer EXP508 (Table 1). The only entry to have nitrogen uptake that was significantly less than the mean for the study was the triticale variety, TriCal 813 (37 lb N/a). This is due to its production of only 2379 lb/a biomass and a low crude protein content (9.8%).
A number of forage quality characteristics for these cereals was measured (Table 1). The descriptions of the various quality characteristic are described in the footnotes at the bottom of Table 1. The characteristic that perhaps best captures the overall forage quality performance is Relative Feed Value (RFV). A RFV of 100 is defined as the forage value that full bloom alfalfa would have. The barley variety, Nomini, and the triticale variety, TriCal Exp 917 (TriCal Superior Forage) had the best RFV (107).
Though, none of these greenchop cereal forages are considered to be adequate as a stand-alone feed for a dairy operation, they can supply a source of forage used in a total mixed ration (TMR) at the time of year when feed supply may be running short. When this forage benefit is added to the environmental benefit that is gained, planting winter cereal cover crops on a dairy farm can be a win-win decision.
Table 1. Performance of 26 cereal varieties tested for biomass production and forage quality at the Central Maryland Research and Education Center Clarksville Farm during 2017-2018.
Variety
Company/Source
Species
Dry Matter Yield
(lb/a
0% Moisture)
Height
(in)
Head
Date
(Days
after April 30)
Nitrogen
Removal
(lb/a)1
Crude Protein
%2
Rumen
Degradable
Protein3
%
Acid
Detergent Fiber
%4
Neutral Detergent Fiber
%5
Total Digestible Nutrients
%6
Relative Feed
Value7
Arcia
Eddie Mercer Agri-Services Inc.
Triticale
4145
49
7*
69
10.6
7.1
33.2*
57.9
63.0*
102
BCT15509
Seed-link Inc.
Triticale
4068
49
11
74*
11.1
7.4
34.4
57.8
62.1
100
BCT15513
Seed-link Inc.
Triticale
5603*
57*
12
93*
10.2
7.0
37.1
61.7
59.8
91
BCT17001
Seed-link Inc.
Triticale
4989*
54
9
87*
10.8
7.5
36.4
59.3
61.5
96
BCT17002
Seed-link Inc.
Triticale
3531
56
10
63
11.1
7.5
34.4
58.8
61.2
99
BCT17003
Seed-link Inc.
Triticale
4337
54
14
78*
10.9
7.8
39.9
64.8
59.1
83
Brasseto
FP Genetics (Canada)
Rye
3492
55
6*
63
11.3
7.8
36.6
60.5
62.0
93
Cover Crop Rye
Variety Not Stated
Rye
4874*
61*
5*
97*
12.2*
8.4*
34.5
58.0
62.1
100
Danko
Polish Plant Breeding Institute
Rye
3608
63*
6*
68
11.9*
8.1*
33.9
57.9
62.8*
100
HiOctane
Seedway
Triticale
4030
54
8
70
10.6
7.1
36.0
60.9
60.4
93
HyOctane
Seed-link Inc.
Triticale
4414
50
10
78*
10.9
7.4
35.3
59.4
61.7
96
Louisa
University of Maryland
Wheat
3838
48
11
63
10.2
6.7
32.9*
55.9*
63.0*
105*
Mercer EXP508
Eddie Mercer Agri-Services Inc.
Triticale
5411*
54
8
97*
11.1
7.5
35.5
58.8
61.9
97
NCT 10318
North Carolina State Univ.
Triticale
4452*
52
6*
77*
10.7
7.1
33.5*
56.3*
63.4*
104*
NCT 10888
North Carolina State Univ.
Triticale
4951*
50
7*
92*
11.7*
7.9
34.2
56.5*
63.3*
103*
NCT 15928
North Carolina State Univ.
Triticale
4222
55
11
74*
11.0
7.4
33.8
55.7*
63.4*
105*
Nomini
Virginia Tech
Barley
2840
49
7*
56
12.5*
8.7*
32.2*
55.5*
63.6*
107*
Traction
Seed-link Inc.
Triticale
4337
46
9
72
10.4
6.9
35.4
59.8
62.0
95
Trical 141
TriCal Superior Forage
Triticale
3761
56
9
63
10.6
7.1
40.4
65.4
58.3
82
Trical 813
TriCal Superior Forage
Triticale
2379
56
12
37
9.8
6.7
38.5
61.4
60.2
90
Trical Exp 08TF01
TriCal Superior Forage
Triticale
4452*
56
12
72
10.0
6.8
39.7
65.4
58.3
82
Trical Exp 30113
TriCal Superior Forage
Triticale
4414
59*
9
74*
10.5
7.0
36.9
60.4
61.0
93
Trical Exp 917
TriCal Superior Forage
Triticale
4452*
47
9
74*
10.3
6.8
32.6*
55.5*
63.8*
107*
Trical Flex 719
TriCal Superior Forage
Triticale
4721*
49
11
75*
9.9
7.0
40.7
64.5
58.2
83
Trical Gainer 154
TriCal Superior Forage
Triticale
3953
49
8
67
10.5
7.2
34.0
57.2*
63.0*
102
Trical Surge
TriCal Superior Forage
Triticale
4337
53
10
72
10.4
7.0
38.0
62.5
59.7
89
Mean
4216
53
9
73
10.8
7.3
35.8
59.5
61.5
96
Probability > F
0.233
0.04
0.0012
0.51
0.05
0.28
<0.0001
<0.0001
<0.0001
<0.0001
LSD(0.20)
1164
6.1
2.6
24
0.95
0.72
1.48
1.82
1.07
4.3
* Indicates the entry was statistically comparable to the best performing variety (in bold) for the measured variable.
1Nitrogen uptake (lb/acre) for each entry was estimated by multiplying the lb DM/a X % nitrogen contained in the DM. The percent nitrogen for each entry was calculated by dividing crude protein by the conversion factor 6.25, the average nitrogen content for protein.
2Crude Protein %: represents total nitrogen content of the forage; higher protein is usually associated with better feed quality.
3Rumen Degradable Protein: portion of crude protein that microbes can either digest or degrade to ammonia and amino acids in the rumen.
4Acid Detergent Fiber: represents the least digestible fiber portion of forage; the lower the ADF value the greater the digestibility; an ADF <35% is considered good quality.
5Neutral Detergent Fiber: insoluble fraction of forage used to estimate the total fiber constituents of a feedstock; NDF has a negative correlation with dry matter intake and is used to estimate dry matter consumption; as NDF decreases animals will consume more forage; for grass forages NDF <50% is considered good quality and >60% is considered low quality.
6Total Digestible Nutrients: measure of the energy value of the forage.
7Relative Feed Value: indicates how well an animal will eat and digest a forage if it is fed as the only source of energy; full bloom alfalfa has an RFV of 100.
8Elite triticale breeding lines obtained from North Carolina State University for local testing by University of Maryland. These are not available for purchase.
Table 2. The company/source for the 26 cereal varieties that were tested in the 2017-2018 Cereal Forage Quality study conducted at Central Maryland Research and Education Center-Clarksville Farm.


 The majority of dairy farmers are constantly looking for sources of forage to meet their feed needs. One source that many of this region’s dairy farmers utilize is the fall planting of cereal grains that are green-chop harvested the following spring. Among the cereal species used for this purpose are rye, triticale, barley, and wheat. Per the Maryland Cover Crop Program guidelines, cereal grains planted as a cover crop prior to November 5 and suppressed via green-chop in the spring are eligible for the grant payment for participation in the Cover Crop Program. In addition, per the Nutrient Management Regulations, a fall application of dairy manure is allowed to a field planted to a cereal cover crop.