Andrew Kness, Agriculture Agent University of Maryland Extension, Harford County
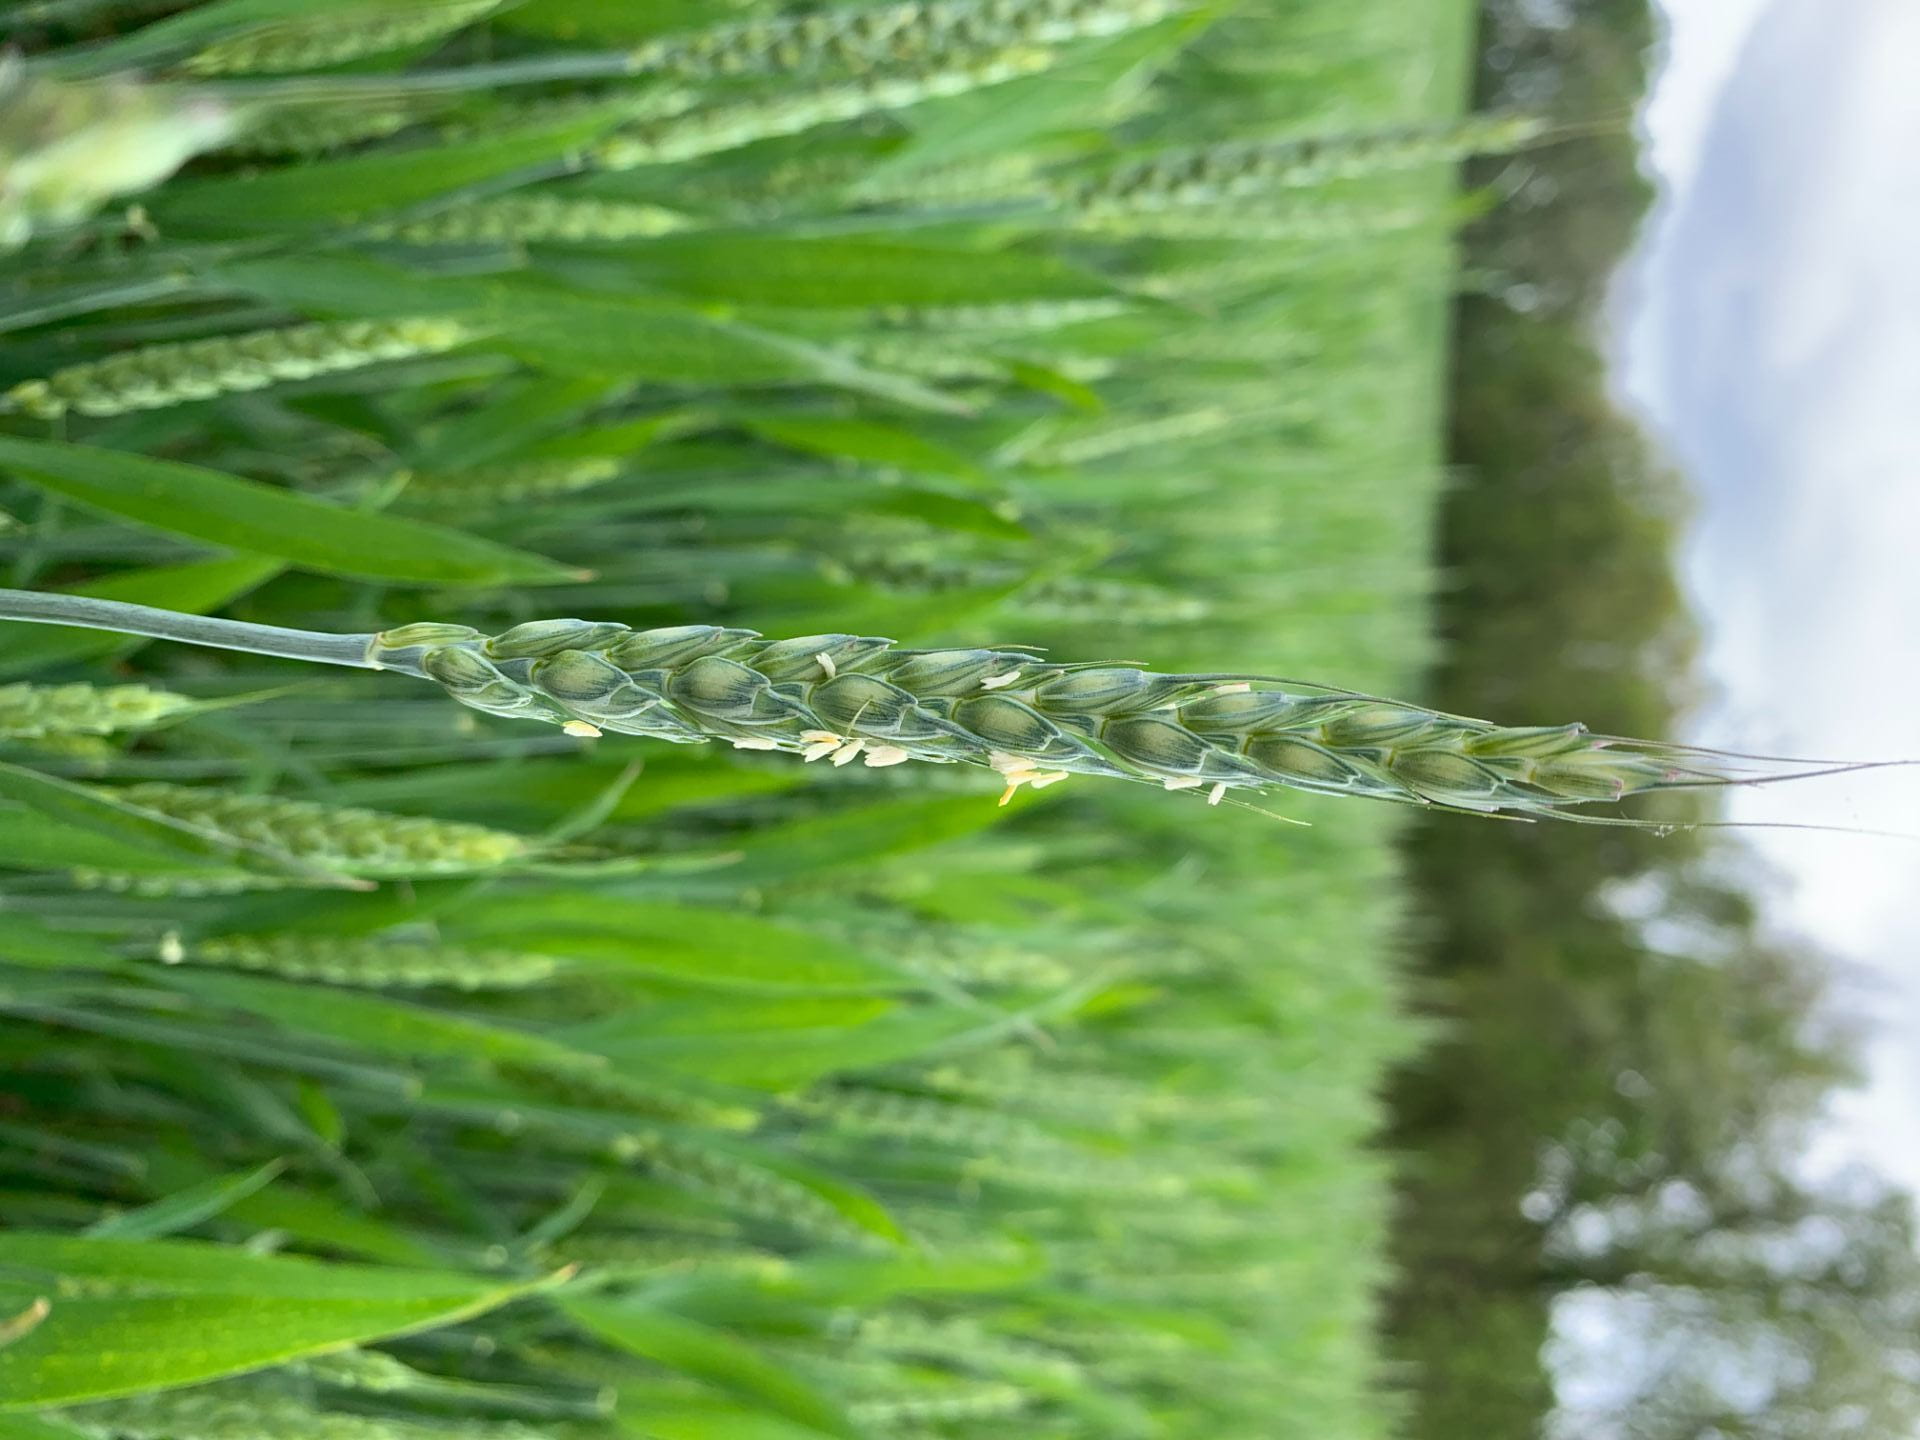
As wheat approaches flowering, here is a final list of reminders/tips to make the most of your fungicide applications that are targeted to manage Fusarium head blight (head scab):
Use an effective fungicide. These include: metconazole (Caramba®), prothioconazole + tebuconazole (Prosaro®), prothioconazole (Proline®), and adepidyn (Miravis Ace®).
Apply an effective fungicide at the correct time. The most effective application window is from flowering (anthesis; Feekes 10.5.1) + about 5-6 days after. Late applications (4-6 days after anthesis) are better than early heading/head emergence (10.3) applications at reducing DON content in the grain.
Apply fungicides using the correct equipment. Ground applications should be made with 80-degree flat fan nozzles angled down from horizontal. For ground applications made at speeds over 6 mph, use a single nozzle angled forward, 30 degrees down from horizontal. For ground applications less than 6 mph, better coverage is achieved with dual forward and rearward facing nozzles, angled 30-45 degrees down from horizontal.
Sprayer should be operated to achieve droplet sizes of 300-350 microns.
Use 10-20 gallons of water per acre and keep the spray boom 8-10 inches above the crop.
For aerial applications: Use 4-5 gallons of water per acre. Fine to medium sized droplets (300-350 microns). Small aircraft should operate 8-10 feet above the crop; large aircraft 10-12 feet. Nozzles should be mounted to cover 65% of the aircraft’s wingspan and mounted as low as possible.
Wheat at Feekes 10.5.1. Image: A. Kness, Univ. of Maryland
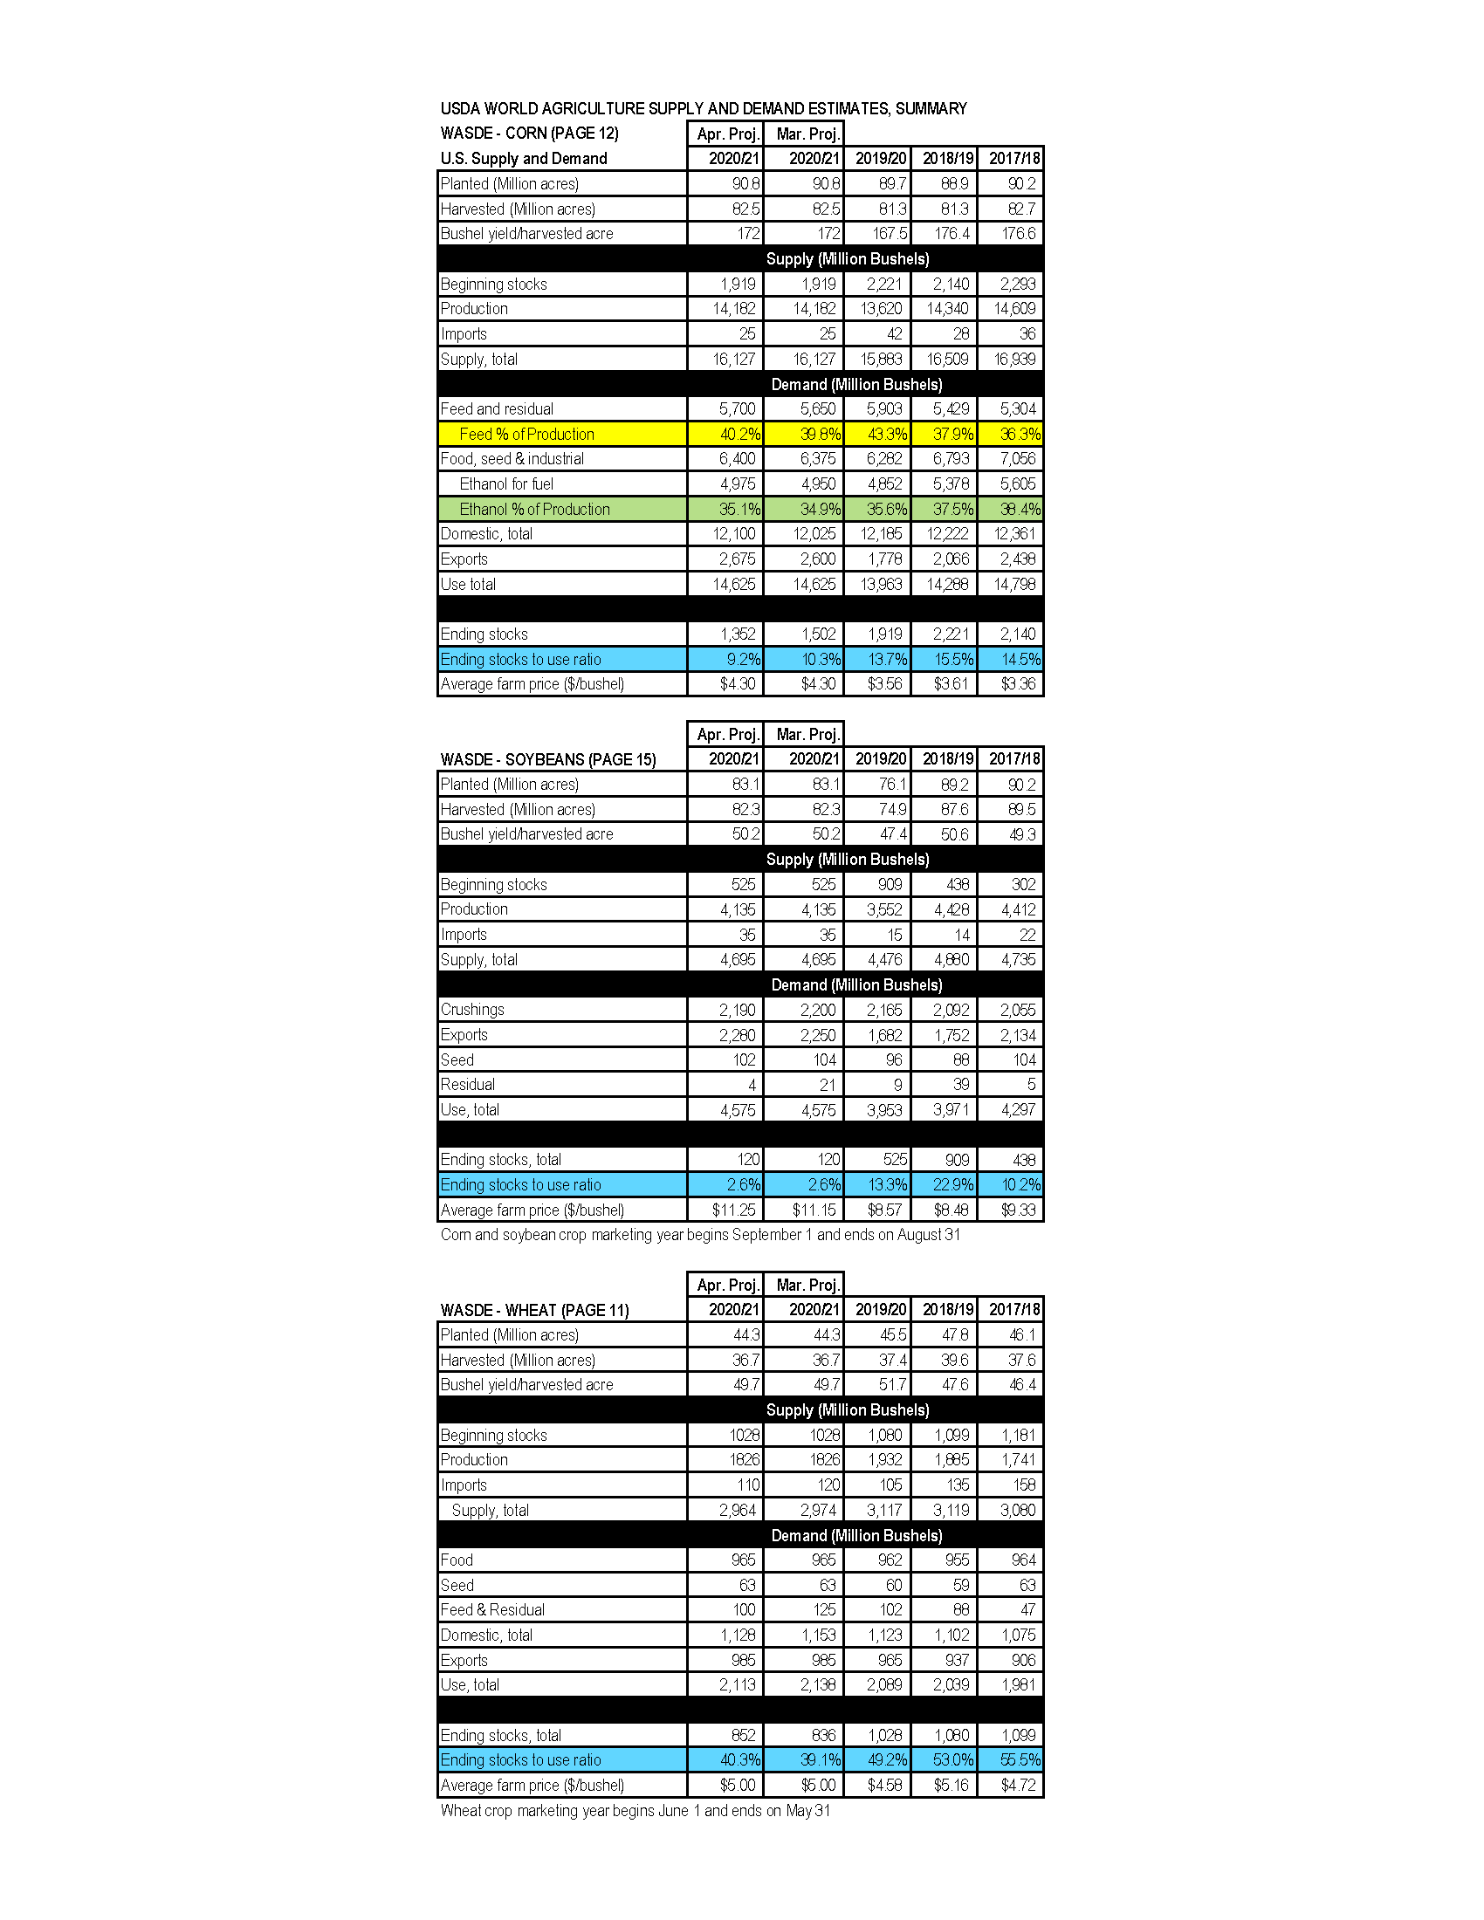
Supply estimates were unchanged. Feed and residual estimate was increased 50 million bushel. Ethanol estimate was increased 25 million bushel. Exports estimate was increased 75 million bushel. The total increase in demand was 150 million bushel decreasing ending stocks the same amount and decreasing the stocks-to-use ratio from 10.3% to 9.2%, the lowest since the 2012/13 marketing year. The Prospective plantings report on March 31 estimated 2021 corn acres at 91.1 million acres which was below expectations. This sent corn prices limit up on March 21. They have continued to climb. Nearby futures are trading in the $5.70 per bushel range and December Corn hit a high of $5.04 per bushel on April 9.
Soybeans
Supply estimates were unchanged. Crushings estimate decreased 10 million bushel. Exports increased 30 million bushel. Seed & residual decreased 20 million bushel. Total demand and ending stocks remained unchanged. The 2.6% stocks-to-use ratio is the lowest since the 2012/13 marketing year. The Prospective plantings report on March 31 estimated 2021 soybean acres 87.6 million acres which was below expectations. This sent soybean prices limit up on March 21. Nearby futures are trading in the $14 per bushel range and November futures closed at $12.63 per bushel on April 9.
Wheat
Wheat import estimate was decreased 20 million bushel. Feed and residual estimate was decreased 25 million bushel. These changes resulted in an increase in ending stock estimates of 16 million bushel and an increase in the stocks-to-use ratio to 40.3%. Since last month wheat futures have declined but in the past few days they have recovered and are trading in the $6.40 per bushel range for nearby futures contracts.
United States Department of Agriculture, National Agricultural Statistics Service press release
Producers surveyed across the United States intend to plant an estimated 91.1 million acres of corn in 2021, up less than 1% from last year, according to the Prospective Plantings report released today by USDA’s National Agricultural Statistics Service (NASS).
Planted acreage intentions for corn are up or unchanged in 24 of the 48 estimating states. The largest increases are expected in the Dakotas, where producers intend to plant a combined 8.90 million acres, an increase of 2.00 million acres from 2020. Producers across most of the Corn Belt intend to plant fewer acres than last year. If realized, the planted area of corn in Idaho and Oregon will be the largest on record.
Soybean growers intend to plant 87.6 million acres in 2021, up 5% from last year. If realized, this will be the third highest planted acreage on record. Compared with last year, planted acreage is expected to be up or unchanged in 23 of the 29 states estimated.
The Prospective Plantings report provides the first official, survey-based estimates of U.S. farmers’ 2021 planting intentions. NASS’s acreage estimates are based on surveys conducted during the first two weeks of March from a sample of nearly 80,000 farm operators across the nation. Other key findings in the report are:
All wheat planted area for 2021 is estimated at 46.4 million acres, up 5% from 2020. This represents the fourth lowest all wheat planted area since records began in 1919.
Winter wheat planted area, at 33.1 million acres, is up 3% from the previous estimate and up 9% from last year. This is the seventh lowest planted acreage on record.
Area planted to other spring wheat for 2021 is expected to total 11.7 million acres, down 4% from 2020.
Durum wheat is expected to total 1.54 million acres for 2021, down 9% from last year.
All cotton planted area for 2021 is expected to total 12.0 million acres, less than 1% below last year.
NASS also released the quarterly Grain Stocks report to provide estimates of on-farm and off-farm stocks as of March 1. Key findings in that report include:
Corn stocks totaled 7.70 billion bushels, down 3% from the same time last year. On-farm corn stocks were down 9% from a year ago, but off-farm stocks were up 5%.
Soybeans stored totaled 1.56 billion bushels, down 31% from March 1, 2020. On-farm soybean stocks were down 41% from a year ago, while off-farm stocks were down 22%.
All wheat stored totaled 1.31 billion bushels, down 7% from a year ago. On-farm all wheat stocks went down 16% from last year, while off-farm stocks went down 4%.
Durum wheat stored totaled 42.7 million bushels, down 17% from March 1, 2020. On-farm Durum stocks were down 4% from a year ago, while off-farm stocks of Durum wheat were down 28%.
The Prospective Plantings, Grain Stocks, and all other NASS reports are available online at nass.usda.gov.
Emily Zobel, Senior Agriculture Agent Associate | ezobel@umd.edu University of Maryland Extension, Dorchester County
Alfalfa
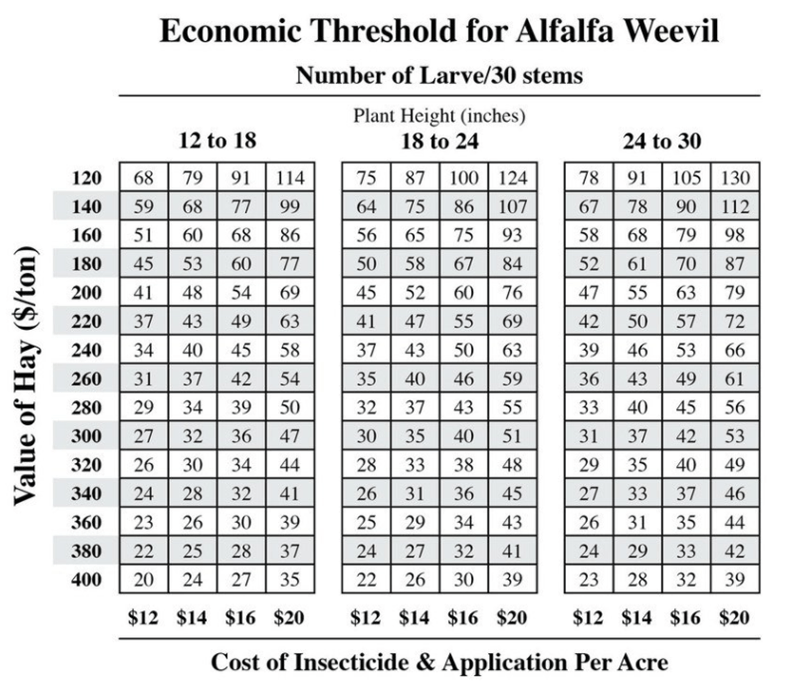
Alfalfa weevils emerge and lay eggs in alfalfa stems in Mid-April. The larvae are yellowish-green with blackheads. The easiest way to scout for this pest is to randomly collect 30 stems from the field and shake them into a bucket. The economic threshold for alfalfa weevil is determined based on the height of plants, the value of the forage, and the cost of insecticidal treatment. A threshold chart can be found on Penn State Extension website https://extension.psu.edu/alfalfa-weevil (Figure 1).
Figure 1. Economic threshold for Alfalfa Weevil. Source: Penn State University
Small Grain
Cereal leaf beetle adults become active in Maryland around mid-April. Adults will lay eggs and larvae will start feeding around the end of the month. Scouting should be done away from the field edge since they tend to clump in fields and near edges. Check tillers of 50-60 randomly selected plants per field and count the number of eggs and larvae. The economic threshold is reached when there is an average of one or more larvae on 25% of tillers. The populations can be spotty, so checking individual fields is often necessary.
Several species of aphids will start to appear in small grains and other spring crops in April, depending on the weather. The most common species in our area are English grain aphid, bird cherry-oat aphid, corn leaf aphid, and the greenbug. Springtime feeding damage can cause discoloration on the leaves and shriveled heads. To scout for aphids, examine one linear row-foot at ten sites within the field. The economic threshold for aphids in wheat in pre-heading stages varies based on the aphid species present. Still, the general rule is treatment is recommended if there is an average of 150 aphids per linear foot of row, with no natural enemies present. For information about species identification and thresholds, check out the “Early Aphid Occurrences: a Possible Result of Warmer Winter Temperatures” article on the Maryland Agronomy News Blog, or contact your local Extension agent.
Andrew Kness, Agriculture Agent | akness@umd.edu University of Maryland Extension, Harford County
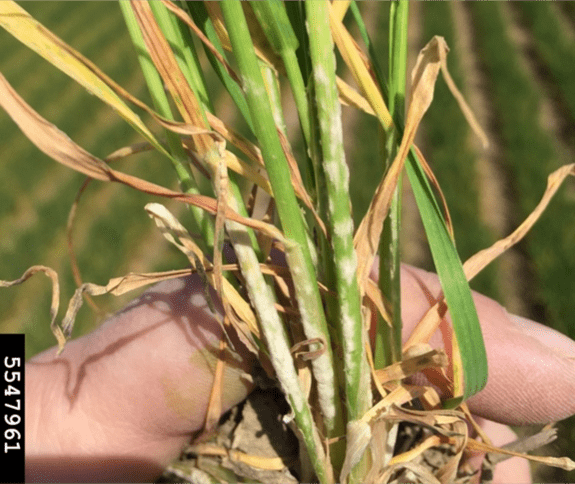
Figure 1. Powdery mildew growth on lower leaves/stems of a wheat plant.
Spring is a busy time on the farm that demands a lot of different tasks; one of the tasks that can be overlooked is scouting your small grains now for the presence of diseases, especially this year considering many areas of the state are off to a wet start. For a few select diseases, scouting now could pay off later in the season.
Most of the wheat in Maryland is somewhere between Feekes 5 (green up) and Feekes 6 (jointing), and most has received its first shot of nitrogen. This is the perfect time to scout your fields for foliar diseases like powdery mildew and the leaf blotch complex diseases.
Powdery mildew (Figure 1) is one of the more common diseases of wheat in our region, although it is typically a non-issue unless it gets out of hand. The fungus that causes powdery typically colonizes wheat in the fall when the plants are small, then goes dormant inside the plant over the winter. Green up is the perfect time to scout for powdery mildew because you will be able to see the powdery white tufts of fungus growing on your wheat plants (Figure 1). These signs are typically observed close to the crown deeper in the canopy and/or on plants that are in double-planted pinch rows or headlands. The disease is often more severe on over-fertilized fields, too. It is good to scout for the presence of powdery mildew now, but do not treat until the wheat begins to joint. Powdery mildew will not begin actively growing until the wheat plant comes out of its winter slumber and begins rapid growth (jointing, Feekes 6), and fungicides have little-to-no activity on dormant fungi. Instead, hold off on a fungicide application until your second nitrogen application at jointing. If you only notice a few sporadic instances of powdery mildew now, you may not even need to treat at jointing, especially if weather conditions become warm and dry. If you decide to hold of on a Feekes 6 application, you’ll still want to keep an eye on it, especially as the flag leaf emerges. The top three leaves, especially the flag leaf, contributes to nearly all of your yield.
Also, know your wheat variety because there are significant differences in resistance and tolerance. Data from University of Maryland, University of Delaware, and Virginia Tech can help you determine your wheat’s susceptibility. In addition, varieties containing the pm6 resistance gene have broken down and are no longer providing adequate resistance here in the mid-Atlantic region, so consider those varieties susceptible.
Similar management should be taken against the leaf blotch complex diseases. If you find them now, hold off on a fungicide application (if at all) until at least Feekes 6. And again, protecting the flag leaf is your main priority, so if the disease is slow to progress due to inadequate weather conditions or host tolerance and the disease is present at low levels, then a fungicide application at Feekes 6 may not be warranted at all. Also, the fungicides we commonly use to manage Fusarium head blight/head scab will also work on powdery mildew and the leaf blotch complex; so our fungicide applications at early flowering typically do a good job at keeping these diseases from progressing to the flag leaf.
For help with identifying diseases on wheat, you can send samples to the University of Maryland Plant Diagnostic Lab, or call your local Extension agent.
Andrew Kness, Agriculture Agent | akness@umd.edu University of Maryland Extension, Harford County
Depending on where you are in the state, small grains may have gotten off to a slow start or may have not established well enough in the fall to make a productive 2021 wheat crop. As wheat approaches jointing and we approach planting season, it may be a good idea to consider evaluating your wheat stands to help you determine if you should keep the crop for grain vs a cover crop, consider alternate uses, or terminate it to replant a different crop.
In order to accurately determine wheat stands you will need a yard stick (or any three-foot long stick) and a calculator. Place the stick along a row and count the number of plants in that three-foot section. Record this number and repeat this several times at random locations across the field that are representative of the field as a whole. I would recommend doing this at 15-25 locations to get an accurate average. Take your average and multiply it by four. Divide this number by your row width (in inches). The equation looks like this:
Example:
Plants per 3 ft. of row: (48+41+38+36+28+51+42+39+48+43+18+29+56+49+45)/15 = 40.7
(40.7 x 4)/7= 23.6 plants per sq. ft.
Alternatively, if your wheat is broadcast or flown on, you can calculate the number of plants per square foot by counting the number of plants in a 1 ft. x 1 ft. square or any other standardized form of measurement as long as you’re consistent (for example, you could use a hula hoop; just calculate it’s area).
To achieve maximum yield potential, stand density should be at least 22 plants/sq. ft. You may want to consider alternatives for stands fewer than 12-14 plants per square foot.
Attachedis the summary for the January 2021 WASDE.
This is all good news for farmers who still have crops in storage.
Corn
Yield estimate was adjusted down 0.5 bushels per acre from 175.8 to 172. This decreased production estimate 325 million bushels. Beginning stocks were adjusted down 76 million bushels. The two combined for a decrease of 400 million bushel in the supply estimate. Domestic demand estimate was decreased by 150 million bushels and the export estimate was decreased 100 million bushels for a decrease in the total demand estimate of 250 million bushel. The net effect of supply and demand decreased ending stocks 150 million bushels and the stocks-to-use ratio from 11.5% to 10.6%. This is the lowest stock-to-use ratio since the 2013/14 marketing year. These anticipated changes have been reflected in the market as March futures price for corn has skyrocketed almost $1.00/bu. this past month from $4.20/bu. on December 8 to a high of $5.17/bu. on January 12.
Soybeans
Yield estimate was adjusted down 1.2 bushels per acre from 50.7 to 50.2. This resulted in a decrease of 35 million bushel in estimated 2020/21 supply. Beginning stocks were adjusted up 2 million bushel and imports were adjusted up 20 million bushel. On the demand side, crushings were adjusted up 5 million bushels, exports were adjusted up 30 million bushels, and residual was adjusted down 13 million bushels. These adjustments resulted in a 21 million bushels increase in the total demand estimate. The resulting estimate of ending stocks was decreased by 35 million bushels decreasing the stocks-to-use ratio to a very low 3.1%. This is the lowest stock-to-use ratio since the 2013/14 marketing year. The March futures price for soybeans has spiked $2.71/bu. in the past month from $11.72 on December 8 to $14.23 on January 12.
Wheat
There were no adjustments in the supply side estimates. The demand estimate was increased by 26 million bushel (seed & feed) so the ending stock estimate was adjusted down 26 million bushels and the stocks-to-use ratio decreased from 40.8% in December to 39.1% in January. March wheat futures prices increased from $5.70/bu. on December 8 to $6.65/bu. on January 12.
Andrew Kness, Agriculture Agent University of Maryland Extension, Harford County
Temperatures have been unseasonably mild in our region in October and November. Warmer fall temperatures can make for an enjoyable harvest but can also force accelerated development in our small grains, resulting in excessive tillering and top growth. While this increase in vegetation may be less of a concern with a small grain grown strictly as a cover crop, it can be cause for concern for wheat or barley planted for grain.
Wheat and barley need adequate but not excessive growth in the fall in order to maximize overwintering survival and yield in the spring. Plants that have 1-3 tillers and 4-5 leaves should overwinter well and have excellent yield potential going into the spring. In normal years the plants have enough time between the Hessian fly-free date and winter dormancy to achieve 1-3 tillers. However, excessive tillering and top growth can occur if seeding occurs too early, and/or if temperatures in November are unseasonably warm. Rapid and excessive fall growth can be exacerbated if there are high residual nitrogen levels left in the field from the previous crop. This year I have seen some early planted barley that is approximately 10-12 inches tall now, which may cause some issues this spring.
Excessive top growth in the fall creates a stressful environment that can decrease the percentage of plants and tillers that survive the winter, and in extreme cases the growing point of the main stem can emerge (or be very close to emerging) from the soil. In this case, entire plants can die due to the freeze-thaw cycle. The main stem and first tiller of the plant contributes the most to yield, so if they die yield can be severely reduced; although if there are enough healthy secondary tillers, some yield can be recuperated. Excessive top growth also promotes the development of foliar diseases such as powdery mildew, which if established early, can create a real problem in the spring. Other snowmold diseases can cause serious plant injury to these larger, lush plants. Likewise, aphids are attracted to larger, greener plants; so excessive top growth will attract more aphids, which can vector Barley Yellow Dwarf Virus (BYDV). This would be especially true for seeds planted without an insecticide seed treatment for aphids. Another insect that likes larger plants is the Hessian fly, which will lay eggs in susceptible varieties of plants before the frost-free date (anywhere from September 30-October 13 depending on where you are in Maryland and the year/weather). These infestations can cause serious lodging issues in the spring. Finally, larger plants transpire more water than smaller plants. This means that if we have a dry winter/spring, the larger plants will have depleted the soil moisture faster than the smaller plants and the potential for drought stress increases (although our recent springs have not been dry).
If you have a situation where your wheat or barley for grain is putting on excessive growth, you may want to evaluate the stand after the spring thaw. If the stand is severely damaged, you might consider leaving that field as a cover crop rather than taking it to harvest. Stands with fewer than 15 plants per square foot are likely to have significant yield reductions. If you have cattle you could also try to graze the field in the fall (as long as it’s not too wet); or alternatively, mow the field to keep the growth at bay. Obviously this practice has significant costs associated with it, but has been done with success in our region.
Emily Zobel, Agriculture Agent Associate University of Maryland Extension, Dorchester County
Soybean: Late double-crop soybean fields that are next to corn may still be at risk for defoliation and stink bug. The thresholds for stink bugs through R6 are 5 bugs per 15 sweeps, and defoliation in R6 needs to be approaching 20% before treatment is advised.
Wheat: The Hessian fly is not a significant pest in the Mid-Atlantic States because small grains usually are planted after the adult “fly-safe” date. If planting early, consider planting a resistant variety, since there is no insecticidal control that can be applied once the field becomes infested. The “fly-safe” date for areas across Maryland is the following: September 30 for the Mountain region, the first week in October for the Piedmont region, and the second week in October for the coastal plains.
Spotted Lanternfly adults are out and are laying eggs. If you are moving equipment in and out of quarantine areas, please check equipment for this invasive insect to reduce the spread. While it has been found in corn, soybean, and alfalfa, it is not considered a pest on these crops. However, their feeding has been harmful to grapes, hops, and tree fruits. If you observe any egg masses or insects which look similar to this, please try to collect them, and inform the Maryland Department of Agriculture at (410) 841-5920 or DontBug.MD@maryland.gov as soon as possible. For more information about spotted lanternfly can found on the MDA website.
There was an adjustment of a minus 20 million bushel to the 2019/20120 crop estimate which carried forward to the beginning stocks of the 2020/2021 crop year. Yield estimates for the 2020/21 crop year were adjusted up from 178.5 bushels per acre estimated in July to 181.5 bushels per acre current estimate. These two changes resulted in an increase of 258 million bushel in estimated 2020/21 supply. On the demand side, feed & residual and export estimates were increased by a total of 149 million bushel. The resulting estimate of ending stocks was increased by 108 billion bushel increasing the Ending stocks to use ratio to 18.7% from 18.1% in July. These bearish numbers continue to suppress prices. Futures market prices have been in decline since the up tick in prices at the end of June/beginning of July so today’s WASDE report had little effect on prices and December corn settled at $3.27 per bushel.
Soybeans
There was a slight decrease of 5 million bushel to the 2019/20120 crop estimate ending stocks which carried forward to the beginning stocks of the 2020/2021 crop year. Yield estimates for the 2020/21 crop year were adjusted up from 49.8 bushels per acre estimated in July to 53.3 bushels per acre current estimate. These two changes resulted in an increase of 285 million bushel in estimated 2020/21 supply. On the demand side, the crushing estimate was adjusted up 20 million bushel, export estimate was adjusted up by 75 million bushel and residual was adjusted up by 5 million bushels. The resulting estimate of ending stocks was increased by 185 million bushels increasing the Ending stocks to use ratio to 13.7% from 9.8% in July. Just like corn, soybean futures market prices have been in decline since the up tick in prices at the end of June/beginning of July so today’s WASDE report had little effect on prices and November soybeans settled at $8.83 per bushel.
Wheat
There were minor adjustments in wheat supply and demand resulting in a 17 million bushel decrease in ending stocks estimate decreasing the Stocks-to-use ration from 45.6% in July to 44.3% in August. There was little movement in wheat prices and September 2020 SRW prices settled at $4.90.