Andrew Kness, Agriculture Agent University of Maryland Extension, Harford County
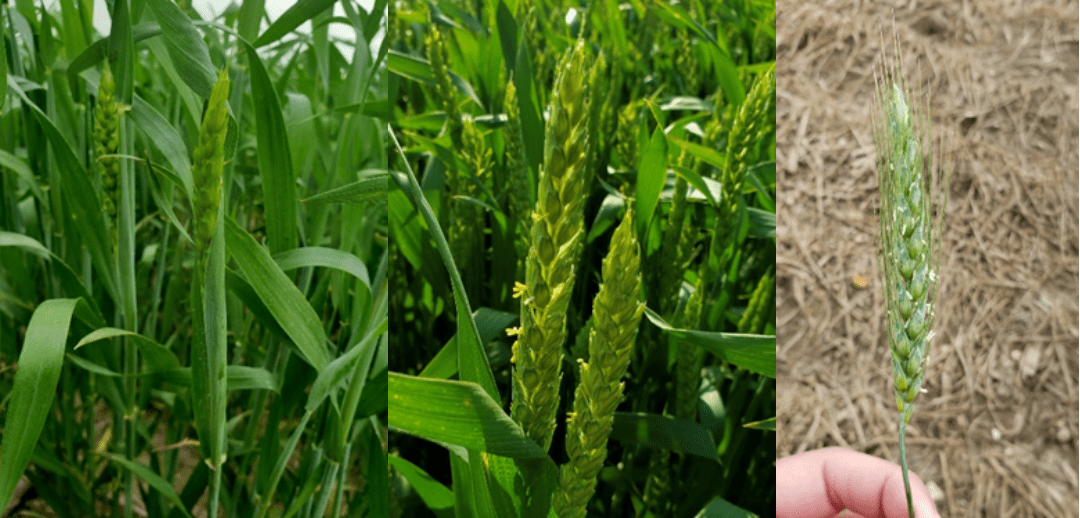
Wheat is progressing rapidly across the state due to our mild winter. In the coming weeks, wheat will begin flowering and entering the most critical management stage for Head Scab or Fusaruim Head Blight (FHB). Scout fields as heads emerge and determine when they start to flower (yellow anthers emerging from the middle of the spike). At this stage you will need to make the call to apply a fungicide or not.
Figure 1. Left: Feekes 10.3. Middle: Feekes 10.5.1 (yellow anthers beginning flowering). Right: 4 days after anthesis (white anthers post flowering). Image: A. Koehler, Univ. of Delaware.
Right now, FHB risk is very low across the region, mostly due to the cool nights we are experiencing (Figure 2). However, conditions can turn favorable for FHB very quickly, so don’t fall asleep on it! FHB can sporulate and infect flowering spikes at temperatures in the 50s as long as adequate moisture and humidity is present.
Figure 2. Head scab risk to susceptible winter wheat varieties as of April 21, 2020.
If conditions turn wet, humid, and above 50 degrees at flowering, FHB risk will be high and you will have about a 5 day maximum window after Feekes 10.5.1 (start of flowering) to make a fungicide application to suppress DON vomitoxin. Optimal timing for a fungicide application is at Feekes 10.5.1 and up to 5 days after. University research has indicated that earlier applications at heading (Feekes 10.3-10.5) do not consistently reduce DON levels in the grain as compared to applications made at or shortly after flowering.
Even though it may seem a bit early and cool, continue to monitor the Scab Risk Tool (www.wheatscab.psu.edu/) to help you assess the risk of developing FHB in your wheat crop so that you’re not taken by surprise.
For fungicide recommendations and other application recommendations, click here.
Shannon Dill, Principal Agriculture Agent University of Maryland Extension, Talbot County
The University of Maryland Extension has updated extension.umd.edu/grainmarketing site with new input data and spray programs for the 2020 field crop budgets.
Crop Budgets
Cost of production is very important when making decisions related to your farm enterprise and grain marketing. Enterprise budgets provide valuable information regarding individual enterprises on the farm. This tool enables farm managers to make decisions regarding enterprises and plan for the coming production year. An enterprise budget uses farm revenue, variable cost, fixed cost and net income to provide a clear picture of the financial health of each farm enterprise.
The 2020 Maryland enterprise budgets were developed using average yields and estimated input cost based upon producer and farm supplier data. The figures presented are averages and vary greatly from one farm and region to the other. It is therefore crucial to input actual farm data when completing enterprise budgets for your farm.
How to Use University Enterprise Budgets:
The enterprise budgets can be used as a baseline for your operation. Make changes to these budgets to include your production techniques, inputs and overall management. New spray programs were added for herbicide resistant weeds.
The budgets are available electronically in PDF or Excel online at www.extension.umd.edu/grainmarketing. Use this document as a start or reference to create your crop budgets. If you have problems downloading any of these budgets, contact information is located on the website.
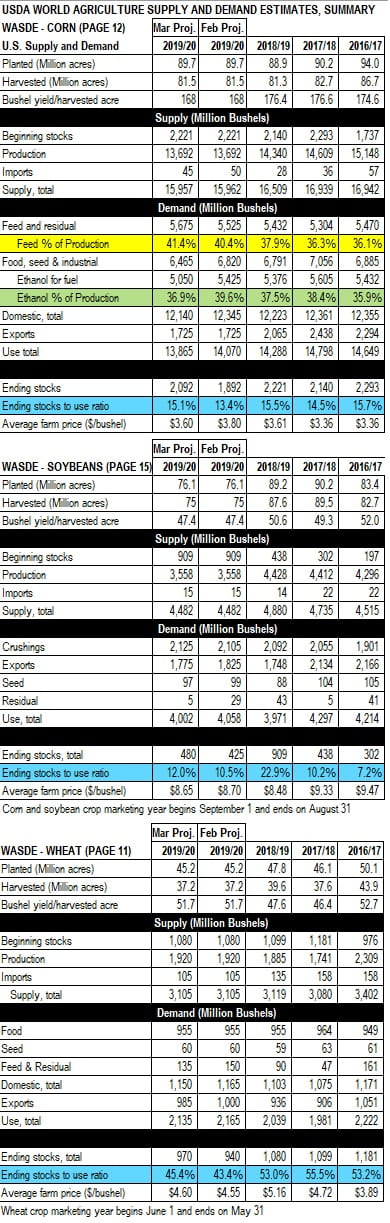
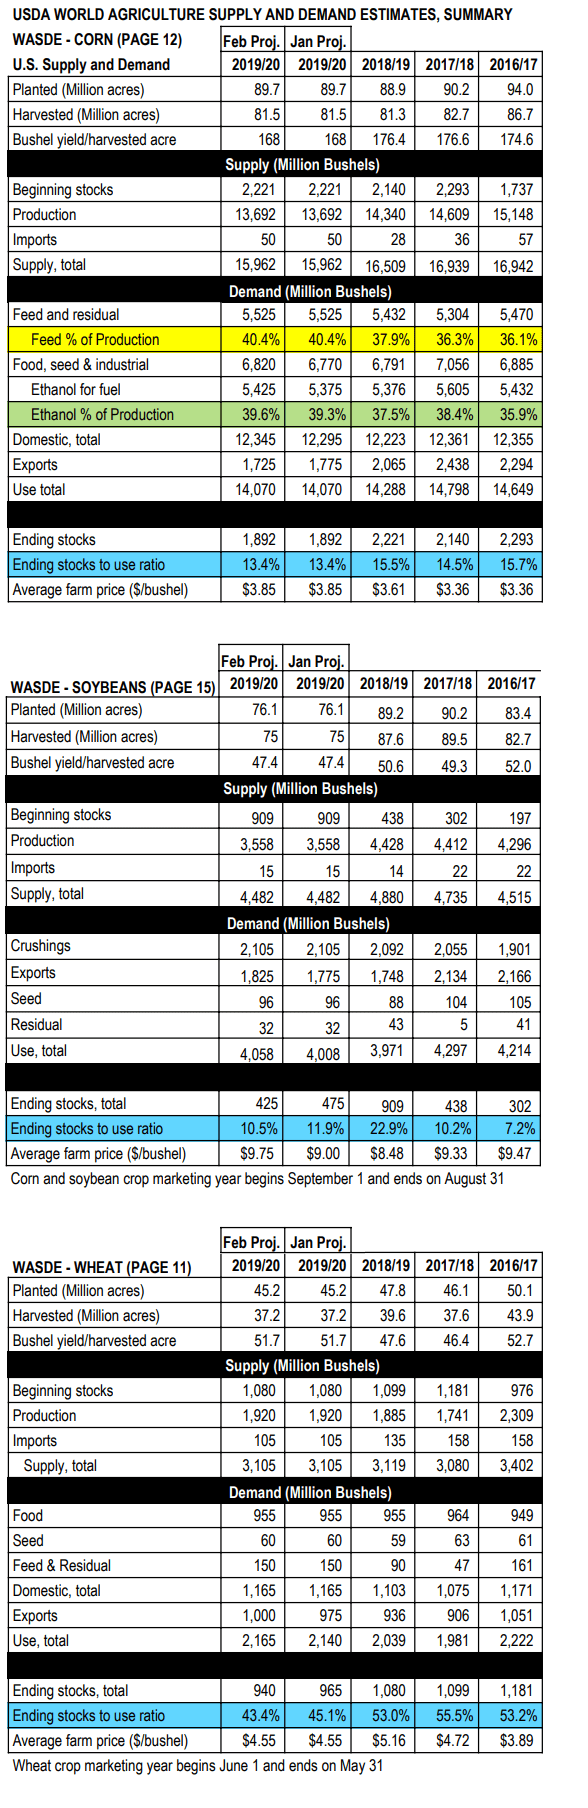
The following is a summary of the April 9 WASDE published on April 9. As expected, ethanol production was down significantly from the March report due to factors related to COVID-19 and the overproduction of crude oil by Russian and Saudi Arabia. These factors decreased demand for corn by 375 million bushel. This was partially offset by an increase in the estimate for feed and residual of 150 million bushel. The net effect is an increase of 200 million bushel of corn in ending stocks and an associated increase in the ending stocks to use ratio from 13.4% to 15.1%
Soybean exports were down 50 million bushel and with other minor adjustments increased the ending stocks from 425 to 480 million bushel and an increase in the stocks to use ratio from 10.5% to 12.0%.
Wheat feed and exports were down, increasing the ending stocks from 940 to 970 million bushel and an associated increase in the ending stocks to use ratio from 43.4% to 45.4%.
These changes in estimates were mostly expected so they had little effect on futures prices.
Kelly Hamby, Terry Patton, and Galen Dively Department of Entomology, University of Maryland College Park
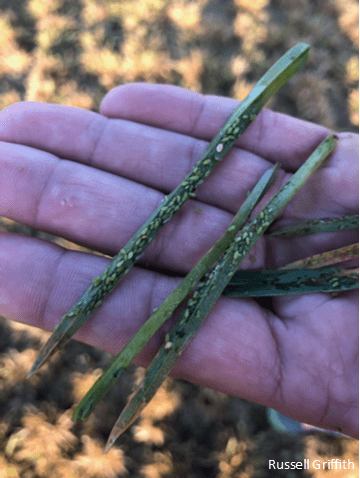
Summary. Weather stations in Baltimore, MD recorded the 3rd warmest winter on record in 81 years from Dec 2019 to February 2020, with 10% of our 30 year average snowfall (NOAA National Climate Report). Insects that overwinter as immatures or adults in above-ground protected areas are typically favored by mild winters, especially species that are not cold-hardy because much of the population would typically die during the winter. However, the lack of snowfall can also reduce overwintering survival because snow can insulate against freezing temperatures. Mild winter conditions favor green bug aphids and winter grain mite outbreaks in small grains and orchardgrass, and these pest populations can build rapidly. Fortunately, mild winters also favor many beneficial natural enemies. Greenbug aphid outbreaks have been observed in central Maryland orchardgrass (see Figure 1), and greenbugs have also been observed in Delaware. Overall, aphid populations have been spotty in Delaware and promising natural enemy activity has been observed (UD Weekly Crop Update, March 20). However, close surveillance is necessary when greenbug is the predominate species because greenbug injects toxic saliva during feeding and can be very destructive. It is important to carefully scout your fields for aphids multiple times to determine whether populations are building or crashing on your farm. Management interventions may be necessary to prevent economic losses. Winter grain mites may also be a problem this year and scouting close to the soil surface is necessary to catch this issue in a timely manner.
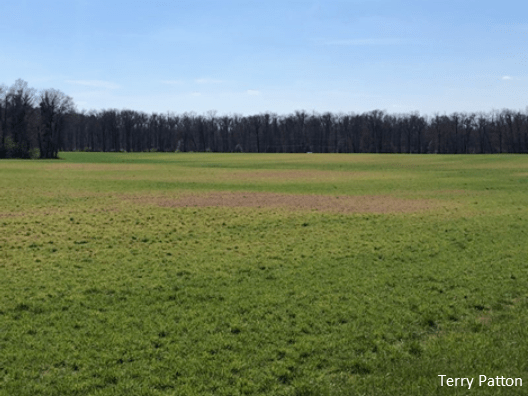
Figure 1. Heavy aphid populations have been observed in orchardgrass in central Maryland.Figure 3. Aphid damage to orchardgrass in central Maryland.
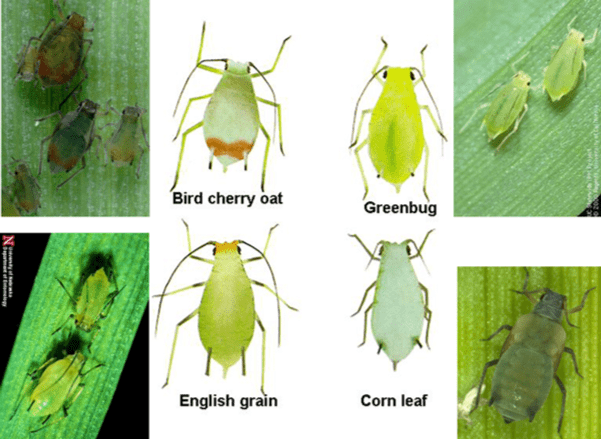
Cereal Aphids and Greenbugs. Multiple species of aphid occur in Maryland small grains and orchardgrass (see Figure 2) and aphids can vector barley yellow dwarf virus. Bird-cherry oat aphids vector the most severe strain and may need to be managed in the fall to prevent damage from barley yellow dwarf, especially in intensive management wheat. Although the direct damage from aphid feeding is generally similar across species, it is especially important to record species if greenbugs are present. Greenbug saliva contains enzymes that break down cell walls, so their feeding is most damaging. They initially cause spotting on the leaf followed by discoloration and eventual leaf and root death if feeding continues. Grain cultivars vary in their tolerance for greenbug damage. One of the first noticeable symptoms of aphid outbreaks are circular yellow to brown spots with dead plants in the center (see Figure 3); however, aphid damage may be confused with moisture stress and/or nitrogen deficiency so make sure to scout for aphids especially in areas that are showing stress symptoms. Scout a minimum of 1 linear row foot in 10 sites, the more row feet and locations the better, and estimate the number of aphids per foot of row. The rule of thumb treatment threshold for small grains is to treat if counts exceed 150 per linear foot throughout most of the field, with few natural enemies detected (e.g., mummy aphids, lady beetles, fungal infections). One natural enemy to every 50 to 100 aphids can be enough to control the population. This threshold may be lower if greenbugs are the predominant aphid and greenbug populations should be carefully monitored. Foliar insecticides including pyrethroids (Group 3A), neonicotinoids (Group 4A), and organophosphates (Group 1B) can be used to control aphids.
Figure 2. Common cereal aphids. Notice color and length of antennae and cornicles (tail pipes). Greenbugs are light green with a dark green stripe, with black tips of the legs, cornicles, and antennae. Photos: Various Extension websites.
Winter Grain Mite. Winter grain mites are a cool season pest of small grains and orchardgrass that cause a silvery leaf discoloration from feeding damage that punctures individual plant cells. Feeding can also stunt plants. Winter mites have a dark brown to black body with bright reddish-orange legs (see Figure 4). Somewhat uniquely, their anal opening is on the upper surface and can appear as a tan to orange spot that is more visible under magnification. Two generations of winter grain mite occur per year and are active from the fall to early summer. They oversummer in the egg stage, with the first generation hatching around October and adult populations peaking in December or January. The second generation peaks from March to April and produces the oversummering eggs. Because spring eggs result in fall populations, rotating the crop away from grasses and managing wild grasses around field edges can be helpful to reduce populations. Adult activity occurs when temperatures are between 40 and 75°F, and they prefer cool, cloudy calm weather. Therefore, winter grain mites are easier to see during these conditions, and more likely to be higher on the plant during the early morning or late evening. If you are scouting on a hot, dry day or in the middle of the day, you should check under residue where the soil is moist, and may need to dig 4 or 5 inches into the soil to find the mites. Winter grain mite does not typically cause economic damage, and no thresholds have been developed. If large portions of a field show symptoms and mites are present, treatment may be warranted. No products are specifically labeled for winter grain mite; however, products labeled for brown mite such as dimethoate (Group 1B, in wheat only) are likely to be effective. Warrior II (pyrethroid, Group 3A) may also provide suppression.
Dr. Alyssa Koehler, Extension Field Crops Pathologist University of Delaware
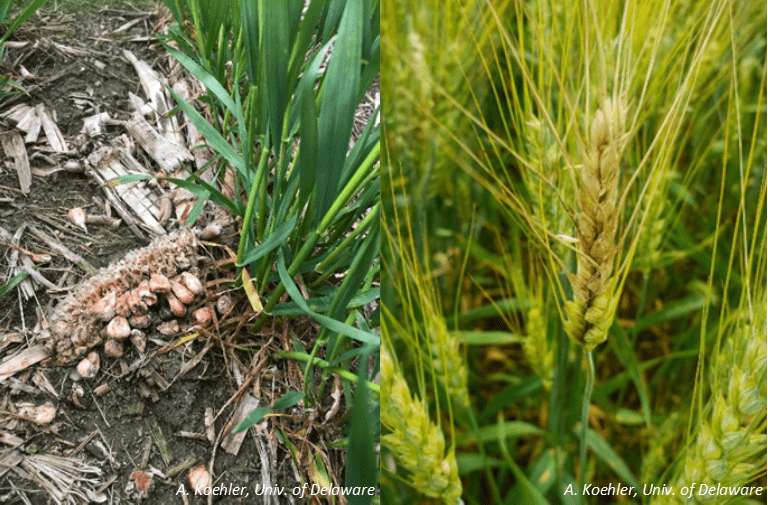
With the mild winter, wheat and barley are moving right along. Planting behind corn is common in our region, but this maintains inoculum for Fusarium Head Blight (FHB). Fusarium species that cause FHB can infect both corn and small grains. Walking through fields with corn stubble, you may see orange growth on old debris (Figure 1). Wet spring conditions favor fungal sporulation that can lead to infected wheat heads. As the pathogen grows on debris, spores are released that can be rain dispersed or moved through air currents. As the grain is flowering, spores land on the head or anthers, colonize these tissues, and move into the grain head. Once inside the grain, water and nutrient movement is disrupted, which results in the bleached florets we associate with FHB (Figure 2). Shriveled and wilted “tombstone” kernels can reduce yield and result in grain contaminated with mycotoxins. Deoxynivalenol (DON), also referred to as vomitoxin, is a health hazard to humans and animals. Wheat heads colonized later in development may not show dramatic symptoms, but can still have elevated DON.
Figure 1 (left). Corn stubble with Fusarium sporulation that can contribute to FHB in wheat. Figure 2 (right). Wheat head showing bleached florets from Fusarium Head Blight.
As we approach heading and begin to think about in-season disease management strategies, a well-timed fungicide application can help to reduce disease severity and DON levels. It is important to remember that fungicides can help to reduce disease levels and DON (traditionally around 50% reduction on a susceptible variety), but they do not eliminate FHB or DON. To try to maximize the efficacy of fungicides, it is important to apply at the correct timing. Fungicides for FHB are most effective when applied during flowering in wheat and at head emergence in barley. The Fusarium Risk Assessment Tool (www.wheatscab.psu.edu) is a forecasting model that uses current and predicted weather forecasts to predict FHB risk. The model is currently being configured for this season and should be accessible at the link above by the end of the first week of April. Historically about 70% accurate, this tool aids in assessing FHB risk as wheat approaches flowering and fungicide application decisions are made. The pathogen that causes FHB infects through the flower and rainfall 7 to 10 days prior to flower favors spore production and increases risk of infection. Optimal wheat fungicide application is at early flowering (10.5.1) to about 5 days after. Although new products like Miravis Ace can be applied earlier, it is still best to wait for main tillers to be at 10.5.1 or a few days beyond so that secondary tillers have a greater chance of being at 10.3-10.5.1. If you spray too early, heads that have not emerged will not be protected by the fungicide application. When wheat heads begin to flower, look for yellow anthers in the middle of the wheat head. When at least 50% of main stems are flowering, you will want to initiate fungicide applications. As the flowering period continues, anthers will emerge from the top and then the bottom of the wheat heads. Anthers can stay attached after flowering but usually become a pale white (Figure 3, next page). Triazole (FRAC group 3) fungicides that are effective on FHB include Caramba (metconazole), Proline (prothioconazole), and Prosaro (prothioconazole + tebuconazole). Miravis Ace (propiconazole + pydiflumetofen) offers a triazole + SDHI, FRAC group 7. As a reminder, fungicides containing strobilurins (QoI’s, FRAC 11) should not be used past heading because these fungicides can result in elevated levels of DON. Flat fan nozzles pointed 90° down are great at covering foliage but they do not provide good coverage on heads, which is the target for FHB management. Nozzles that are angled forward 30-45° down from horizontal (30 degrees is better than 45) or dual nozzles angled both forward and backward give better contact with the head and increase fungicide efficacy. For ground sprays, fungicides should be applied in at least 10 gallons of water per acre.
Figure 3. From left to right: Feekes 10.3, Anthesis; Feekes 10.5.1 (yellow anthers beginning flowering); 4 days after anthesis (white anthers post flowering). Image: A. Koehler, Univ. of Delaware.
Thinking beyond this season, an integrated approach can improve management of FHB and help to keep DON levels low. In your field rotation plan, avoiding planting small grains into corn residue will help to reduce the amount of initial inoculum in your field. If you have soybean fields that can be harvested early enough for a timely wheat planting, this rotation helps to break up Fusarium inoculum. In addition to rotation considerations, seed selection is another important piece of FHB management in wheat. There is no complete host resistance against FHB, but you can select wheat varieties with partial resistance. The University of Maryland sets up a misted nursery to compare FHB index and DON levels across local wheat varieties to aid in variety selection decisions. Results from 2019 can be found at https://scabusa.org/pdfs/UMD_Misted-Nursery_Factsheet-2019.pdf. Remember that these trials are conducted under extreme disease pressure and you want to look at relative DON performance. Unfortunately, barley does not have any resistance to FHB. In UMD’s 2019 trial, Calypso had the lowest DON content in local barley varieties tested.
Attached is a summary for the February WASDE published Tuesday. There was a 50 million bushel increase in the estimate of corn use for ethanol but this increase was offset by a 50 million decrease in the estimate of corn exports and so there was no change in supply, demand or ending stocks.
There was a significant 50 million bushel increase in the estimate for soybean exports. With all other supply and demand factors unchanged this decreased the stocks to use ratio from 11.9% to 10.5%. However, this was anticipated so there was no significant increase in Soybean futures on Tuesday.
There was a 25 million bushel increase in the estimates for wheat exports with all other supply and demand factors unchanged. However with the large ending stocks of wheat, this change was relatively insignificant.
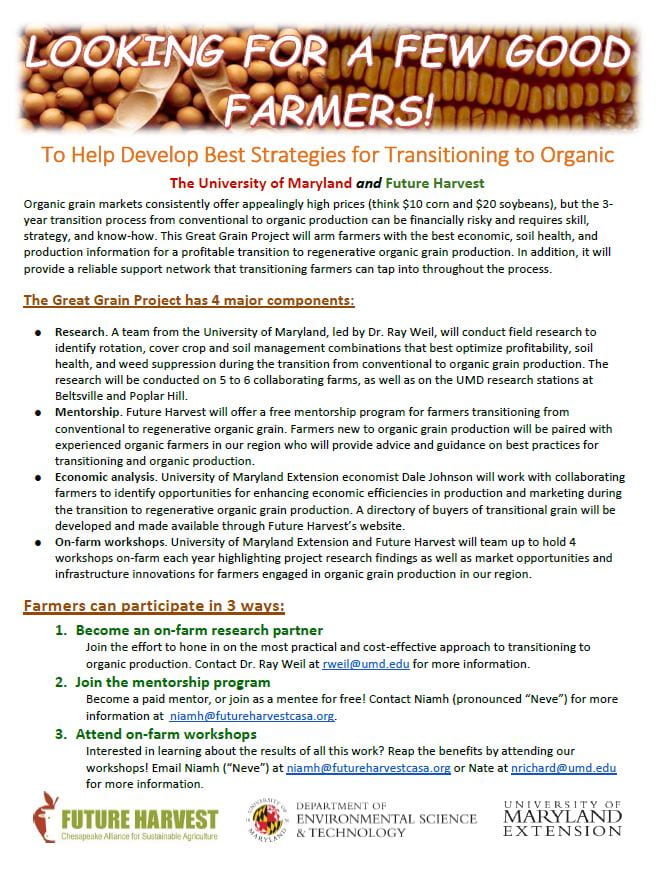
Researchers at the University of Maryland are looking for farmers interested in partnering with them on a project to help develop strategies for transitioning to organic grain production. Please see the attached flier for details. Contact Dr. Ray Weil for additional information (rweil@umd.edu).
1,2Cara Peterson, 2Steven Mirsky, 1Kate Tully, 1,2Victoria Ackroyd 1Department of Plant Science and Landscape Architecture, University of Maryland 2United States Department of Agriculture, Agricultural Research Service, Beltsville
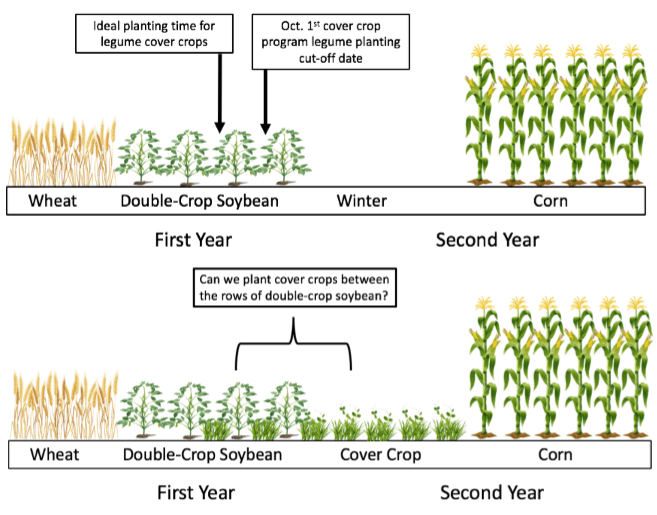
The mid-Atlantic region has the highest percentage of arable acreage in cover crops in the United States, with some reports placing Maryland and Delaware as the two states with the highest percentage of total cropland planted with cover crops (Wade et al., 2015; Hamilton et al., 2017). However, the majority of producers in the region are only using grass cover crops, since legumes require earlier planting dates in order to over-winter (Mirsky et al., 2011; Clark, 2012). Farmers in this region have success with legume cover crops when planting them after wheat harvest or frost-seeding in the spring. However, most mid-Atlantic crop rotations include double-crop soybeans planted after wheat, which limits opportunities for establishing a legume cover crop. Low legume adoption is particularly problematic as farmers could use this cover crop before corn to maximize the opportunity for nitrogen fixation benefits.
Figure 1. (Top) A typical mid-Atlantic crop rotation, with double-crop soybeans in the field at the pivotal points for establishing a successful legume cover crop. (Bottom) Proposed crop rotation scheme for interseeding a cover crop between 30-inch soybeans. The cover crop over-winters and is terminated before corn planting in the spring.
Some farmers interseed cover crops into growing cash crops to overcome this timing challenge. Current options for planting cover crops into standing corn and soybean include both aerial broadcasting via airplane and adapted high-boy sprayers. However, these two techniques often result in poor establishment due to low seed-to-soil contact and seed predation by rodents and birds (Hively et al., 2001; Baker and Griffis, 2009; Wilson et al., 2013).
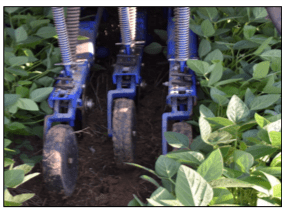
Figure 2. Interseeding cover crops with three planting units between 30-inch soybean rows.
To address the issue of planting cover crops into standing cash crops, our mid-Atlantic team ran numerous trials of an InterSeeder grain drill (InterSeeder Technologies, LLC; Fig. 2). Engineered by the Pennsylvania State University, this drill plants three rows of cover crops between 30-inch rows of standing cash crops. Field trials of this InterSeeder have been conducted in corn, as well as full-season soybeans, at various sites in the region with mixed results (Curran et al., 2018; Wallace et al. 2017). In Maryland, interseeding into full-season corn was moderately successful, whereas cover crops did not perform well in full season beans. However, exploratory research in Maryland identified wide-row double crop soybeans as a viable option for interseeding. The success of seeding grass-legume mixtures into 30-inch double-crop soybeans has led to an expanded on-station research program.
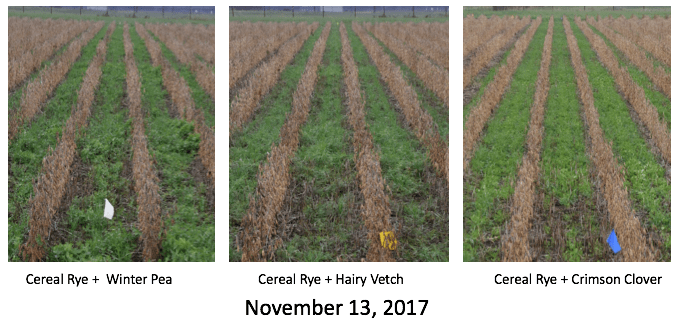
New Field Trials. Field trials with five different interseeded cover crop treatments were conducted to determine the optimal legume cover crop species to interseed in mixture with cereal rye and if interseeding a cover crop mixture affected wide-row double crop soybean yields. The five different cover crop treatments included: cereal rye alone, cereal rye independently mixed with four different legumes (hairy vetch, crimson clover, red clover, and winter pea), and a no cover crop control (Table 1).
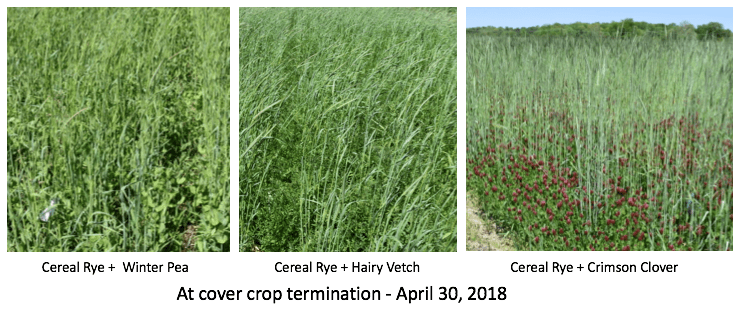
Double-crop soybeans planted in June were then interseeded with the cover crop treatments in early September 2017 and late August 2018. The double-crop soybeans were harvested in November for 2017 and later in 2018 (December) due to wet field conditions. The interseeded cover crop treatments grew throughout the winter and were terminated with herbicides in April 2017 and 2018 before planting corn.
In an ideal interseeding scenario, the cover crop is planted as the double-crop soybeans are beginning to reach full canopy in early September. That way, the cover crops only have to survive a few weeks under the low light conditions of a soybean canopy until leaf drop. Once the soybean canopy is gone, the cover crops continue to grow but do not interfere with soybean harvest.
Insights from Interseeding Trials
Cereal rye + crimson clover produced the highest average cover crop biomass. The cereal rye + crimson clover fall 2017 seeding produced an average of 4,980 lbs per acre of biomass while the 2018 seeding produced 3,950 lbs per acre by the spring of 2019. Cereal rye + hairy vetch and cereal rye + winter pea reached similar levels of biomass in two out of the three field sites where the cover crops survived under the soybean canopy.
Interseeding did not decrease yield. There was no pattern of soybean yield differences between the 30-inch wide row double-crop soybeans that had or hadn’t been interseeded. Likewise, there were very minimal differences in soybean yields between the cover crop treatments.
Interseeding did not affect soybean grain quality. Green cover crop plant material was not found in any soybean grain subsampling. Moisture levels remained consistent, with very slight variance across the field as expected in a normal cropping system.
Row orientation matters. Out of the five trial sites, two of the cover crop plantings did not survive under the soybean canopy. Interestingly, the three field sites with strong cover crop survival rates had rows oriented in roughly the same direction: East-West or Southeast-Northwest. The two field sites where the cover crops sprouted but did not survive under the soybean canopy in the fall were on a perpendicular row orientation of Northeast-Southwest.
Row Spacing Considerations. The InterSeeder requires a 30-inch row spacing, while most double-crop soybean fields are planted in narrower rows of 15 inches or less. To account for the differing production practices, these field trials also included simple yield comparisons of 30- and 15-inch row double-crop soybeans. In the row spacing (15- vs 30-inches) trial, results were mixed. There was a yield penalty for wide row spacing in 2017, but not in 2018.
While the benefits of narrow row spacing have been well documented in full season beans, less is known about the potential advantages in double crop soybeans. We speculate that optimal production years enhance the effect of row spacing. For example, 2017 was a better soybean year compared to 2018 across the mid-Atlantic region. Higher levels of precipitation in 2018 than 2017 could have damaged yields. Previous research indicates that in lower yield years or for late-planted soybeans, the benefit of planting in 15 inch rows over 30 inch rows is lost (Alessi and Power, 1982; Hodges et al., 1983; Boquet, 1990; Weaver et al., 1990, Oplinger et al., 1992; Pederson and Lauer, 2003, Whaley et al., 2015).
Future Research. Nitrogen content analysis of the interseeded cover crop biomass is currently underway. Next, the research team will analyze how the following year’s corn crop responded to the interseeded cover crop mixtures.
References
Alessi, J., and J.F. Power. 1982. Effects of plant and row spacing on dryland soybean yield and water-use efficiency. Agronomy Journal 74:851–854. D.o.i.:10.2134/agronj1982.00021962007400050019x
Baker, J. M., and T. J. Griffis. 2009. Evaluating the potential use of winter cover crops in corn-soybean systems for sustainable co-production of food and fuel. Agricultural and Forest Meteorology, 149(12), 2120–2132. D.o.i.:10.1016 j.agrformet.2009.05.017
Boquet, D. J. 1990. Plant population density and row spacing effects on soybean at post-optimal planting dates. Agronomy. J.: 59–64. D.o.i:10.2134/agronj2009.0219.
Clark, A. (Ed.). 2012. Managing cover crops profitably (Third ed.). College Park, MD: Sustainable Agriculture Research and Education.
Curran, W.S., R.J. Hoover, S.B. Mirsky, G.W. Roth, M.R. Ryan, V.J. Ackroyd, J.M. Wallace, M.A. Dempsey and C.J. Pelzer. 2018. Evaluation of cover crops drill interseeded into corn across the mid-Atlantic region. Agronomy Journal 110, 435–443. D.o.i.:10.2134/agronj2017.07.0395
Fisher, K. A., B. Momen,, and R.J. Kratochvil. 2011. Is broadcasting seed an effective winter cover crop planting method? Agronomy Journal, 103(2), 472–478. D.o.i.:10.2134/agronj2010.0318
Hively, W.D. and W.J. Cox. 2001. Interseeding cover crops into soybean and subsequent corn yields. Agronomy. J. 93:308-313. D.o.i.:10.2134/agronj2001.932308x
Hodges, H.F., F.D. Whisler, N.W. Buehrig, R.E. Coast, J. Mcmillian, N.C. Edwards, and C. Hovermale. 1984. The Effect of Planting Date Row Spacing and Variety on Soybean Yield in Mississippi (Bulletin 912). Report prepared for the Mississippi Agricultural and Forestry Experiment Station.
Hamilton, A. V., D.A. Mortensen and M.K. Allen. 2017. The state of the cover crop nation and how to set realistic future goals for the popular conservation practice. Journal of Soil and Water Conservation. 72(5), 111-115A. DOI: 10.2489/jswc.72.5.111A
Mirsky, S.B., W.S. Curran, D.A. Mortensen, D.L. Shumway, and M.R. Ryan. 2011. Timing of cover crop management effects on weed suppression in no-till planted soybean using a roller-crimper. Weed Science 59:380–389
Oplinger, E.S. and B.D. Philbrook. 1992. Soybean planting date, row width, and seeding rate response in three tillage systems. Journal of Production Agriculture. 5: 94-99. DOI:10.2134/jpa1992.0094
Pedersen, P. and J.G. Lauer. 2004. Soybean growth and development response to rotation sequence and tillage system. Agronomy Journal 96(4), 1005–1012. D.o.i.:10.2134/agronj2004.1005
Wade, T., R. Claassen and S. Wallander. 2015. Conservation-Practice Adoption Rates Vary Widely by Crop and Region, EIB-147, U.S. Department of Agriculture, Economic Research Service. Available at https://www.ers.usda.gov/webdocs/publications/44027/56332_eib147.pdf?v=42403
Wallace, J.M., W. S. Curran, S. B. Mirsky, M.R. Ryan. 2017. Tolerance of interseeded annual ryegrass and red clover cover crops to residual herbicides in mid-Atlantic corn cropping systems,” Weed Technology, 31(5), 641-650.
Weaver, D.B., R.L. Akridge, and C.A. Thomas, C.A. 1991. Growth habit, planting date, and row-spacing effects on late-planted soybean. Crop Science (31) 805-810
Whaley, C., J. Adkins and P. Sylvester. 2015. Final report to Delaware soybean board: Evaluating the response of full season and double-cropped soybeans in narrow and wide rows to various soil moisture levels.
Wilson, M. L., J.M. Baker, and D.L. Allan. 2013. Factors affecting successful establishment of aerially seeded winter rye. Agronomy Journal, 105(6), 1868–1877.
Nicole Fiorellino, Extension Agronomist University of Maryland
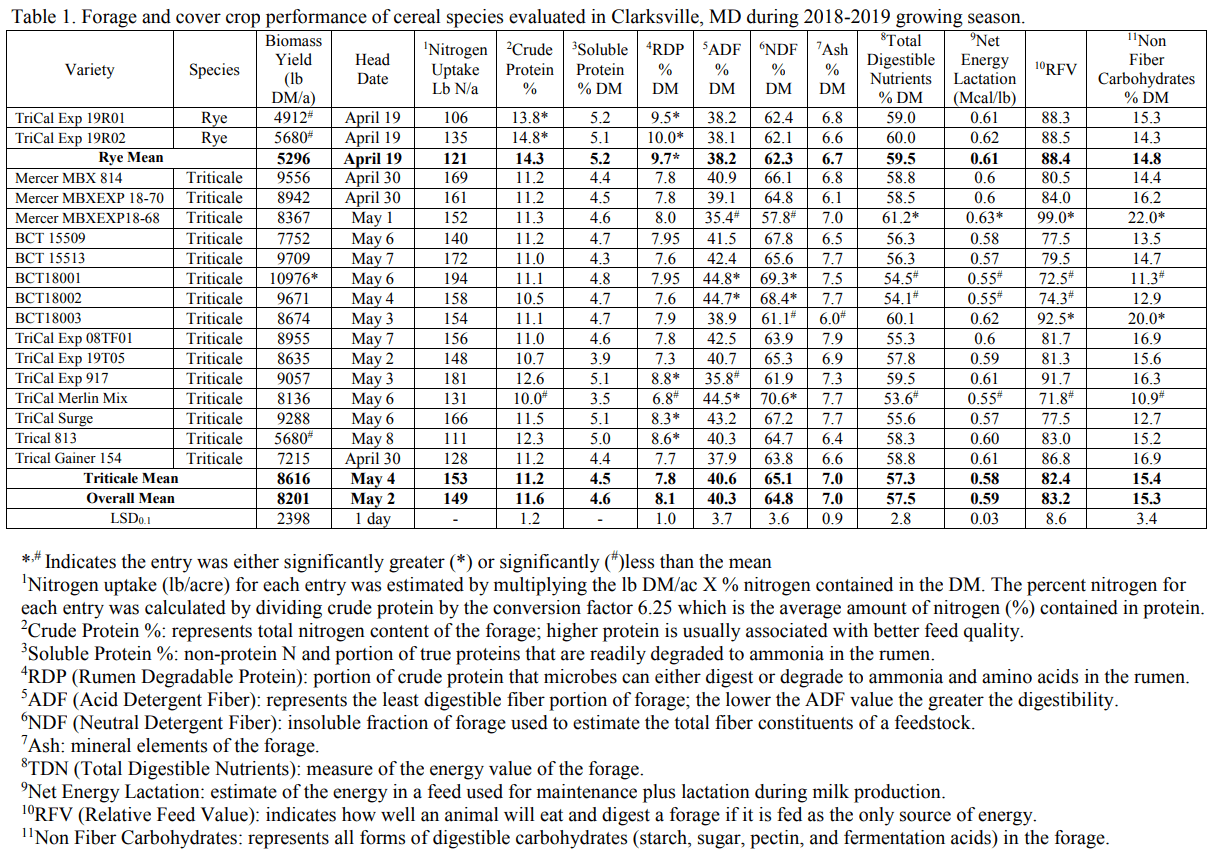
Dairy farmers are constantly looking for sources of forage to meet their feed needs. One source that many of this region’s dairy farmers utilize is the fall planting of cereal grains that are green-chop harvested the following spring. Among the cereal species used for this purpose are rye, triticale, barley, and wheat. Per the Maryland Cover Crop Program guidelines, cereal grains planted as a cover crop prior to November 5 and suppressed via green-chop in the spring are eligible for the grant payment for participation in the Cover Crop Program. In addition, per the Nutrient Management Regulations, a fall application of dairy manure is allowed to a field planted to a cereal cover crop.
Planting a cereal cover crop that will be green chop harvested fits well into the crop rotation used by many dairy farmers. The scenario that many follow is to plant the cereal cover crop following harvest of corn silage. Prior to planting the cover crop, an application of manure is made to the field. The subsequent planting of the cover crop provides incorporation of the manure into the soil. The fall and spring growth of the cover crop is supplied nutrients from the manure. At the same time, the cover crop provides protection to the soil from loss of nutrients via leaching and/or erosion. The objective of this study was to evaluate select varieties of cereal species for cover crop performance and forage production and quality.
Cereal varieties (17) representing two species (rye and triticale) were evaluated at Central Maryland Research and Education Center – Clarksville Facility. Three replications for each entry were planted using a randomized complete block experimental design. Planting date was October 10, 2018. The 3’ X 18’ plots were planted with a small plot planter with 6-inch spacing between each of the 7 rows. The germination percentage for each entry was used to calculate the seeding rate needed to establish 1.5 million seedlings. Good stands were established by late fall.
In order to compare forage quality among the entries that headed over a period of two weeks, the timing of the spring biomass harvest was when the entries had reached late boot to early heading stage of development. The two rye varieties were harvested on April 23, while the triticale varieties were harvest on either May 1 or May 6, basing on heading date (Table 1). Each harvest sample was collected by cutting the plants just above ground-level from three center rows of each plot from an area 2.5 feet in length and from two areas within the plot. The samples were placed into cloth bags and dried using a forced air dryer set at 60 C where they remained until sample water content was zero. Each sample was weighed and is reported as pounds of dry matter production per acre (Table 1). Each of the dried samples was ground through a 20-mesh screen using a large plant grinder. For each location, the ground biomass samples were sent to Cumberland Valley Analytical Laboratory for standard forage quality analysis.
Cover crop performance is measured by amount of biomass produced and the concentration of nitrogen in the biomass. These two factors were used to estimate nitrogen uptake (Table 1). There was no significant difference in nitrogen uptake among the varieties tested. A number of forage quality characteristics for these cereals was measured (Table 1). The descriptions of the various quality characteristic are described here and in the footnotes at the bottom of Table 1. Crude protein (CP) is the nitrogen content of the forage, with higher protein representing better feed quality. This value was used to calculate nitrogen uptake of each variety (Nitrogen content = % CP/6.25). Both rye varieties had significantly greater CP than the overall mean, with one triticale variety having significantly less CP content than the overall mean. Both rye varieties also had rumen degradable protein (RDP) content significantly greater than the overall mean.
Neutral and acid detergent fiber (NDF. ADF) are measures of feed value and represent the less digestible components of the plant, with NDF representing total fiber and ADF representing the least digestible plant components. Low NDF and ADF values representing increased digestibility; ideally NDF values should be <50% and ADF values should be <35%. One triticale variety had significantly lower NDF and ADF values than the overall mean, representing a digestible triticale variety. This same variety also had significantly higher total digestible nutrients (TD), net energy for lactation (NEL), relative feed value (RFV), and nonfiber carbohydrates (NFC).
The characteristic that best captures the overall forage quality performance is Relative Feed Value (RFV). A RFV of 100 is defined as the forage value that full bloom alfalfa would have. Two triticale varieties had significantly higher RFV than the overall average but both rye varieties also had high RFV values, though not significantly different than the overall mean. Though, none of these green-chop cereal forages are considered to be adequate as a stand-alone feed for a dairy operation, they can supply a source of forage used in a total mixed ration at the time of year when feed supply may be running short. When this forage benefit is added to the environmental benefit that is gained, planting winter cereal cover crops on a dairy farm can be a win-win decision.
The 2019 UMD small grain variety trial data concerning Fusarium head blight (head scab) and DON vomitoxin information is now available. Click the link below to view the report: