Up and Down: Maryland Weather at its Finest

Mark Townsend, Agriculture Agent Associate | mtownsen@umd.edu
University of Maryland Extension, Frederick County

It feels that most years we find ourselves finding something abnormal about the weather. This year is no exception and in some ways is even more different from our “abnormal-normal.”

Put lightly, the 2022-2023 winter was mild. There were only a handful of instances where we fell significantly below freezing and stayed there for more than a night or two. In fact, the average temperature from January to March of 2023 of 43.4 degrees Fahrenheit, was the second warmest on record in the 128-year NOAA Statewide Time Series dataset, just falling behind 2012 at 43.5 degrees Fahrenheit.

With this comes a significant accumulation of Growing Degree Days (GDD), a heuristic tool measuring the accumulation of heat through time which can be used to predict the development of crops and insects during the growing season. For review, GDDs are calculated by taking a simple average of the high and low daily temperatures subtracted from some base level. The base level is determined for each crop representing the lowest temperature the plant may still develop. For wheat and other small grains, the base temperature is often 32 or 40°F, while warm season crops like corn and soybeans have a GDD base temperature of 50°F.

Figure 1 is a cumulative line chart illustrating the accumulation of growing degree days since the start of the year in Frederick, MD. These data were obtained from the Cornell Climate Smart Farming (CSF) Growing Degree Day Calculator measured at a Frederick County, MD location, and a base temperature of 50 degrees (corn/soybeans base).

Figure 1. Growing Degree Day chart, Base 50, for Jan-May 2023.

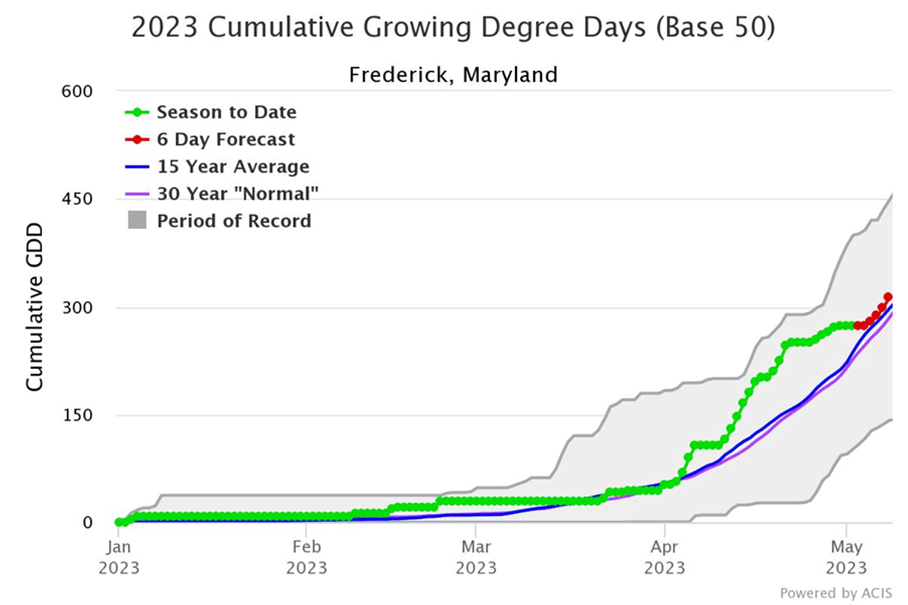
The chart illustrates the significant accumulation of GDDs in the last three months with the green line-and-dot figure poised well above the 15 year and 30-year averages. Of note is the rapid accumulation of GDDs in early to mid-April–illustrated by the rather large upward slope in a relative short period of time. Though we have not set any records, illustrated by the gray-bands above and below the data, we certainly came close in mid-April. This run-up coincided with abnormally dry conditions as well.

On the precipitation front, the region has generally been below average coming out of the winter months. Data from NASCE Prism Climate Group at Oregon State and USDA RMA (Figure 2) illustrates the precipitation anomaly, or difference in rainfall compared to the average from January to March for the continental US.

Figure 2. Percent deviation of average precipitation.

We may observe how the Mid-Atlantic held a range from 50-70% of average rainfall for the time period ending on March 31st.

The saying, “April showers bring May flowers” generally holds true in Maryland: on average and depending on the region in Maryland, we receive 3-5” of rainfall in April. This year, much of the region did not receive significant precipitation from April 1st to April 21st. Other regions only had to hold out another week to April 27th -28th to finally quench their thirst. These much-needed rains have brought much of the region at or near seasonal averages–bittersweet news for some crops that were in the rapid-development stage during the dry-period and for others that were “dusted-in” (planted into dry soil) in mid-April.

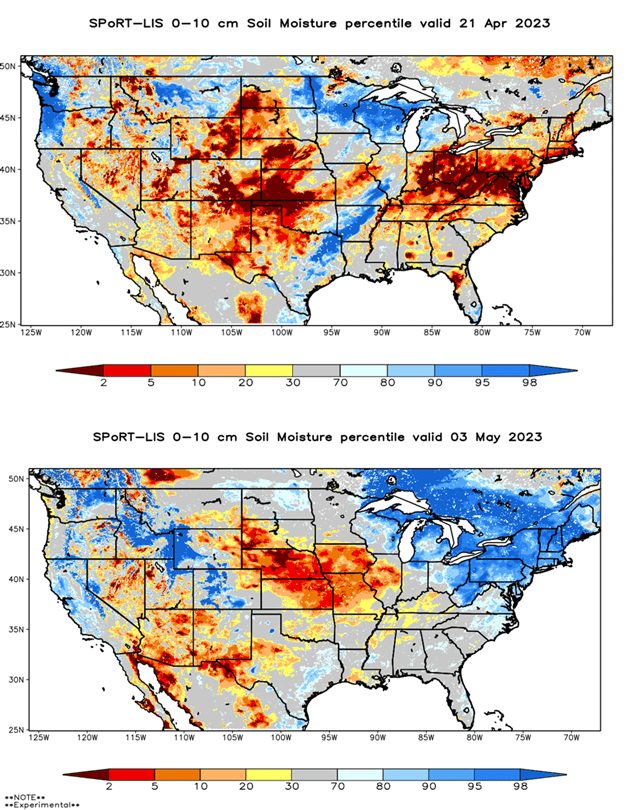
Speaking of; soil moisture has obviously reflected precipitation trends. Figure 3 are NASA Soil Moisture models based on satellite data. Figure 3 shows the model before our first rain on April 21st, while Figure 4 is the most recent model at the time of writing. We may observe how drastic the change in soil moisture has been in the last two to three weeks moving from a significant deficit (red areas, Figure 3) to nearly oversaturation (darker blue areas, Figure 4).

Figure 3 (top) & 4 (bottom). Soil moisture percentile thru April 21, 2023 (top) and thru May 3, 2023.(bottom).

Though we have received much needed rainfall it has come at the expense of temperature and GDD accumulation. Looking back at Figure 1, we have leveled-off significantly in accumulation rate in the last few weeks of April and into May, and are approaching the 15 and 30 averages.  Additionally, data from the Northeast Regional Climate Center (Figure 5 & 6) illustrate the GDD Difference from last year for the Mid-Atlantic and Northeastern United States by county modeled at 4/21 and 5/3, respectively.

Figure 5 (top) and 6 (bottom) . Growing Degree Day differences from average, March thru May 2023.

The comparison of the charts again yields useful information indicating that we were about 10-14 days ahead of last year and 7-10 days ahead of the average on 4/21. The cool temperatures much of the region has felt has made up this difference as we sit about 3-10 days ahead of last year with generally little difference on average.

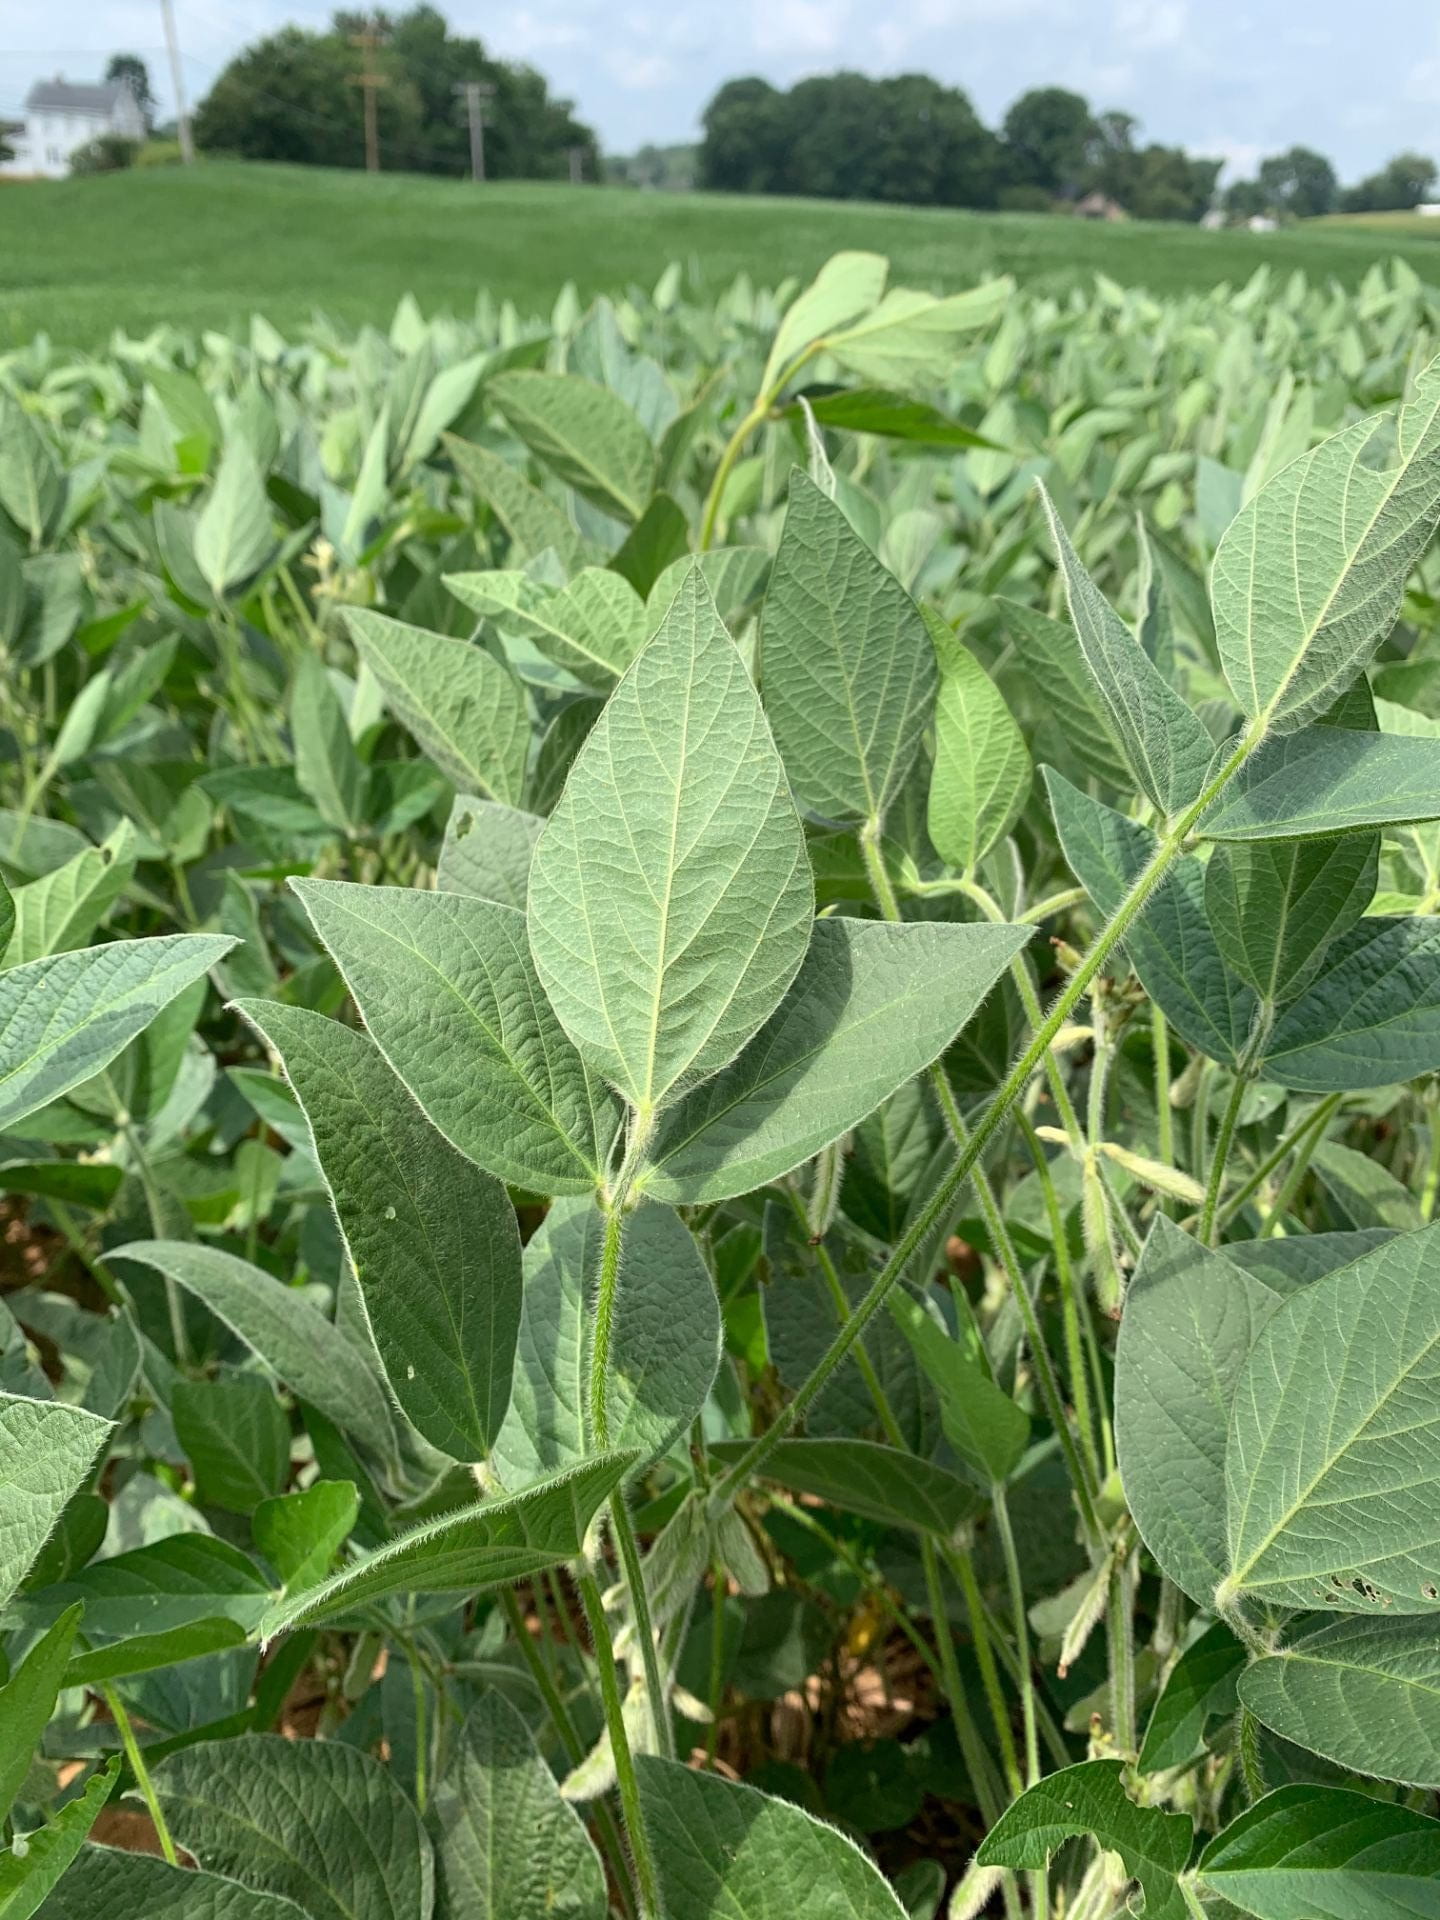
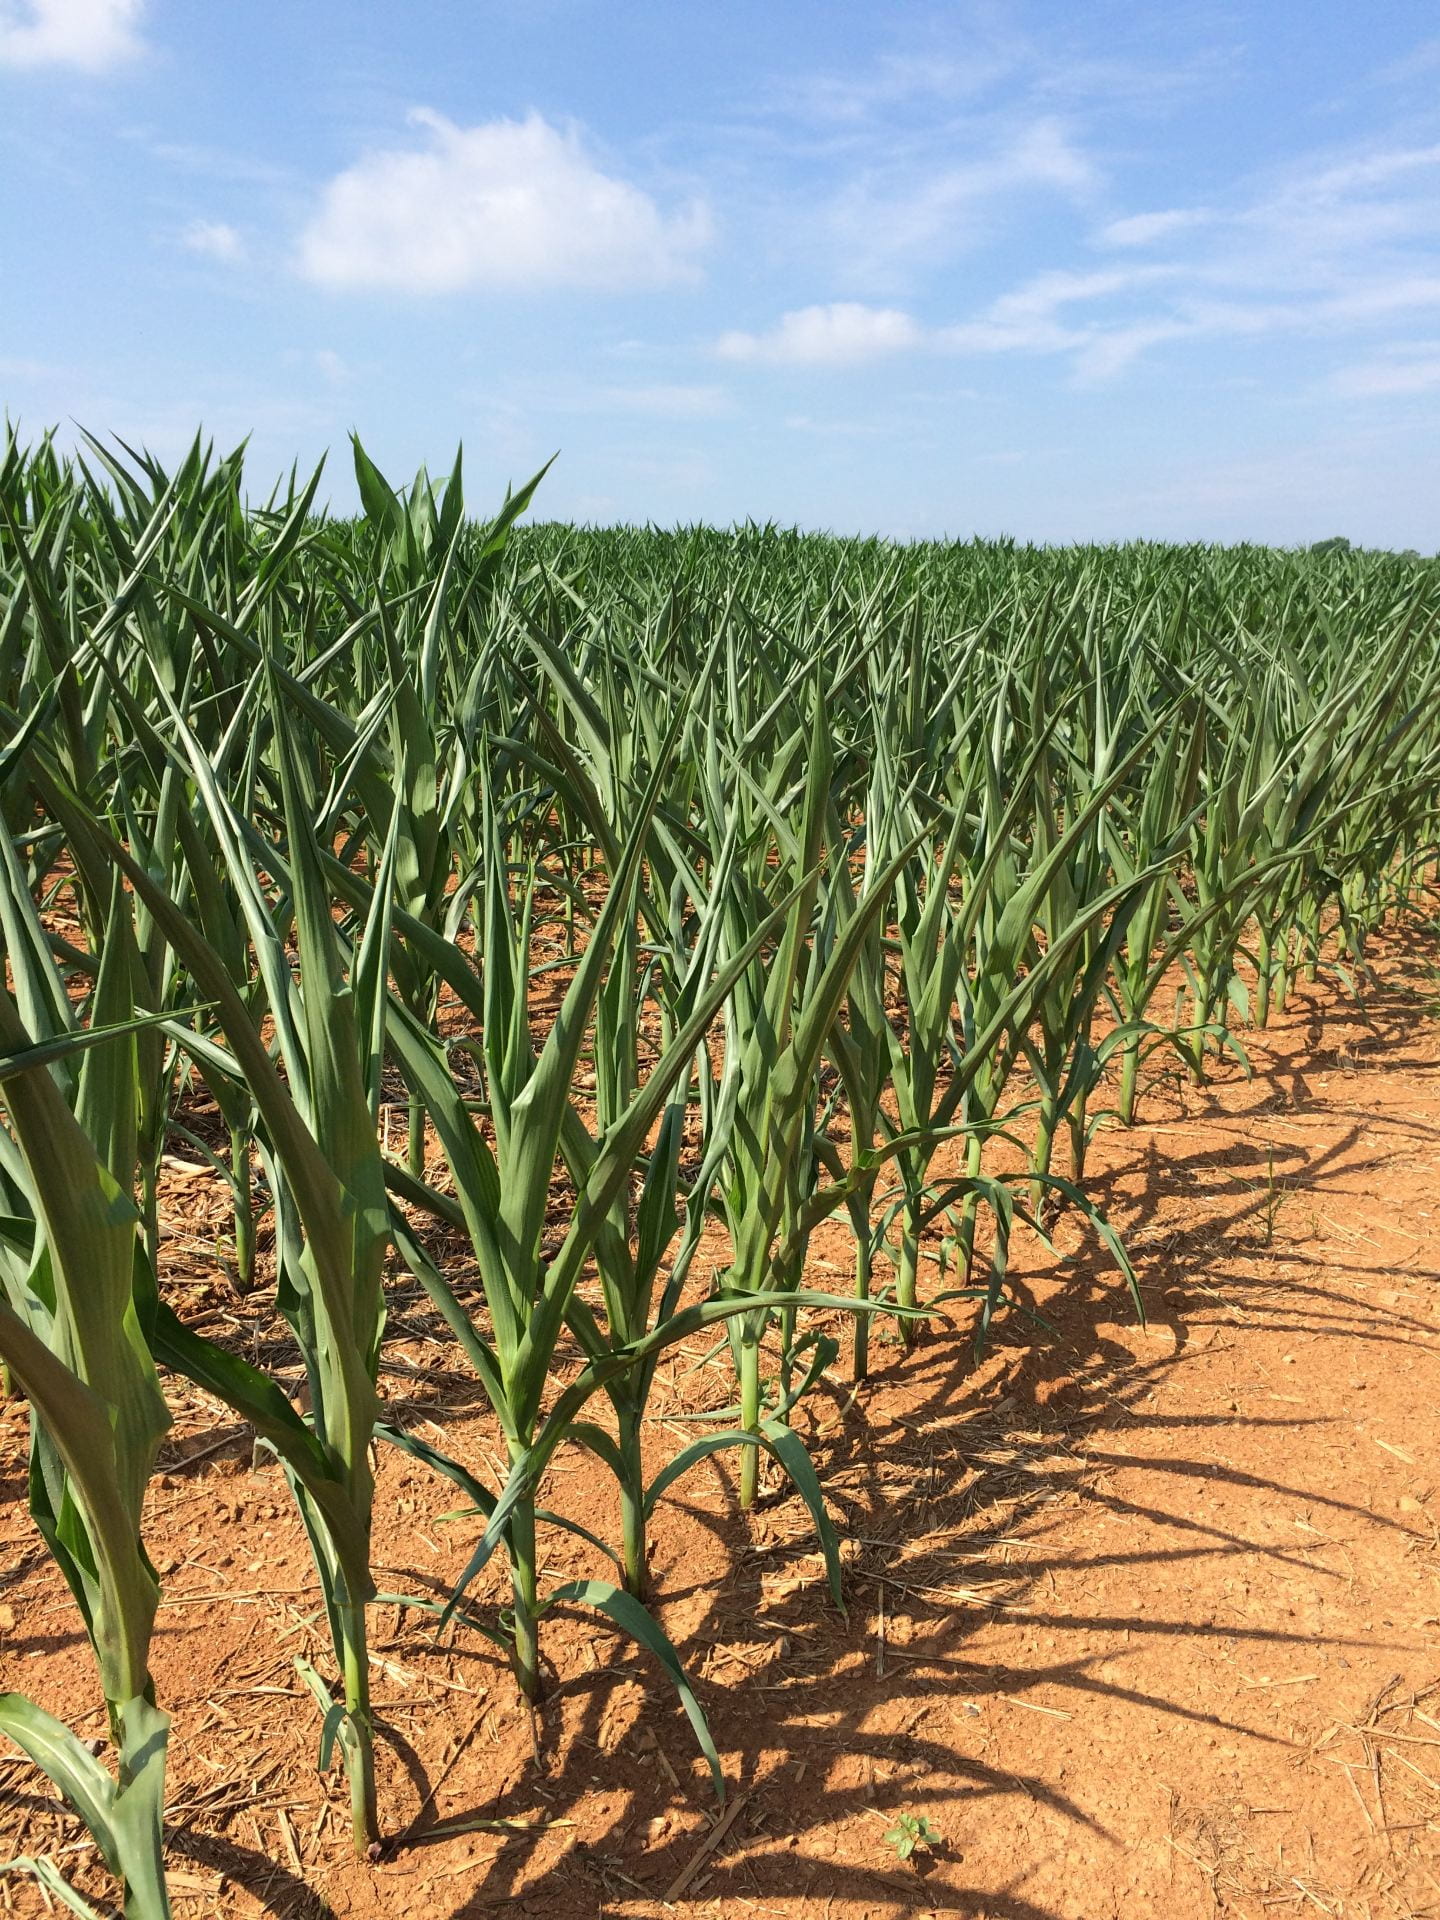
In terms of agronomics, there are many potential takeaways that one can derive from these observations. Though generally speaking, it may be useful to begin scouting for diseases in small-grain crops especially as we move into reproductive phases of crop development paired with the recent spell of cooler, wet weather. Though we may be outside of the typical window, powdery mildew tends to propagate well in these conditions; and though previous fusarium head-blight models have not indicated a potential concern, this has changed given recent cool, wet weather patterns. Pre and post-emergent damping off pathogens, such as Fusarium, Rhizoctonia, and Phythium, are also a concern under cool, damp soil conditions and can affect seedling stands of both corn and soybean, especially on non-treated seed. In any event, keeping-tabs on crop conditions during this period is generally best practice.

Similarly, it may prove useful to scout seedling crops for root damage from cool, wet weather loving pests like seedcorn maggot, wireworms, white grubs, corn rootworm, and slug. Additionally, a “flag-test” may be worthy to assess emergence of recently planted crops as germinating seed may be weakened by imbibing colder soil water.

Though as gloomy as looking back on recent weather may be, it does appear that drier and warmer weather is in the immediate forecast. Here’s to May flowers!

Yield Impact on Heat and Drought-Stressed Soybeans

Andrew Kness, Agriculture Agent
University of Maryland Extension, Harford County

According to the latest Drought Monitor report, approximately 43% of Maryland is experiencing abnormally dry to moderate drought conditions, predominantly in the central, western and southern eastern shore parts of the state. Rainfall has been sporadic in areas and July 2020 went down as the hottest month on record in Maryland since 1872. Because soybeans flower over several weeks, they can compensate for periods of drought better than crops with a short pollination period, such as corn. As a result, yield impacts from heat and drought stresses can be variable in soybean and difficult to predict.

Soybeans require between 0.25-0.33 inches of water per day, and photosynthesis peaks around 85°F. Further, soybeans are less sensitive to high nighttime temperatures than corn. However, when temperatures peak into the 90s and soil moisture becomes limited, soybeans will become stressed. In an attempt to conserve water, stomata will close, which also inhibits CO2 exchange and thus slows photosynthesis, leading to reduced growth. Soybeans will also allocate more energy to growing roots rather than vegetative tissue.

If drought conditions persist, leaves will begin to invert, exposing their silvery underside (Figure 1). The underside of the leaves reflect more light and helps to reduce water loss in the plant. The middle trifoliate of the leaf will also move upwards or flop over to cover one of the other trifoliates to help shade the leaflets (Figure 1). Nodulation and nitrogen fixation will also be reduced if high temperatures and low moisture persist, further inhibiting growth.

close-up of soybean leaf
Figure 1. Drought-stressed soybeans exposing the undersides of their leaves.

If heat and drought occur during the reproductive phases, soybean plants will abort flowers and pods. Even under perfect growing conditions, soybeans do not have the genetic potential to turn every flower into a seeded pod, so depending on the amount of stress, they will abort between 20-80% of their flowers. Indeterminate varieties have a longer flowering period, therefore if moisture returns, the plant can fill new pods and the effect on yield may not be significant. Furthermore, if moisture returns around R5 (beginning seed), a loss in yield from reduced pod number can be compensated by increased seed size. If drought conditions are present during pod fill, seed size may be reduced. Make sure your combine is adjusted accordingly to ensure that small-seeded beans are not going out the back of the combine.

Overall, the greatest yield reductions in soybean from drought stress occurs between R4-R6. If soybeans have a reduced pod set from stresses during flowering, good yields can still be achieved if soil moisture is adequate between R4-R6. If you intend to gauge soybean yields in the field, it is best to wait until R6. Soybean yields can be difficult to estimate from a field assessment, but this article written by Kelly Nichols provides guidance: https://blog.umd.edu/agronomynews/2018/09/07/estimating-corn-and-soybean-yields/.


The Fungicide Conundrum When It’s Hot and Dry

Andrew Kness, Agriculture Agent
University of Maryland Extension, Harford County

As corn and soybeans begin to enter reproductive growth stages, foliar fungal diseases can have a serious impact on yield if growing conditions favor their development. However, with the hot and dry weather, disease pressure is low and will remain low if these weather patterns persist. Weather patterns in the Mid-Atlantic can switch rapidly and in general, fungicides need to be applied as a protectant, so spray decisions need to be made before the onset of disease. Coupled with the fact that many new fungicides on the market today are promoted to help plants cope with stresses, such as drought and heat, can complicate the decision.

I like to remind folks that fungicides are designed to do one thing—and that is to manage fungal diseases; they do this job very well. Hundreds of university trials have demonstrated that the most likely yield response and economic return occurs when fungicides are applied at the correct time and used when disease pressure is high. When disease pressure is low, yield responses sometimes occur, but are far more inconsistent than when disease is present.

There is also limited university data regarding fungicide utility to help plants manage drought stress. In the lab, strobilurin and triazole fungicides have been shown to regulate stomatal conductance and photosynthesis intensity in some corn hybrids, which improves the plants response to drought. However, when conducted at the field level, results are inconsistent and do not occur predictably. More research is needed to determine if fungicides can improve yields in drought conditions, and if so, when the application should be made. Existing studies indicate that the fungicide needs to be applied before drought stress occurs in order to stimulate the appropriate response in the plant; which again, makes spray decisions difficult without a crystal ball in hand to see into the future.

Another consideration, and perhaps the most important, is economics. While a fungicide application may provide some measurable differences in appearance and/or yield, is it enough to cover the application cost? Again, this is a tricky question to answer, but the body of research indicates that a single fungicide application in corn around VT-R1 and R1-R3 in soybean is the most likely to provide an economic return on investment when disease is present. In the absence of disease, the probability of an economic return is very low. Here are some additional factors that you should account for when considering a fungicide:

  • Crop history and tillage: Many fungal pathogens of corn and soybean are residue-borne. If growing corn-on-corn or soybeans after soybeans, those fields will be prone to higher disease risk. Conservation tillage fields are also at higher risk.
  • Irrigation: In dry years, fields that are overhead irrigated will be at higher risk of developing fungal diseases than dryland fields.
  • Disease progression: Scout your fields and see if and where fungal lesions are present on the plants. Many of the most important diseases of corn and soybean start low in the canopy and progress up the plant if environmental conditions are conducive (Fig. 1). For soybean it is critical to keep the top ⅓ of the plant clean of disease from flowering to pod fill; and for corn, it is critical to keep the ear leaf clean. If you notice fungal pathogens encroaching on these upper plant parts as they begin to flower and tassel, a fungicide application may be beneficial to protect yield.

    Grey leaf spot lesions on a corn leaf and froyeye leafspot lesions on a soybean leaf
    Figure 1. Two economically significant diseases of corn and soybeans: grey leaf spot lesions on corn (left) and frogeye leaf spot lesions on soybean (right).
  • Hybrid and variety resistance: Pay attention to your corn hybrid and soybean variety foliar disease ratings (resistance ratings are disease-specific); those that are more susceptible will have the greatest chance of an economic return on investment to a fungicide application than resistant varieties. Planting resistant varieties and hybrids is one of the most effective disease management tools.
  • Resistance management: It is generally considered bad practice to spray a fungicide when disease potential is low, as you are exposing pathogens to unnecessary chemistry, and with each exposure you drive the population towards resisting that chemical. This is why it is important to rotate modes of action and use full label rates, as cut rates can accelerate the development of resistance. The Take Action website (https://iwilltakeaction.com/) can help you choose products with differing modes of action.

The take-home message is to realize that you have the greatest chance for an economic return on your investment with a fungicide application when disease actually develops. Applying a fungicide to help plants cope with drought stress will likely not help to a degree that covers the cost of the application; as replicated field trials have yielded inconsistent and unpredictable results.


How will this hot, dry weather impact corn yield?

Nicole Fiorellino, Assistant Professor & Extension Agronomist
University of Maryland, Dept. of Plant Science and Landscape Architecture

The conditions this growing season have been a major improvement over the conditions we experienced during the 2018 growing season. Generally, the spring weather was favorable for timely planting of corn on the upper and mid-shore, southern Maryland, and northern Maryland regions, with other regions not lagging far behind. The 2019 growing season has generally been good to us, there was early optimism in the monthly crop reports, but by the end of June, warm and dry weather began around the state. Some areas may have received some spotty thunderstorms throughout July, but the July crop reports indicated droughty conditions throughout the state. As we enter into a new month with minimal precipitation thus far, farmers are concerned about the effects from the prolonged dry and warm conditions on corn yield.

Drought-stressed corn in vegetative growth stage
Drought-stressed corn in vegetative growth stage. Image: A. Kness, University of Maryland.

Warm temperatures and low rainfall cause stress to growing crops and this weather stress can be a major problem prior to pollination, as stress during this stage will impact the potential number of kernels per row. Warm temperatures, specifically, can cause corn plants to utilize more energy to carry out normal functions. Low rainfall can cause corn ear tips to lose kernels. Poor root development, from poor planting conditions and soil compaction early in the season, can amplify the effects of weather stress observed later in the season. But generally, the potential impact on corn yield from warm, dry weather will depend on the maturity of the corn crop when it experiences the weather stress.

Corn is particularly sensitive to weather stress during the late vegetative growth stages when the number of kernels is determined. Four days of weather stress between V12 and V14 could reduce yields 5 to 10%. Even into tassel emergence, total number of kernels can be affected, with yield reduction from 10 to 25% with four days of weather stress at this stage. Silk emergence and pollination is a critical period of moisture use in corn, with weather stress affecting pollination and leading to kernel abortion – four days of stress during silking could reduce yields up to 50%. Generally after pollination, reduced kernel fill can be expected during weather stress, with four days of weather stress post-pollination possibly reducing yields 30 to 40%. During blister and milk stages, kernel abortion is a concern during weather stress, while shallow or unfilled kernels can occur with stress during the dough stage, and reduced kernel weight is a concern during dent.

In summary, there is potential for reduction in corn yield due to the hot, dry weather but the impacts differ based on the maturity of the corn when it experiences the stress. Weather stress during silking and pollination can have the most severe impact on yield potential, with impacts from weather stress decreasing as corn moves further into reproductive maturity.

Scouting for Kernel Set

Jarrod Miller, Extension Educator, Somerset County

A great yield requires the whole season, from planting all the way to harvest. Fields of corn may have great stands from adequate spring and early summer conditions, but still suffer during pollination.

Pollination is a sensitive time for a corn plant, and stressful conditions can drastically reduce kernel set. A corn field may take 7-14 days to shed pollen from the tassels and fertilize the emerging silk. Heat stress (>86F) may limit pollen shed reducing fertilization. Heat or drought stress may also slow silk emergence, so that it misses pollen shed. Since silk emergence starts at the base of the ear and works its way up, the tip is the most likely place to miss pollination and have poor kernel set. Variable temperatures, moisture or insect damage over these two weeks may lead to poor kernel set across the whole ear. Continue reading Scouting for Kernel Set