Nidhi Rawat, Small Grains Pathologist University of Maryland, College Park
Wheat is mostly ending flowering across Maryland now, except for some late-planted fields. The FHB prediction map shows enhanced FHB risk. If your wheat flowered within the past 4-7 days, you are still in the window for FHB fungicide application. This season, we are also observing several foliar diseases such as stripe rust, powdery mildew, BYDV, and tan-spot in our variety trial plots. Some farmers are also reporting these issues from their fields. If you are considering the application of fungicides at this stage, use FHB fungicides: Miravis-Ace, Prosaro, Prosaro-Pro, or Sphaerex. These will control other fungal diseases, in addition to FHB, but not BYDV. For BYDV none of the fungicides can provide control, as it is a viral disease, and genetic resistance is the only real solution for it. Strobilurin-containing fungicides are not recommended for application at this stage.
Andrew Kness, Senior Agriculture Agent | akness@umd.edu University of Maryland Extension, Harford County
This article may come a little too late for some of you depending where you are in the state; but nevertheless, here is a review/reminder. As we get into May, wheat will begin flowering and we will have to consider fungicide applications to wheat to manage Fusarium head blight (FHB), also known as head scab. FHB is the most economically important disease of wheat, causing not only yield reductions, but more seriously, grain quality issues due to the production of the mycotoxin deoxynivalenol (DON), also called vomitoxin.
The pathogen that causes FHB, Fusarium graminearum, persists in wheat, small grain, and corn residue. It infects the wheat plant through the open flower, which is why flowering is such an important management timing for quality wheat production. Fusarium graminearum requires moist conditions and moderate temperatures (59-86 °F) to initiate infection. If these conditions are met during flowering, the pathogen will infect susceptible wheat varieties and cause disease.
Management of FHB requires a layered approach of IPM practices, with the major management practices being the selection of a good wheat variety and subsequent good planting and fertility practices, plus the use of a fungicide at flowering should the environmental conditions be conducive for FHB development. The wheatscab.psu.edu map can be helpful in predicting FHB risk to wheat around flowering. Historically, this model has been over 70% effective at predicting FHB outbreaks and should be consulted when making fungicide decisions. If you decide to apply a fungicide to manage FHB, there are three important factors to consider: 1.) Timing, 2.) Application method, and 3.) Active ingredient.
As mentioned earlier, the pathogen can only infect wheat through the open flower, so you need to time your fungicide application as close to flowering, or Feekes Growth Stage 10.5.1, as possible (Figure 1). This growth stage is defined by the appearance of yellow anthers in the center of the wheat spike on at least 50% of the plants. Once this stage is reached, the application window is about 5-7 days. Some fungicide products are labelled for application as early as Feekes 10.3 (half head emergence); however, this timing is not as optimal as 10.5.1—so wait if you can.
Figure 1. Wheat at Feekes 10.5.1, indicating proper fungicide timing for FHB management. Photo: A. Kness, Univ. of Maryland.
The second factor is application method. Most of our fungicides on wheat go on with a ground sprayer. For ground applications it is important to achieve good coverage of the wheat heads, not the foliage. To do this, spray volumes should be at least 15-20 gallons/acre and you should use bi-directional spray nozzles angled forward and backwards. This combination of spray volume and angled nozzles results in thorough coverage of the wheat heads. Aerial applications should be done at 5 gallons/acre for maximum coverage.
The final consideration is fungicide active ingredient. Triazole and HDMI fungicides work best on FHB. Products include: Prosaro Pro, Prosaro, Miravis Ace, Saphaerex, Proline, and Caramba; Folicur has less efficacy than the others and Tilt is no longer effective on FHB. An added benefit is that these products will also do a good job of keeping other fungal diseases at bay during grain fill. Do not apply any group 11 (Qoi/strobilurin) fungicides such as Aproach, Headline, or Quadris after heading as these products can actually increase DON levels in the grain.
Nidhi Rawat, Small Grains Pathologist University of Maryland, College Park
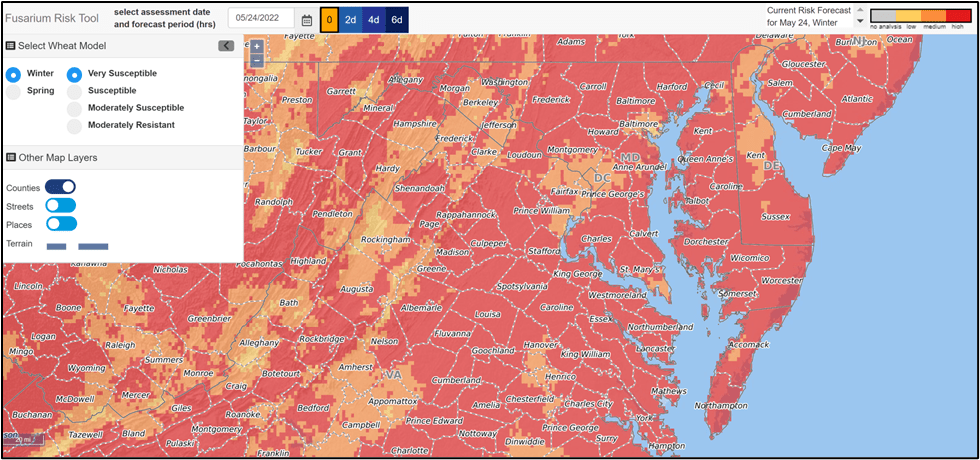
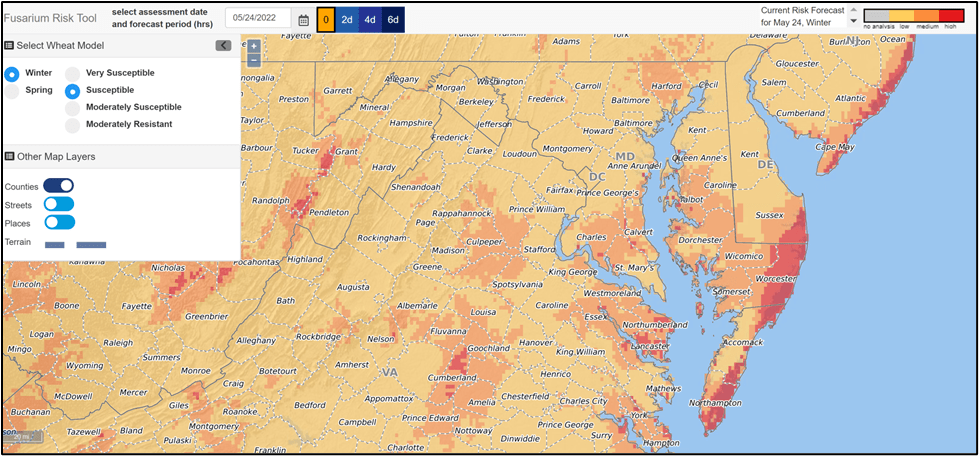
Wheat is currently flowering or will soon flower across the state of Maryland. Flowering is when yellow anthers emerge out of the wheat spikes. This is again that year, in which if you planted a resistant variety, you would be okay without spraying fungicides for controlling Fusarium head Blight (FHB risk map: top picture). However, if your planted variety is not FHB resistant, you should consider application of FHB fungicides (FHB risk map: lower picture). If you are planning to apply fungicides for FHB, remember that triazole-containing fungicides (Miravis-Ace, Prosaro, Prosaro-Pro, and Sphaerex) should be used for controlling FHB. They can control other fungal pathogens like powdery mildew, rusts, in addition to scab. Strobilurin-containing fungicides should not be used at this stage. These fungicides do not need to be tank mixed with another product for spraying. The fungicide products should be applied at the full rate recommended by the manufacturers. Aerial application at a rate of 5 gallons per acre or ground application at 15 gallons per acre with 300-350 um droplet size is recommended. Spray nozzles should be angled at 30°-45° down from horizontal, toward the grain heads, using forward- and backward-mounted nozzles or nozzles with a two directional spray, such as Twinjet nozzles.
Andrew Kness, Senior Agriculture Agent | akness@umd.edu University of Maryland Extension, Harford County
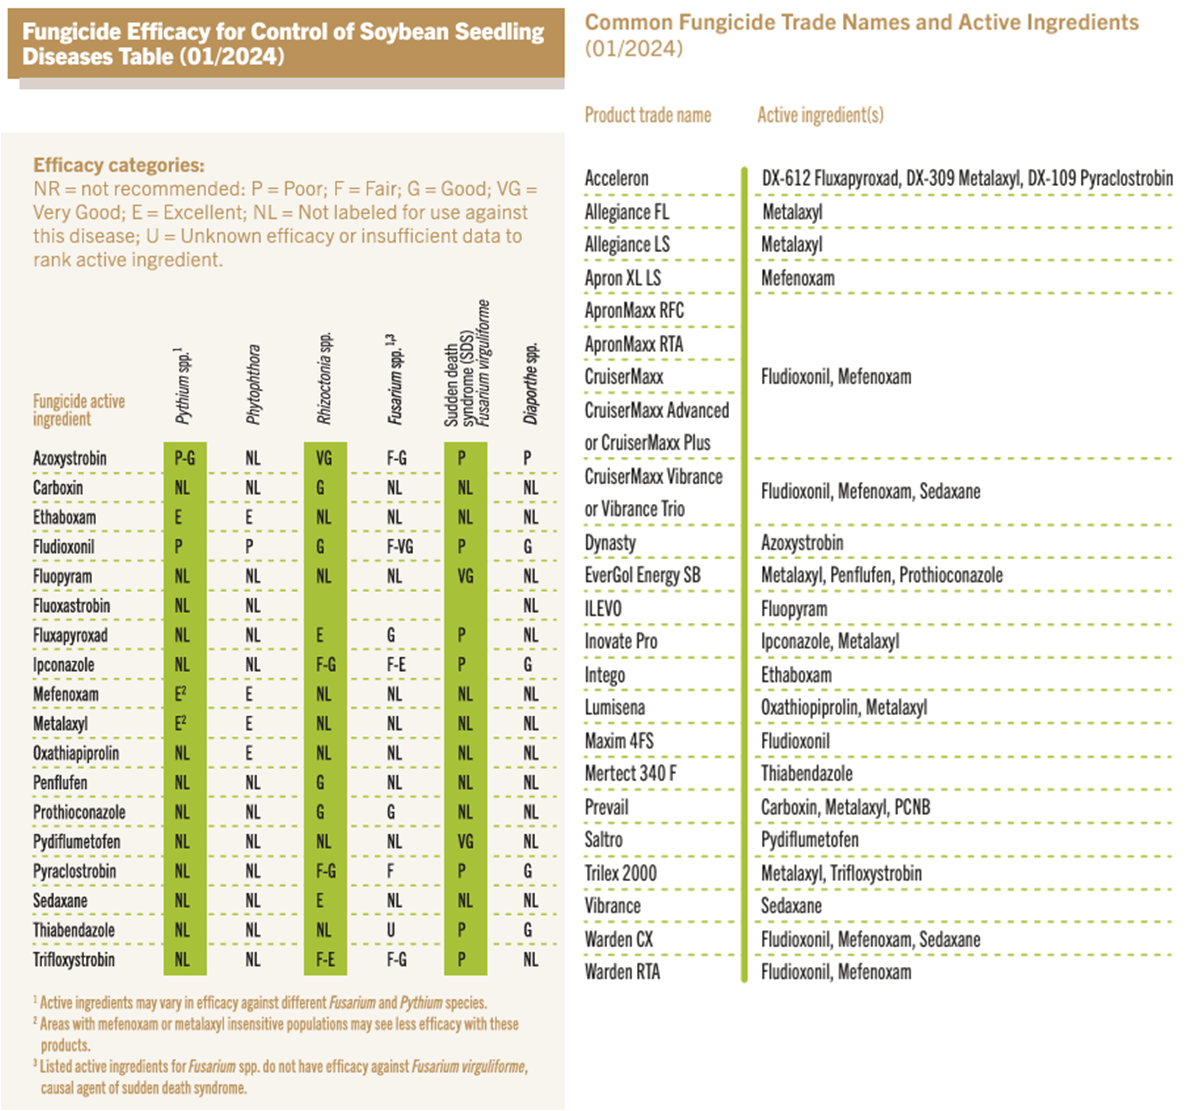
Various fungal pathogens can infect seedling soybeans and cause disease, especially beans planted early into cool and/or wet soils. Fungicide seed treatments have varying levels of efficacy against these pathogens, so it is important that your seed is treated with the correct chemical for the pathogens you are trying to manage in your field. The table below can be used to compare fungicide seed treatment efficacy against various soilborne pathogens of soybean. Note that fungicide seed treatments will provide about 2-4 weeks of protection. These tables are produced by the Crop Protection Network and the full publication can be accessed at cropprotectionnetwork.org.
Andrew Kness, Senior Agriculture Agent | akness@umd.edu University of Maryland Extension, Harford County
Summary
Tar spot is a new foliar fungal disease of corn first discovered in the United States in 2015 and confirmed in Maryland in 2022 and was estimated to be the most significant yield-limiting disease of corn in the US in 2021 and 2022. As a new disease for our state, this project collected preliminary data on the distribution of tar spot in our state and compared the efficacy of different fungicide application timings. Through field surveys we identified and confirmed tar spot in eight Maryland Counties at a frequency of approximately 47% and at a relatively low severity rate (not exceeding 30%). These observations suggest that the tar spot pathogen can overwinter in Maryland, as it has expanded its range from two counties in 2022 to at least eight in 2023. Field evaluations of two fungicide programs: one pass program at VT and a two-pass program at VT followed by R2, we observed a significant difference in tar spot severity and plant lodging compared to the control; however, there was no difference in yield. Additional research on fungicide timing and the spread of this disease should be conducted in the future to help develop improved management recommendations.
Survey of Tar Spot Distribution in Maryland
Several fields were scouted for tar spot starting during late vegetative growth stages and frequency and intensity of scouting was increased from tassel through harvest. Initial scouting was focused in fields in Harford County near fields where tar spot was confirmed in 2022. In addition, reports were solicited from other Extension Agents and crop consultants/scouts throughout the state. Suspected positive samples were confirmed by laboratory technique and all positive samples were uploaded to the tar spot tracker map on corn.ipmpipe.org.
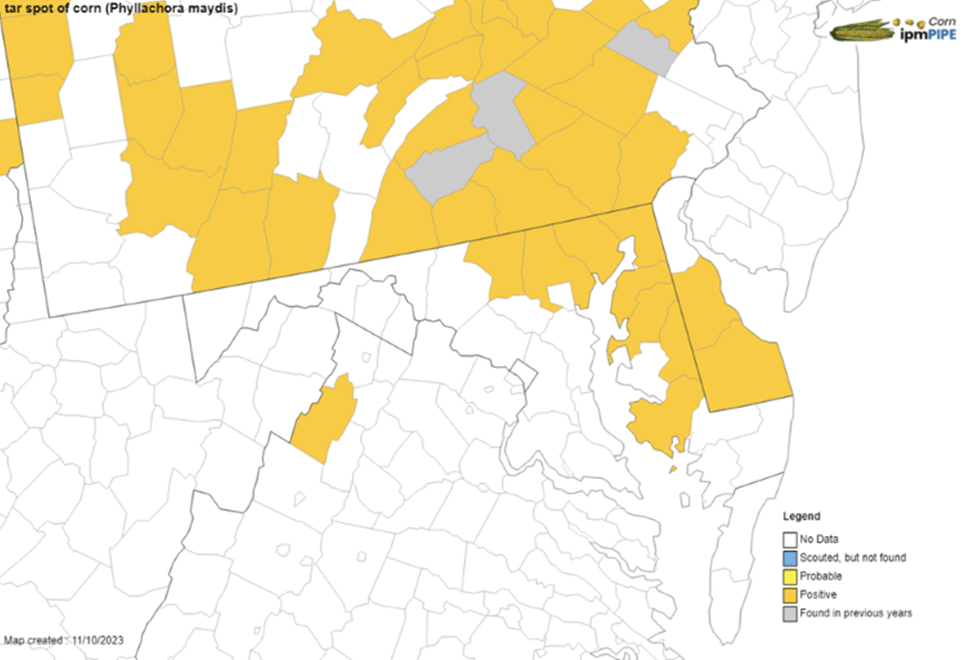
The first reported and confirmed incidence of tar spot in Maryland for 2023 came from a corn field in Cecil County on August 22. The second came from Carroll County on August 31, followed by Harford County on September 3. We confirmed tar spot in the additional counties of Kent and Queen Anne’s on September 19; Baltimore County on September 22; Caroline County on September 25, and Dorchester County on October 6 (Figure 1).
Figure 1. Map showing confirmed distribution of tar spot for the 2023 growing season (yellow). Map from corn.ipmpipe.org.
Several fields were scouted in Northern Harford County throughout the year surrounding fields where tar spot was confirmed in 2022. By the end of the season, tar spot was found in over 50% of these fields (9/16) at levels ranging from 2% to 25% severity (Figure 2). It was observed that tar spot severity continued to increase after black layer for as long as there was green, living tissue remaining on the plants. This increase in severity after physiological maturity does not affect yield but does make for a notably increased level of severity present at harvest and thus the potential for an increase in overwintering spores that will provide inoculum for the following year.
Figure 2. Corn leaf with approximately 10% tar spot severity. Tar spot symptoms include raised, black specks on the leaves.
An additional survey of 12 fields on Maryland’s Eastern Shore from Cecil to Queen Anne’s County was conducted on September 19. During this time, two fields were confirmed with tar spot. Severity was very low (<2%) in the field in Queen Anne’s County, and high in the field in Kent County (30%).
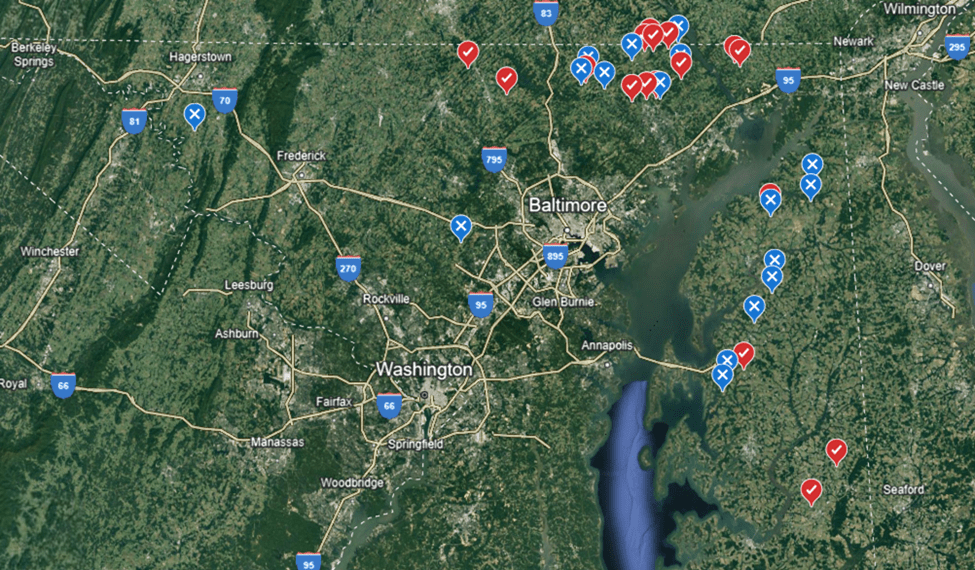
Altogether, tar spot was confirmed in 16 out of 34 fields (47%) scouted/reported throughout the state (Figure 3), with samples coming from as far west as Washington County (no confirmed samples) east to Cecil County (two confirmed samples) and south on the Maryland Eastern Shore as far as Dorchester County (one sample confirmed).
Figure 3. Google Earth map of fields scouted (blue markers) and confirmed (red markers) presence of tar spot. Markers are approximate locations and not precise to protect the identity of the landowner and/or farmer.
Weather conditions were favorable for tar spot on the Eastern Shore and Northern Maryland; however, severe drought conditions from Frederick County west may have prevented its widespread establishment in Western Maryland.
Based on this survey, tar spot appears to be established in all the northern counties east of Frederick and south on the Eastern shore to at least Dorchester County, at a frequency of approximately 40-50%. Judging by the confirmed occurrences in other counties in different states, it is likely that tar spot is present in more Maryland Counties than determined by this survey.
On-Farm Fungicide Trials
Fungicides are an effective management tool for foliar diseases of corn, including tar spot. Research from the Midwest has shown a positive response to fungicide applications in fields where tar spot disease severity is high. However, there is debate as to if one fungicide application made around VT is sufficient to control tar spot, as yield losses have been reported as late as R4. In 2023 we established an on-farm trial to evaluate the response to a single fungicide application compared to a two-pass program for managing tar spot in corn.
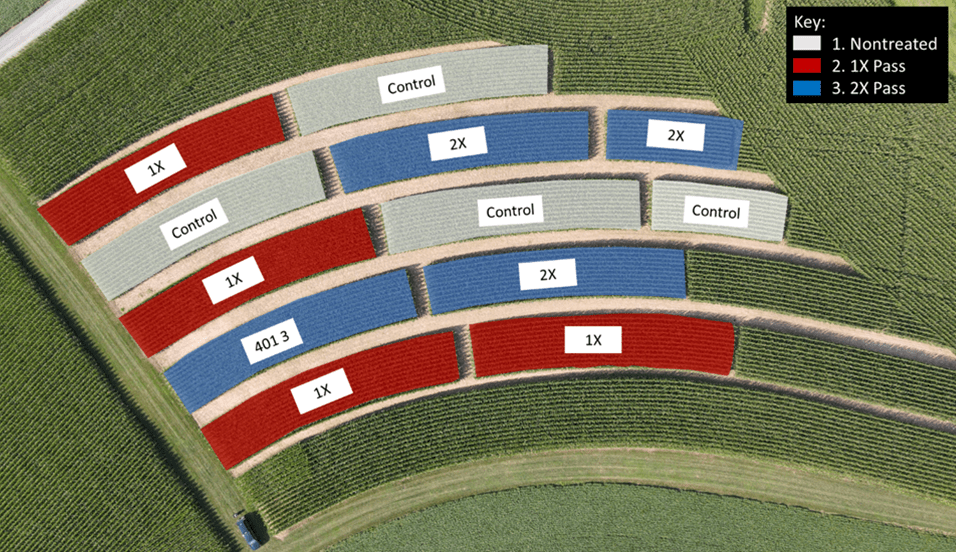
Field plots were established at a farm in Harford County, MD in a field immediately adjacent to where tar spot was found in 2022. Corn (Revere Seed ‘1307 TCRIB’) was no-till planted into soybean residue with a John Deere 1775 NT ExactEmerge™, 30-inch, 16 row planter at the rate of 35,000 seeds/acre. Rows 1, 2, 15, and 16 on the planter were shut off to create alleys between adjacent plots and to eliminate treatment overlap, as well as to ensure harvest accuracy. This resulted in 12-row plots that were between 75 and 150 feet long. Plots were arranged in the field in a randomized block with three treatments and five replicates (Figure 4).
Figure 4. Tar spot fungicide timing research plot layout.
Fungicides (Table 1) were applied at the VT and R2 growth stages using a DJI T30 drone calibrated to deliver 2.8 gallons per acre spray volume to the entire length of the 12-row plots. VT applications were made on July 12 and R2 applications were made on August 5. Trivapro 2.1 SE was used for all applications. Trivapro was selected because previous research has demonstrated that multi-mode-of-action products have the best efficacy against tar spot.
Table 1. 2023 Fungicide Treatments.
Treatment
Product Name
Active Ingredient(s)
Application Rate (& Timing)
Nontreated Control
N/A
N/A
1X Pass
Trivapro 2.1 SE
Benzovindiflupyr + Azoxystrobin + Propiconazole
13.7 fl oz/A (VT)
2X Pass
Trivapro 2.1 SE
Benzovindiflupyr + Azoxystrobin + Propiconazole
13.7 fl oz/A (VT) & 13.7 fl oz/A (R2)
Foliar diseases were rated prior to fungicide application and approximately every two to three weeks following until harvest. Disease severity from tar spot was visually rated as the percent leaf area infected in the canopy from 10 random plants from the center two rows of each plot.
Lodging scores were collected at harvest by conducting a “push test” on 10 plants from the center two rows of each plot. The push test consists of pushing a corn plant approximately 30 degrees from vertical; plants that break have compromised stalk strength and were considered lodged.
Yield data were collected by harvesting 12 rows of each plot using a John Deere S780 combine on October 13, 2023. Yield data was exported from the combine monitor and RTK was used to correlate yield with plot locations since we were not able to collect individual plot weights. All yields reported are adjusted to 15.5% moisture. All data were analyzed using ANOVA and significant differences between treatments were separated using Fisher’s Least Significant Difference (LSD; α=0.10).
On-Farm Trial Results
Tar spot was first observed in the plots on August 29 present at a very low level (less than 2% severity). Overall tar spot disease severity was low throughout the season in these plots. One possible explanation for this is the early planting date, which likely allowed the corn to complete its critical reproductive growth stages before weather conditions were favorable for tar spot development.
Early disease ratings revealed a significant difference in tar spot severity (p=0.0176) in treated plots vs nontreated plots (Table 2). However, late disease ratings collected at harvest show an overall increase in tar spot severity, but no difference between treated and nontreated plots. This is likely due to the fact that fungicides can only offer around 14-21 days of protection. In this trial, the second fungicide application did not provide improved tar spot control compared to the single pass treatment; however, the single fungicide application at VT delayed tar spot infection compared to the nontreated control.
Table 2. 2023 Tar Spot Disease Rating and Harvest Data.
Treatment
Tar Spot Severity (%)
Lodged Plants (%)
Grain Yield (bu/acre)
Grain Moisture (%)
9/11/23
10/12/23
Control
3.05 a*
3.75
10.0 a
192.56
19.06
1X Pass
1.18 b
2.88
5.0 a
199.05
19.41
2X Pass
0.85 b
4.00
0.0 b
201.56
20.31
p-value
0.0176
0.4133
0.0680
0.2123
0.4343
*Treatments connected by the same letter are not significantly different from each other (α=0.10).
The control plots averaged 192.56 bu/acre with a low of 169.7 and high of 214.6; the single pass (1X pass) program yielded an average of 199.05 bu/acre with a low of 177.5 and high of 228.6 bu/acre; and the two-pass (2X pass) fungicide treatment yielded an average of 201.56 bu/acre with a low and high of 194.4 and 222.7 bu/acre, respectively. However, there are no statistically significant differences in yield between treatments (p=0.2123). Likewise, there was also no significant difference in grain moisture. Tar spot disease severity was relatively low; likely too low to impact yield in this trial, leading to no yield response.
The 2X pass fungicide program did improve standability of the crop at harvest, with 0.0% lodging, significantly better than the 1X program (5.0%) and the control (10.0%).
This work was supported by funding through the Maryland Grain Producer’s Utilization Board and in-kind support from The Mill. Special thanks to Clear Meadow Farm for their use of land and equipment making this research possible.
Andrew Kness, Senior Agriculture Agent | akness@umd.edu University of Maryland Extension, Harford County
Figure 1. Signs and symptoms of tar spot on corn. Black raised areas are tar spot and long rectangular grey lesions are from grey leaf spot.
Tar spot is a foliar disease of corn caused by the fungus Phyllachora maydis and we confirmed it for the first time in Maryland from a grower field in Harford County in 2022; however, it is likely that it has been present in fields at low levels earlier than the 2022 growing season. Weather conditions across northern Maryland and Southern PA in August and September were favorable for tar spot development and pockets of disease outbreaks were reported, leading to much discussion about the disease amongst farmers and ag service providers over the 2022-2023 winter months about what to do to manage this disease in the future.
The pathogen that causes tar spot is favored by cool, wet weather. Tar spot spores overwinter in old corn crop residue and it seems to survive our winters just fine, as demonstrated by winter survival in Pennsylvania, as well as many northern corn belt states.
Temperatures between 60-70°F, coupled with 7+ hours of leaf wetness from dew, humidity, rain, or irrigation, trigger sporulation and subsequent spore germination on susceptible corn plants. Roughly 14-21 days later, signs and symptoms of tar spot will develop on corn plants in the form of small, raised black spots that have the appearance of tar or splattered black paint (Figure 1). These spots are the reproductive structures which provide secondary inoculum that repeatedly infect more tissue for as long as temperature and moisture conditions remain conducive.
In the Midwest where tar spot has been present since 2015, yield losses have been reported upwards of 60 bushels in bad years. It is also important to note that tar spot can make corn plants senesce and dry down much faster than normal, going from green to brown in 10-14 days under optimum conditions. This can make silage harvest tricky, which is why scouting is so important.
We do not know how prevalent and severe this disease will become in Maryland, so I encourage farmers to diligently scout corn fields to get ahead of it and also to determine where the disease is distributed. Scouting will also help you determine if a fungicide application is warranted. Fortunately, most fungicides that are labeled for corn do a fairly good job of protecting against tar spot, but there is data that suggests that the two and three way mode of action (MOA) products work better than single MOA products.
Fungicides should be applied as close to disease onset as possible; for tar spot this can be tricky because it can infect corn at any growth stage and it can still have significant yield impact as late into the season as R4. University research in the corn belt has found that the best chance for an economic return on investment is a single application around VT-R1; however, there are some instances where a second application was necessary but these were only when weather conditions for tar spot remained favorable during these later reproductive growth stages.
A few things to consider for tar spot management as we go into the 2023 growing season are as follows:
Avoid highly susceptible hybrids, especially in corn-on-corn fields or if you have a field with history of tar spot. There is no complete resistance to tar spot in commercial corn hybrids, but we do know there is some variability in susceptibility. Work with your seed dealers to try to identify your best hybrids and plant them in these fields where you think tar spot may be a problem.
Tillage and residue management appears to play a minor role in the management of this disease. Tillage may slightly reduce primary inoculum, but we need to keep in mind that tar spot spores can blow in from neighboring fields; so, I would not roll out the heavy tillage and blow up your no-till system just to try managing tar spot because it will only have a marginal effect.
Corn-on-corn has a higher risk for developing tar spot, especially if the previous corn crop was infected. Rotate with other crops to break up this cycle. P. maydis only infects corn (including dent, sweet, and popcorn); all other crops are not hosts.
Hybrid maturity also plays a role in disease severity. Research from the Midwest has shown that longer maturing hybrids suffer greater yield loss than shorter maturing hybrids. This is because the longer you push the grain fill period into the cooler late summer/fall months, the more likely tar spot will infect during earlier grain fill growth stages.
Scout fields this year starting a little before tasseling through to maturity. As mentioned above, this will help you determine if a fungicide is likely to pay off or not.
We will be conducting some field trials this year looking at tar spot management in Maryland with funds from the Maryland Grain Producer’s Utilization Board. Part of this project will also include a survey of corn across the state to determine the distribution of tar spot. If you think you find tar spot in a field this year, I would be interested in knowing about it. You can call or email me (410-638-3255, akness@umd.edu), or report a sighting at corn.ipmpipe.org.
Nidhi Rawat, Small Grains Pathologist University of Maryland
Flowering is finishing up across all of Maryland now, except for a few late planted fields in the northern part of MD that may still be flowering. FHB risk across the state continues to be high. So, if your wheat is currently flowering or has flowered within last 4-5 days, you can still spray FHB fungicides. I have started scouting the wheat variety trials for FHB symptoms on the Eastern shore and am already observing moderate FHB incidences in untreated plots there. The weather conditions have been conducive for FHB this season so far. If you have planted resistant varieties, the situation is expected to be better. Natural infections of leaf rust and stripe rust are also being seen sporadically. I do not expect any major losses due to these two now though. So, it’s okay not to spray any fungicide specifically for these diseases.
Nidhi Rawat, Small grains Pathologist University of Maryland
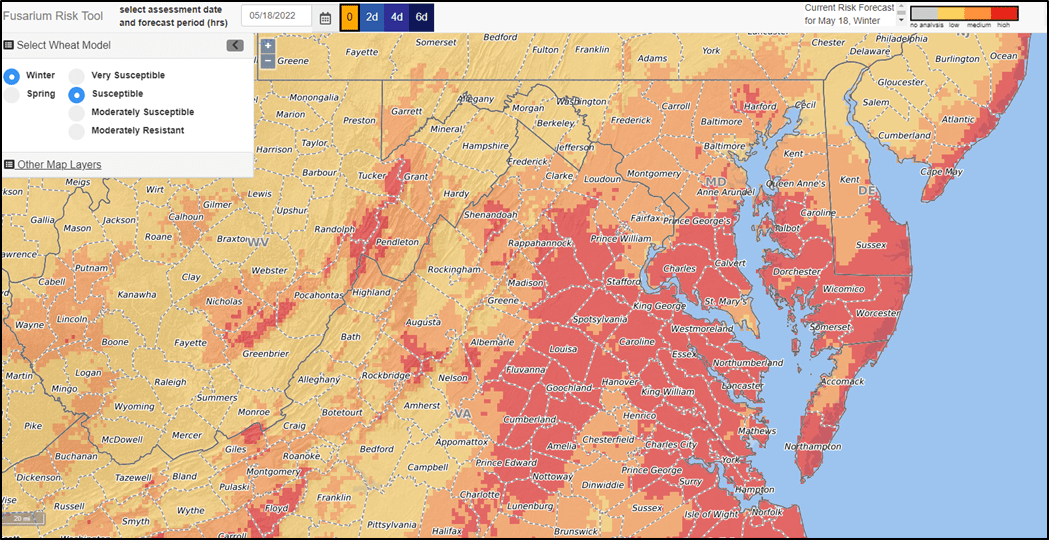
Date 5/18/2022
With the recent showers and warming weather, FHB risk in the state is increasing. Wheat in the Eastern Shore of Maryland has finished or is just finishing flowering. If your wheat has just flowered last week, and you have not sprayed FHB fungicides you can still do so, as fungicide application 4-6 days after flowering is also known to provide some control. Wheat in the Northern parts is either flowering/ will soon start flowering. The FHB risk for this part of the state (Frederick, Carroll and Harford counties) is predicted to be moderate to high, especially if the wheat variety planted is susceptible. If the planted variety is resistant, the risk is not predicted to be particularly high. The recommended stage for application of fungicides on wheat is at flowering (50% of the main tillers showing yellow anthers) or within 4-5 days of that. The fungicides effective for FHB are Prosaro-pro/ Caramba/ Miravis-Ace. These fungicides do not need to be tank mixed with another product for spraying. The fungicide products should be applied at the full rate recommended by the manufacturers. Strobilurin containing fungicides should not be sprayed at this stage.
Alyssa Koehler, Extension Field Crops Pathologist University of Delaware
As tasseling in corn approaches, now is a good time to scout fields to decide if a fungicide will be applied. When considering the economics of a fungicide application, it is important to know your potential for disease based on field history, environmental conditions, and hybrid selection.
Many of the foliar pathogens of corn can survive in residue, so corn-on-corn fields carry a higher potential for disease, especially if disease has been observed in previous years. Hybrids with higher resistance ratings may not need a fungicide. Resistant hybrids typically have smaller lesions and reduced spread of spores. In dryland fields, hot, dry weather will keep disease pressure low. Reports of foliar diseases have been minimal so far this season. Irrigated fields keep enough moisture to favor environments for disease and may see development of Grey Leaf Spot (GLS) or possibly Northern Corn Leaf Blight (NCLB).
GLS is one of our most common diseases of corn and usually begins on lower leaves as small, tan, rectangular lesions with a yellow halo. When lesions are young, they can be difficult to distinguish from other common corn foliar diseases. As lesions mature, they become more diagnostic. At maturity, lesions are grey to tan in color, with a long rectangular shape (Figure 1); partially resistant hybrids can have more jagged margins than lesions on susceptible cultivars. Lesions often join to form large necrotic areas under favorable environmental conditions.
Figure 1. Rectangular lesions of Grey Leaf Spot on corn.
Yield reductions are typically observed when lesions are present on the two leaves below the ear leaf or higher, so these are the leaves to pay close attention to when scouting. If over 50% of plants have lesions on 5% or more of this leaf surface, you may want to consider a fungicide application. If applying a fungicide, VT/R1 timing has shown the greatest chance of economic return.
Andrew Kness, Agriculture Agent University of Maryland Extension, Harford County
As corn and soybeans begin to enter reproductive growth stages, foliar fungal diseases can have a serious impact on yield if growing conditions favor their development. However, with the hot and dry weather, disease pressure is low and will remain low if these weather patterns persist. Weather patterns in the Mid-Atlantic can switch rapidly and in general, fungicides need to be applied as a protectant, so spray decisions need to be made before the onset of disease. Coupled with the fact that many new fungicides on the market today are promoted to help plants cope with stresses, such as drought and heat, can complicate the decision.
I like to remind folks that fungicides are designed to do one thing—and that is to manage fungal diseases; they do this job very well. Hundreds of university trials have demonstrated that the most likely yield response and economic return occurs when fungicides are applied at the correct time and used when disease pressure is high. When disease pressure is low, yield responses sometimes occur, but are far more inconsistent than when disease is present.
There is also limited university data regarding fungicide utility to help plants manage drought stress. In the lab, strobilurin and triazole fungicides have been shown to regulate stomatal conductance and photosynthesis intensity in some corn hybrids, which improves the plants response to drought. However, when conducted at the field level, results are inconsistent and do not occur predictably. More research is needed to determine if fungicides can improve yields in drought conditions, and if so, when the application should be made. Existing studies indicate that the fungicide needs to be applied before drought stress occurs in order to stimulate the appropriate response in the plant; which again, makes spray decisions difficult without a crystal ball in hand to see into the future.
Another consideration, and perhaps the most important, is economics. While a fungicide application may provide some measurable differences in appearance and/or yield, is it enough to cover the application cost? Again, this is a tricky question to answer, but the body of research indicates that a single fungicide application in corn around VT-R1 and R1-R3 in soybean is the most likely to provide an economic return on investment when disease is present. In the absence of disease, the probability of an economic return is very low. Here are some additional factors that you should account for when considering a fungicide:
Crop history and tillage: Many fungal pathogens of corn and soybean are residue-borne. If growing corn-on-corn or soybeans after soybeans, those fields will be prone to higher disease risk. Conservation tillage fields are also at higher risk.
Irrigation: In dry years, fields that are overhead irrigated will be at higher risk of developing fungal diseases than dryland fields.
Disease progression: Scout your fields and see if and where fungal lesions are present on the plants. Many of the most important diseases of corn and soybean start low in the canopy and progress up the plant if environmental conditions are conducive (Fig. 1). For soybean it is critical to keep the top ⅓ of the plant clean of disease from flowering to pod fill; and for corn, it is critical to keep the ear leaf clean. If you notice fungal pathogens encroaching on these upper plant parts as they begin to flower and tassel, a fungicide application may be beneficial to protect yield.
Figure 1. Two economically significant diseases of corn and soybeans: grey leaf spot lesions on corn (left) and frogeye leaf spot lesions on soybean (right).
Hybrid and variety resistance: Pay attention to your corn hybrid and soybean variety foliar disease ratings (resistance ratings are disease-specific); those that are more susceptible will have the greatest chance of an economic return on investment to a fungicide application than resistant varieties. Planting resistant varieties and hybrids is one of the most effective disease management tools.
Resistance management: It is generally considered bad practice to spray a fungicide when disease potential is low, as you are exposing pathogens to unnecessary chemistry, and with each exposure you drive the population towards resisting that chemical. This is why it is important to rotate modes of action and use full label rates, as cut rates can accelerate the development of resistance. The Take Action website (https://iwilltakeaction.com/) can help you choose products with differing modes of action.
The take-home message is to realize that you have the greatest chance for an economic return on your investment with a fungicide application when disease actually develops. Applying a fungicide to help plants cope with drought stress will likely not help to a degree that covers the cost of the application; as replicated field trials have yielded inconsistent and unpredictable results.