Andrew Kness, Senior Agriculture Agent | akness@umd.edu University of Maryland Extension, Harford County
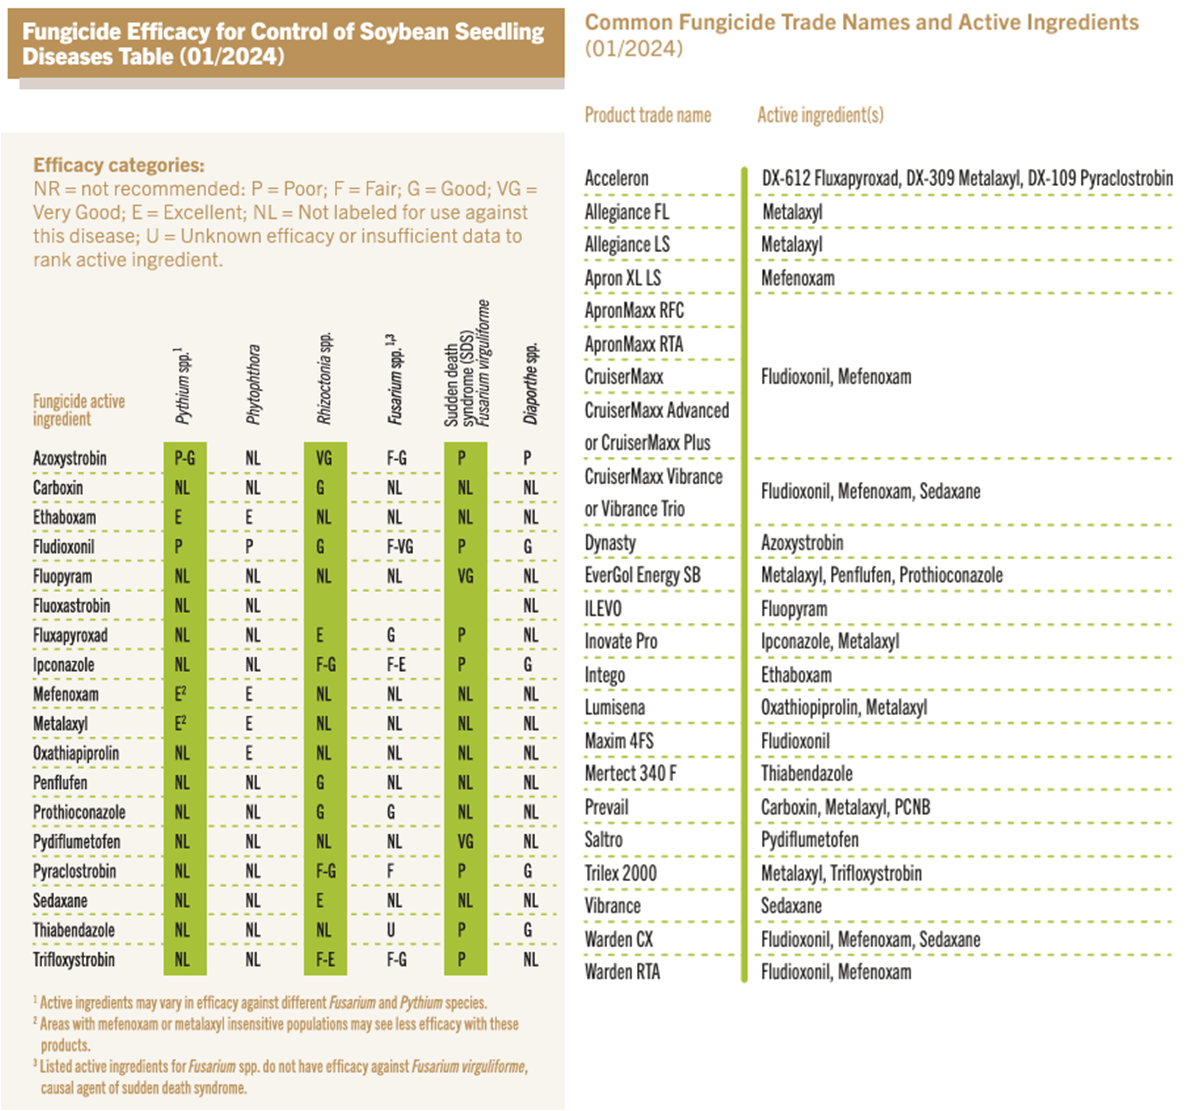
Various fungal pathogens can infect seedling soybeans and cause disease, especially beans planted early into cool and/or wet soils. Fungicide seed treatments have varying levels of efficacy against these pathogens, so it is important that your seed is treated with the correct chemical for the pathogens you are trying to manage in your field. The table below can be used to compare fungicide seed treatment efficacy against various soilborne pathogens of soybean. Note that fungicide seed treatments will provide about 2-4 weeks of protection. These tables are produced by the Crop Protection Network and the full publication can be accessed at cropprotectionnetwork.org.
Jarrod Miller1, Agronomy Extension Specialist | jarrod@udel.edu and Nicole Fiorellino2, Agronomy Extension Specialist 1University of Delaware |2University of Maryland, College Park
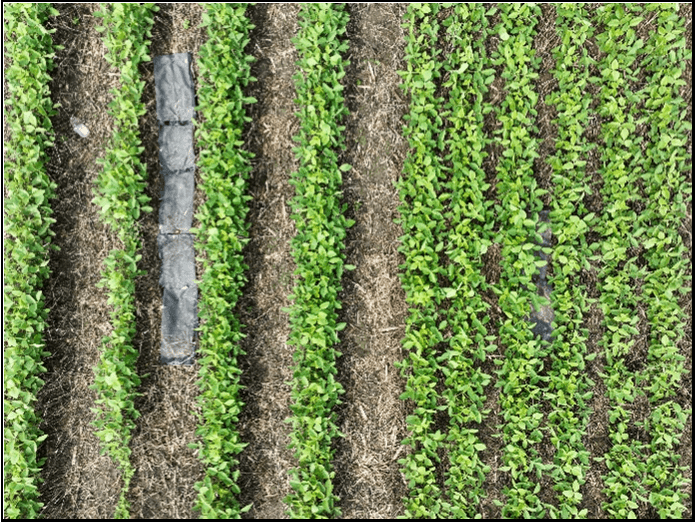
15″ (right) vs. 30″ (left) soybeans.
Soybean Row Spacing and Population Studies
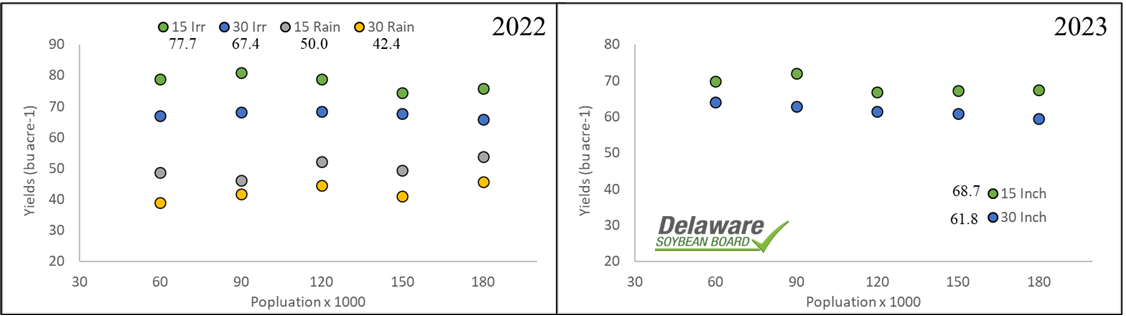
Modern soybean varieties can tolerate lower seeding rates and still produce good yields, providing there are no other issues with stand loss or stress. In southern Delaware two studies (2022 and 2023) observed no yield difference when planting full season beans (MG 4.2, late May planting date) when planted between 60,000 to 180,000 seeds per acre (Figure 1). You may consider dropping your seeding rates, considering your regional weather, planting date, and soil conditions.
Figure 1. Soybean yields by a) population, row spacing, and irrigation in 2022 (average yields below the legend) and b) irrigated yields by population and row spacing in 2023. Soybeans were planted in a coastal southern- Delaware climate.
Over both years, 15” row spacing provided an 8-to-10-bushel advantage compared to 30” rows. A narrower row spacing helps soybeans canopy faster, providing more leaf area per acre to increase yields. Water is consistently a major yield limiting factor, where irrigation boosted yields by 26 bushels in 2022. All these yield differences were statistically significant
Maryland and Delaware Planting Date Studies
Planting soybeans earlier can provide more vegetative growth before flowering commences, closing the canopy earlier and providing more nodes for pods. In years prior, soybeans would be planted after corn, so that early planting usually referred to May. Now we may consider late April to be early, and many mid-western studies have observed yields steadily decline as soybeans are planted later into May. Even when you choose to plant earlier, colder soils (<50°F) and saturated conditions can limit germination and growth. What is considered early for the Mid-Atlantic though, where our climates range from Coastal to Appalachian?
Between 2020-2022, University of Maryland and University of Delaware performed planting date trials for soybeans from lower Delaware (Georgetown) to the mid-shore (Wye Rec, MD), piedmont (Clarksville, MD), and Ridge & Valley (Keedysville). All planting dates were at least two weeks apart, typically starting in mid-April (weather and field conditions permitting) and the final planting date in mid to late May (Table 1).
Table 1. Planting dates for each site and year of the study for early, mid, and later planting dates.
Site
Year
Early (1)
Mid (2)
Late (3)
Delaware
2020
8-May
21-May
4-Jun
2021
12-Apr
28-Apr
10-May
2022
13-Apr
26-Apr
11-May
Wye
2021
23-Apr
12-May
28-May
2022
2-May
23-May
7-Jun
Clarksville
2021
21-Apr
5-May
19-May
2022
18-Apr
2-May
28-May
Keedysville
2021
11-May
28-May
7-Jun
2022
28-Apr
11-May
31-May
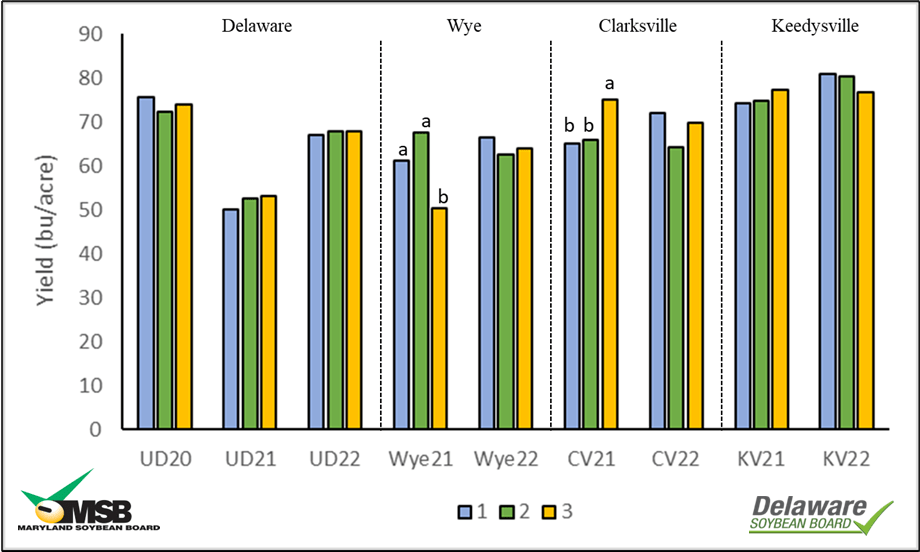
Although earlier planting (April) did produce earlier canopy closure and sometimes earlier flowering, yields were only statistically different at two site years, the Wye and Clarksville in 2021 (Figure 3). The latest planting date at the Wye (May 28th) did have the lowest yields, compared to either April 23 or May 12, 2021. In Clarksville, yields were higher on the latest planting date of May 19th, compared to April 21st or May 5th. This could be due to the timing of rainfall or temperature conditions during early stages that season, as there was a lot of variability for the first two planting dates in yield.
For the other seven site by year combinations, there was no benefit to planting earlier, but there was also no yield penalty (Figure 3). In fact, we purposely did not apply a seed treatment to provide a more suitable environment for disease pressure. At the UD site in 2021, one row unit planted too deep in April, but yields remained similar to May planting. Freeze damage at UD in 2022 cause the death of some leaf and cotyledon tissue, but the soybeans recovered and matched later planted yields.
As there was no clear benefit to planting in mid to late April for soybeans, planting decisions can be made based on field suitability, disease presence, or tillage and soil temperatures. As noted in the population studies above, these decisions should be matched with local knowledge of yield potential, planting dates, and potential freeze damage.
Figure 3. Soybean yields based on early (1), mid (2), and later (3) planting dates for soybeans in Delaware (UD), the Wye Rec, MD, Clarksville Rec (CV), MD, and Keedysville Rec (KV), MD.
Shannon Dill, Principal Agriculture Agent | sdill@umd.edu University of Maryland Extension, Talbot County
The University of Maryland Extension has updated www.go.umd.edu/grainmarketing site with new input data and spray programs for the 2024 field crop budgets.
Crop Budgets
Cost of production is very important when making decisions related to your farm enterprise and grain marketing. Preliminary surveys from 2024 UME Winter Crop Production meetings report 66% of farmers believe input costs are the greatest challenges facing their farm operation. Enterprise budgets provide valuable information regarding individual enterprises on the farm. This tool enables farm managers to make decisions regarding enterprises and plan for the coming production year. An enterprise budget uses farm revenue, variable cost, fixed cost, and net income to provide a clear picture of the financial health of each farm enterprise.
The 2024 Maryland enterprise budgets were developed using average yields and estimated input costs based on producer and farm supplier data. Fertilizer prices, pesticide availability, and fuel expenses have fluctuated greatly. The figures presented are averages and vary greatly from one farm and region to the other. It is, therefore, crucial to input actual farm data when completing enterprise budgets for your farm.
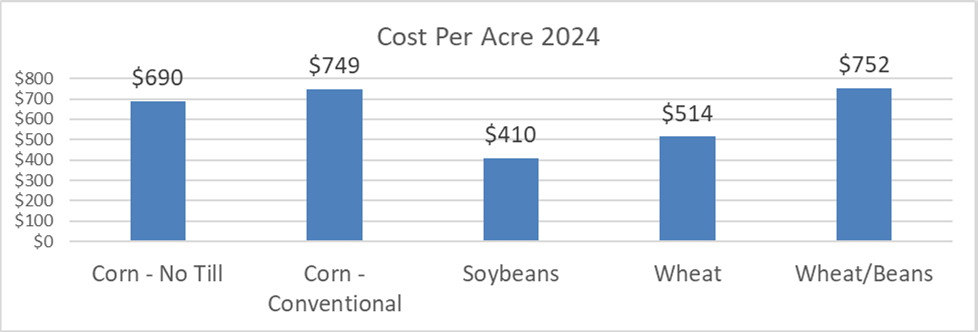
Cost Per Acre, 2024
Year
Corn
No Till
Corn
Conventional
Soybeans
Wheat
Wheat/Beans
2021
$540
$592
$346
$401
$608
2023
$736
$800
$423
$538
$800
2024
$690
$749
$410
$514
$752
Difference 23-24
-$46
-$51
-$13
-$24
-$48
Percent Change
-6%
-6%
-3%
-4%
-6%
How to Use University Enterprise Budgets
The enterprise budgets can be used as a baseline for your operation, and you can change these budgets to include your production techniques, inputs, and overall management. The budgets are available electronically in PDF or Excel. Use this document as a start or reference to create your crop budgets. Contact information is on the website if you have problems downloading any information.
2024 Crop Summary
Cost per acre expenses for 2024 have decreased a small amount from 2023 record highs. Based on estimates received cost of production includes: corn no-till costs $690 per acre, corn conventional $749 per acre, soybeans $410 per acre and wheat $514 per acre. While these are slightly (3-6%) lower than 2023 they are still 16%-22% higher than prices just 3 years ago (2021).
Nicole Fiorellino, Extension Agronomist | nfiorell@umd.edu University of Maryland, College Park
Please find attached a copy of the 2023 Soybean Variety Trials results. The trial is performed annually at multiple UMD Research and Education Centers and we thank the managers at the facilities for their assistance with these trials. The factsheet can also be downloaded from the MD Crops website at https://psla.umd.edu/extension/md-crops. Many thanks to Louis Thorne, Joe Crank, and Shana Burke for their leadership and management of the trials, from seed organization, to planting, to harvest. These trials could not be completed without them.
We are grateful for the funding provided by Maryland Soybean Board to support these trials. MSB provides our program with checkoff funding to support applied agricultural research and generate results that directly benefit Maryland soybean growers.
Andrew Kness, Senior Agriculture Agent | akness@umd.edu University of Maryland Extension, Harford County
Trials were established at the Wye Research and Education Center in Queenstown, MD (WYE), Central Maryland Research and Education Center in Ellicott City, MD (CMREC), and Western Maryland Research and Education Center in Keedysville, MD (WMREC) in 2022 to assess the efficacy of select fungicides for the suppression of soybean foliar diseases. Soybean ‘MAS3521E3’ were no-till planted into soybean residue at 150,000 seeds/A on 1 Jun at WMREC and 31 May at CMREC and WYE. All plots were 30 feet long and arranged in a randomized complete block design with 5 replications. Data was collected from the center 5-ft of each plot. The trial consisted of eight foliar fungicide treatments and a non-treated control. Fungicides were applied with a backpack CO2-pressurized sprayer. Fungicides were applied at the R3 growth stage on 5 Aug at CMREC and WYE and 8 Aug at WMREC. Treatments with subsequent applications were made 14 days later. Yields were collected by harvesting the center 5-ft of each plot and adjusted to 13% moisture. Plots were harvested on 8 Nov at WYE, 18 Nov at CMREC, and 22 Nov at WMREC. Data were analyzed using ANOVA, and significant differences between treatments were separated using Fisher’s Least Significant Difference (LSD; α=0.10).
The most predominant foliar pathogen at all locations was frogeye leaf spot (Cercospora sojina); however, growing conditions were generally very favorable and no disease was observed at a ratable level. This is likely due to the weather conditions around pod fill, as well as the resistance package in the soybean variety, which has a frogeye leafspot resistance rating of 7 on a 10-point scale (10 being the most resistant). Yields were above average, and no significant differences were observed between treatments at any location. No phytotoxicity was observed with any of the fungicide treatments. Data for 2023 is being processed and will be uploaded to the Agronomy News Blog once available. This work was funded by the Maryland Soybean Board.
Treatment, rate/A
and timing
Grain Moisture (%)
Test Weight (lb)
Yield (bu/A)
WMREC
CMREC
WYE
WMREC
CMREC
WYE
WMREC
CMREC
WYE
Non-treated control
10.6
12.6
10.7
54.7
56.3
54.3
78.4
72.1
52.0
Headline 2.09 EC/SC, 6.0 fl oz at R3
10.5
12.2
10.5
54.7
56.5
54.4
91.0
74.0
59.8
Veltyma 3.34 S, 7.0 fl oz at R3
10.5
12.5
10.5
54.2
56.5
54.3
90.3
72.0
70.9
Miravis Top 1.67 SC, 13.7 fl oz at R3
10.6
12.2
10.5
55.4
54.0
54.3
86.5
63.0
59.2
Adastrio, 8.0 fl oz at R3
10.5
12.7
10.5
54.9
55.4
54.7
84.6
58.0
58.0
Revytek 3.33 LC, 8.0 fl oz at R3
10.6
12.4
10.4
54.9
55.2
54.3
82.3
76.1
62.9
Revytek 3.33 LC, 8.0 fl oz at R3 fb
Revytek 3.33 LC, 8.0 fl oz 14 days after R3
10.6
12.7
10.5
54.8
55.4
54.2
83.6
58.9
60.9
Lucento 4.17 CS, 5.0 fl oz at R3
10.5
12.4
10.5
54.6
55.4
54.4
83.4
67.2
62.6
Lucento 4.17 CS, 5.0 fl oz at R3 fb
Lucento 4.17 CS, 5.0 fl oz 14 days after R3
10.6
12.4
10.5
54.6
55.7
54.4
81.9
64.0
55.5
p-value
0.8716
0.3464
0.7067
0.2440
0.7375
0.9531
0.6583
0.7095
0.3133
z Means followed by the same letter are not significantly different based on Fisher’s Least Significant Difference (LSD; α=0.10).
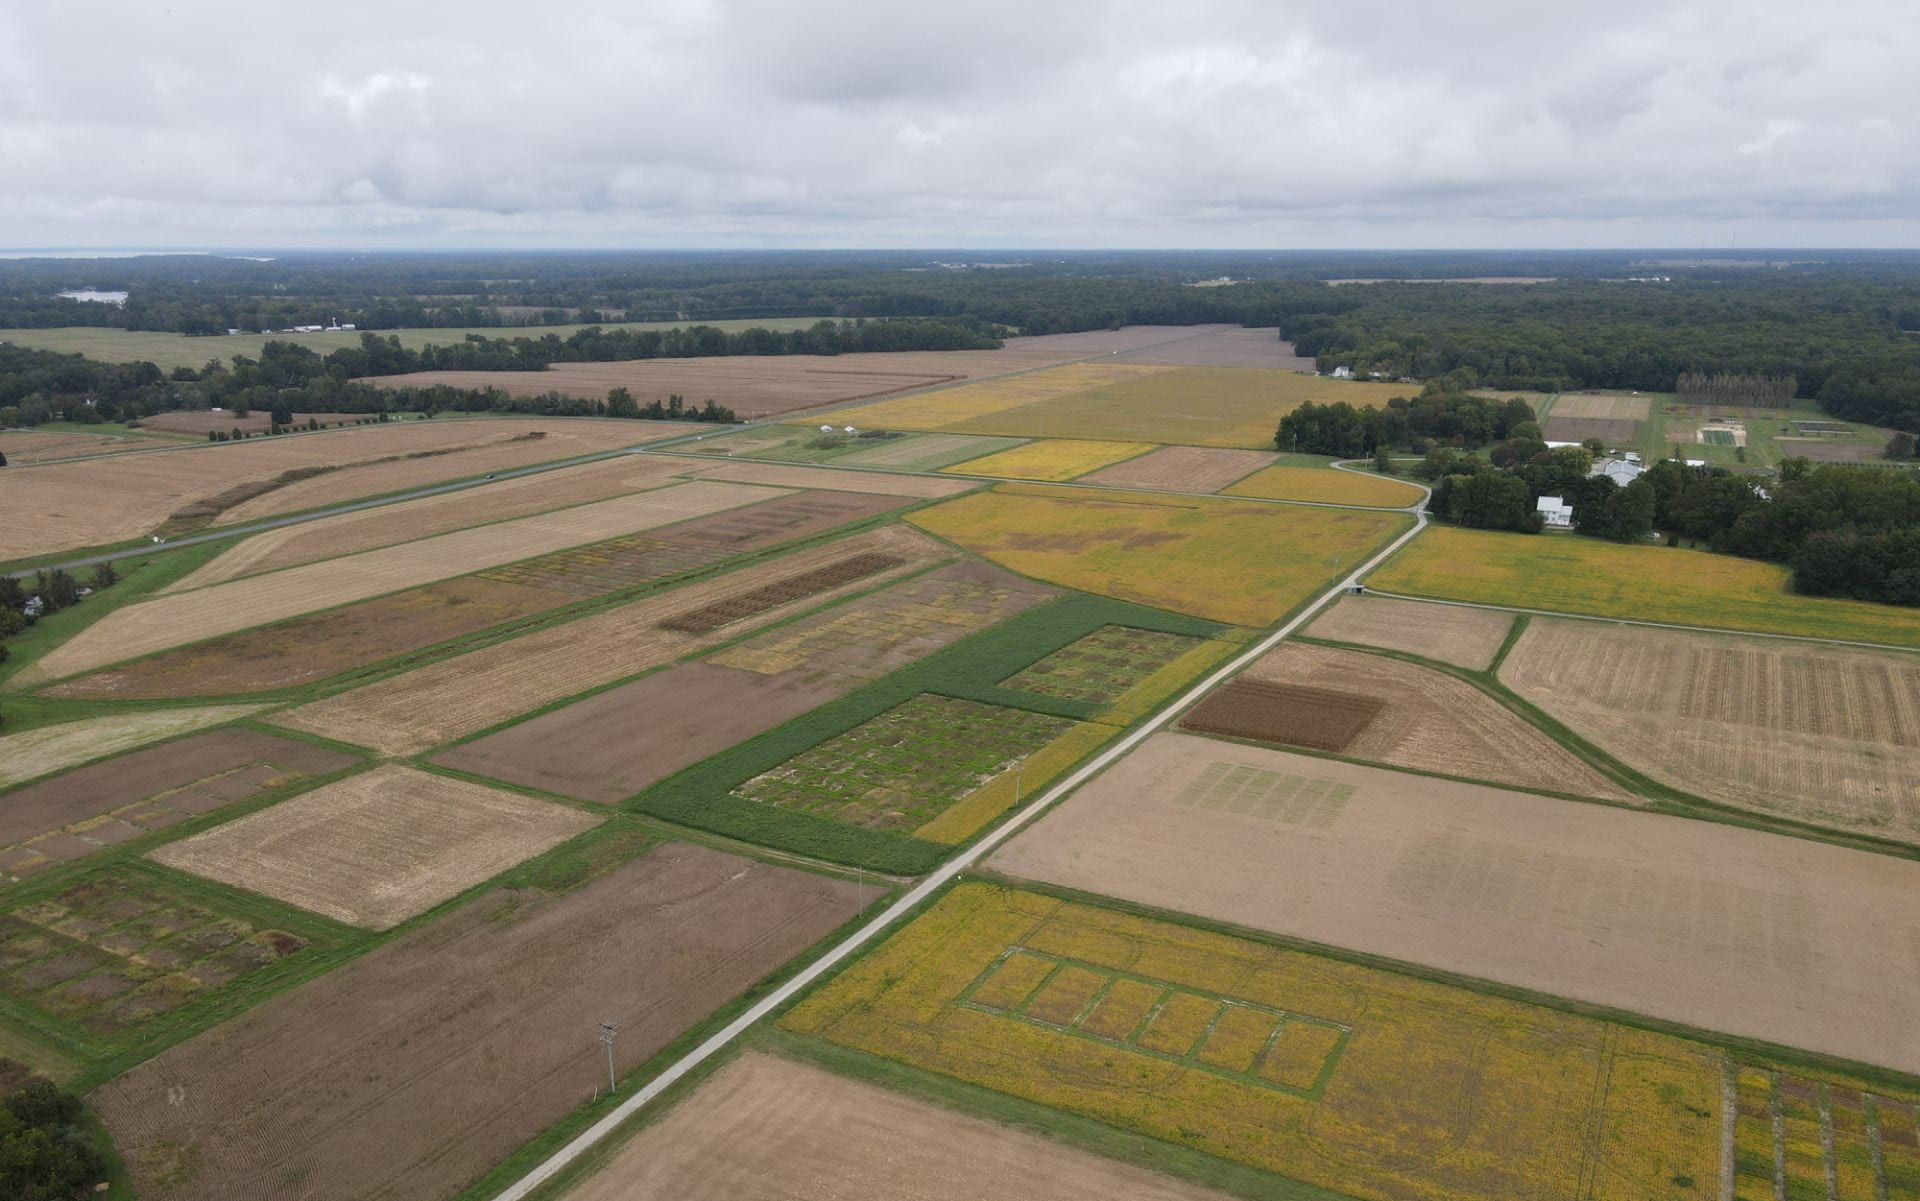
Kurt Vollmer, Dwayne Joseph, and Alan Leslie University of Maryland
Figure 1. A flame treatment is applied to control emerged weeds in soybean.
Starting clean or weed-free is the key to a good weed control program, especially when noxious weeds, such as Palmer amaranth are present. While conventional growers can use soil-active herbicides to manage these weeds, control is more complicated in organic systems. Flame weeding is a non-chemical tactic that has been shown to control several grass and broadleaf weed species. The majority of flame weeding treatments are applied to emerged weeds; however, studies have also shown flame treatments to have detrimental effects on the seeds of certain weed species post-dispersal. Furthermore, seeds from species such as horseweed (marestail) and Palmer amaranth tend to germinate from shallower depths in the soil profile, and may be more readily controlled by flaming on or near the soil surface. Cultivation/tillage is another tactic that can be used to control weeds in both conventional and organic systems. However, cultivation can lead to additional weed emergence and cannot be used when the soil is wet. Flame weeding may help to supplement weed control when cultivation is not an option.
In 2023, a study funded by the Maryland Soybean Board was conducted at sites in Caroline and Kent county Maryland to evaluate flame-weeding as an integrated tactic for early-season weed control in soybean (Table 1). All plots were flamed immediately after planting followed by 1 or 2 additional flame treatments or flame treatments integrated with a cultivation treatment when weeds reached 3” in height. In addition, different walking speeds (1 and 2 mph) were tested to determine if longer flame exposure improved weed control. All flame treatments were made using a propane-powered Inferno Flame Weeder (Neversink Farms, Figure 1), and cultivation was done using a 25cc 2-cycle gas-powered cultivator (Craftsman).
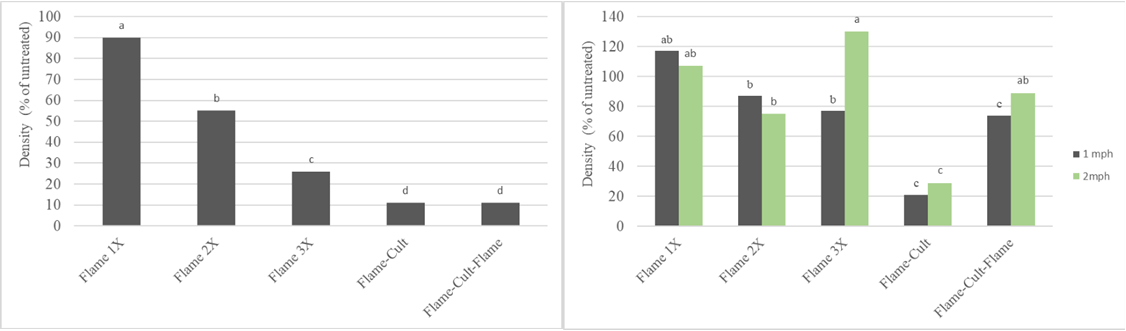
Results from both studies showed that flame treatments affected overall broadleaf density, but cultivation was needed to attain higher levels of control. Flame treatments alone helped to reduce weed density at the Kent County study relative to the untreated check, with three subsequent flame treatments showing a reduction in broadleaf weed density compared to one or two flame treatments (Figure 2).
Figure 2 (left). Broadleaf weed density at the Kent County site 5 weeks after planting. Figure 3 (right). Palmer amaranth density at the Caroline County site 4 weeks after planting. Values followed by the same letter are not significantly different according to Student’s T-Test (α = 0.05).
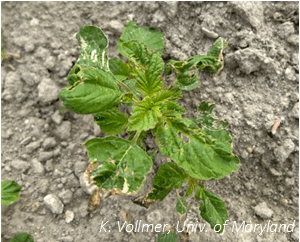
While a diversity of species were present at the Kent County site, Palmer amaranth was the dominant species at the Caroline County site. At this site both treatment and walking speed had an effect on Palmer amaranth density 4 weeks after planting. While the majority of flame treatments did not differ from one another, Palmer amaranth density was lower with 3 subsequent flame treatments at 1 mph compared 3 subsequent flame treatments at 2 mph (Figure 3). Similar results were observed with the flame followed by cultivation followed by flame treatment suggesting that longer flame exposure may be needed for effective Palmer amaranth control. It should also be noted that Palmer amaranth varied in height at the time of postemergence applications, with flame treatments having a reduced effect on larger weeds (Figure 4).
Figure 4. Palmer amaranth injury following flame weeding.
While results from both sites showed that flame treatments can reduce weed density, weed control was not maintained at acceptable levels throughout the growing season. In the case of the Caroline County site, the level of the Palmer amaranth infestation was too high to produce a viable crop. These results suggest that preemergence flame treatments are not a viable option for weed management compared to postemergence flame treatments. However, additional research is needed to determine how postemergence flame treatments may be better integrated into a more comprehensive weed control program.
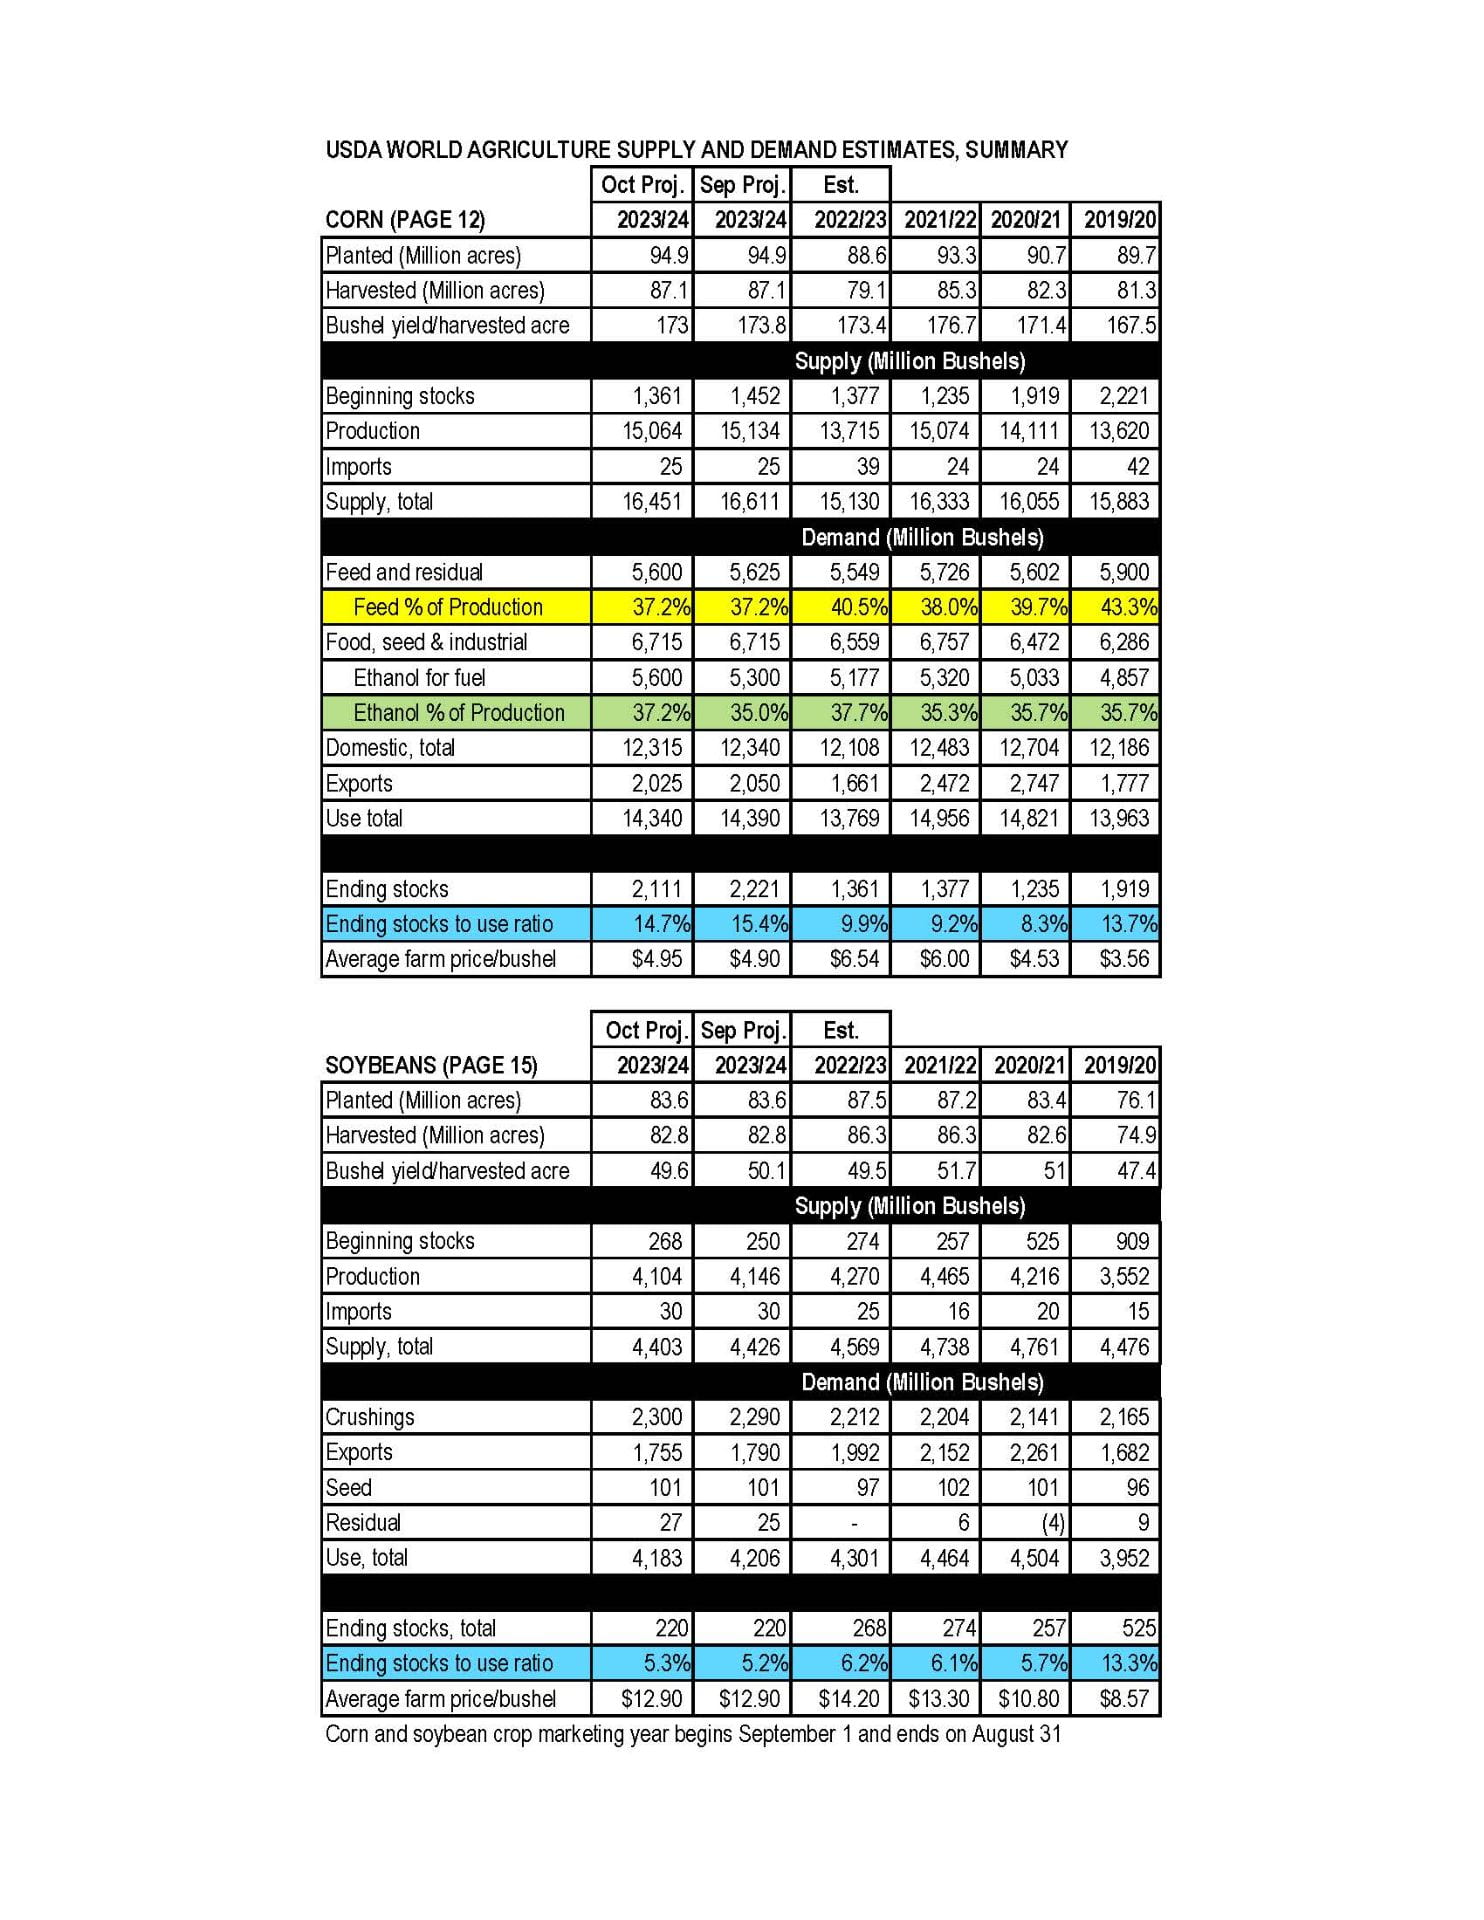
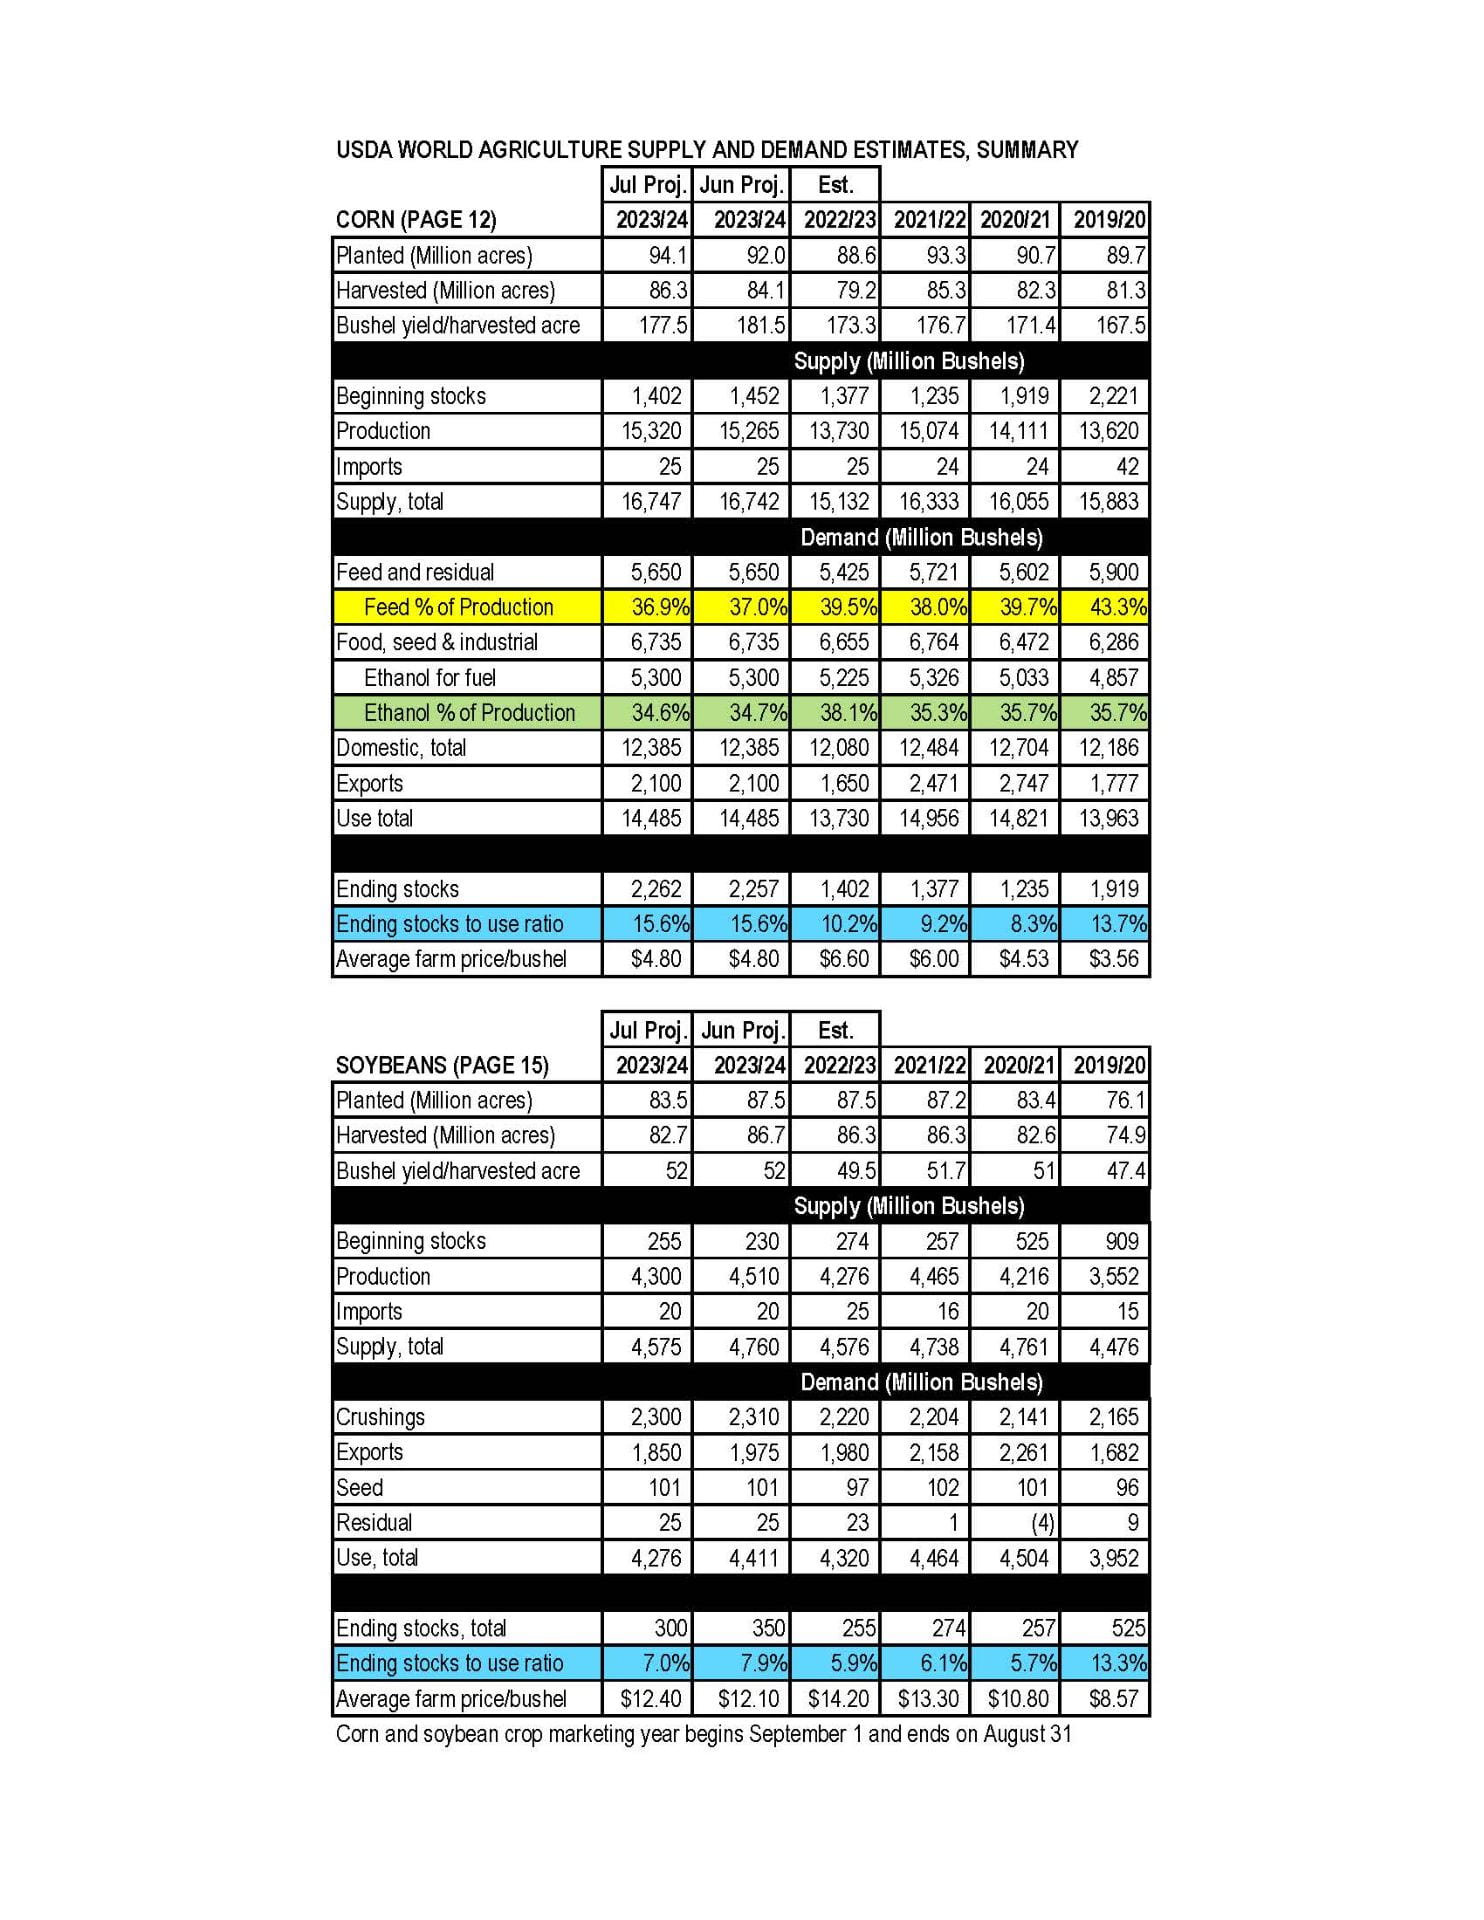
Attached is the summary for the October 2023 WASDE.
Corn
This month’s 2023/24 U.S. corn outlook is for reduced supplies, lower feed and residual use and exports, and smaller ending stocks. Corn production is forecast at 15.064 billion bushels, down 70 million on a cut in yield to 173.0 bushels per acre. Corn supplies are forecast at 16.451 billion bushels, a decline of 160 million bushels from last month, with lower production and beginning stocks. Exports are reduced by 25 million bushels reflecting smaller supplies and slow early-season demand. Feed and residual use is down 25 million bushels based on lower supply. With supply falling more than use, corn ending stocks for 2023/24 are lowered 110 million bushels. The season-average corn price received by producers is raised 5 cents to $4.95 per bushel.
Soybean
Soybean production is forecast at 4.1 billion bushels, down 42 million on lower yields. Harvested area is unchanged at 82.8 million acres. The soybean yield is projected at 49.6 bushels per acre, down 0.5 bushels from the September forecast. The largest production changes are for Kansas, Michigan, and Nebraska. With lower production partly offset by higher beginning stocks, supplies are reduced 24 million bushels. Soybean exports are reduced 35 million bushels to 1.76 billion with increased competition from South America. Soybean crush is projected at 2.3 billion bushels, up 10 million, driven by higher soybean meal exports and soybean oil domestic demand. Soybean oil domestic use is raised in line with an increase for 2022/23. With lower exports partly offset by increased crush, ending stocks are unchanged from last month at 220 million bushels.
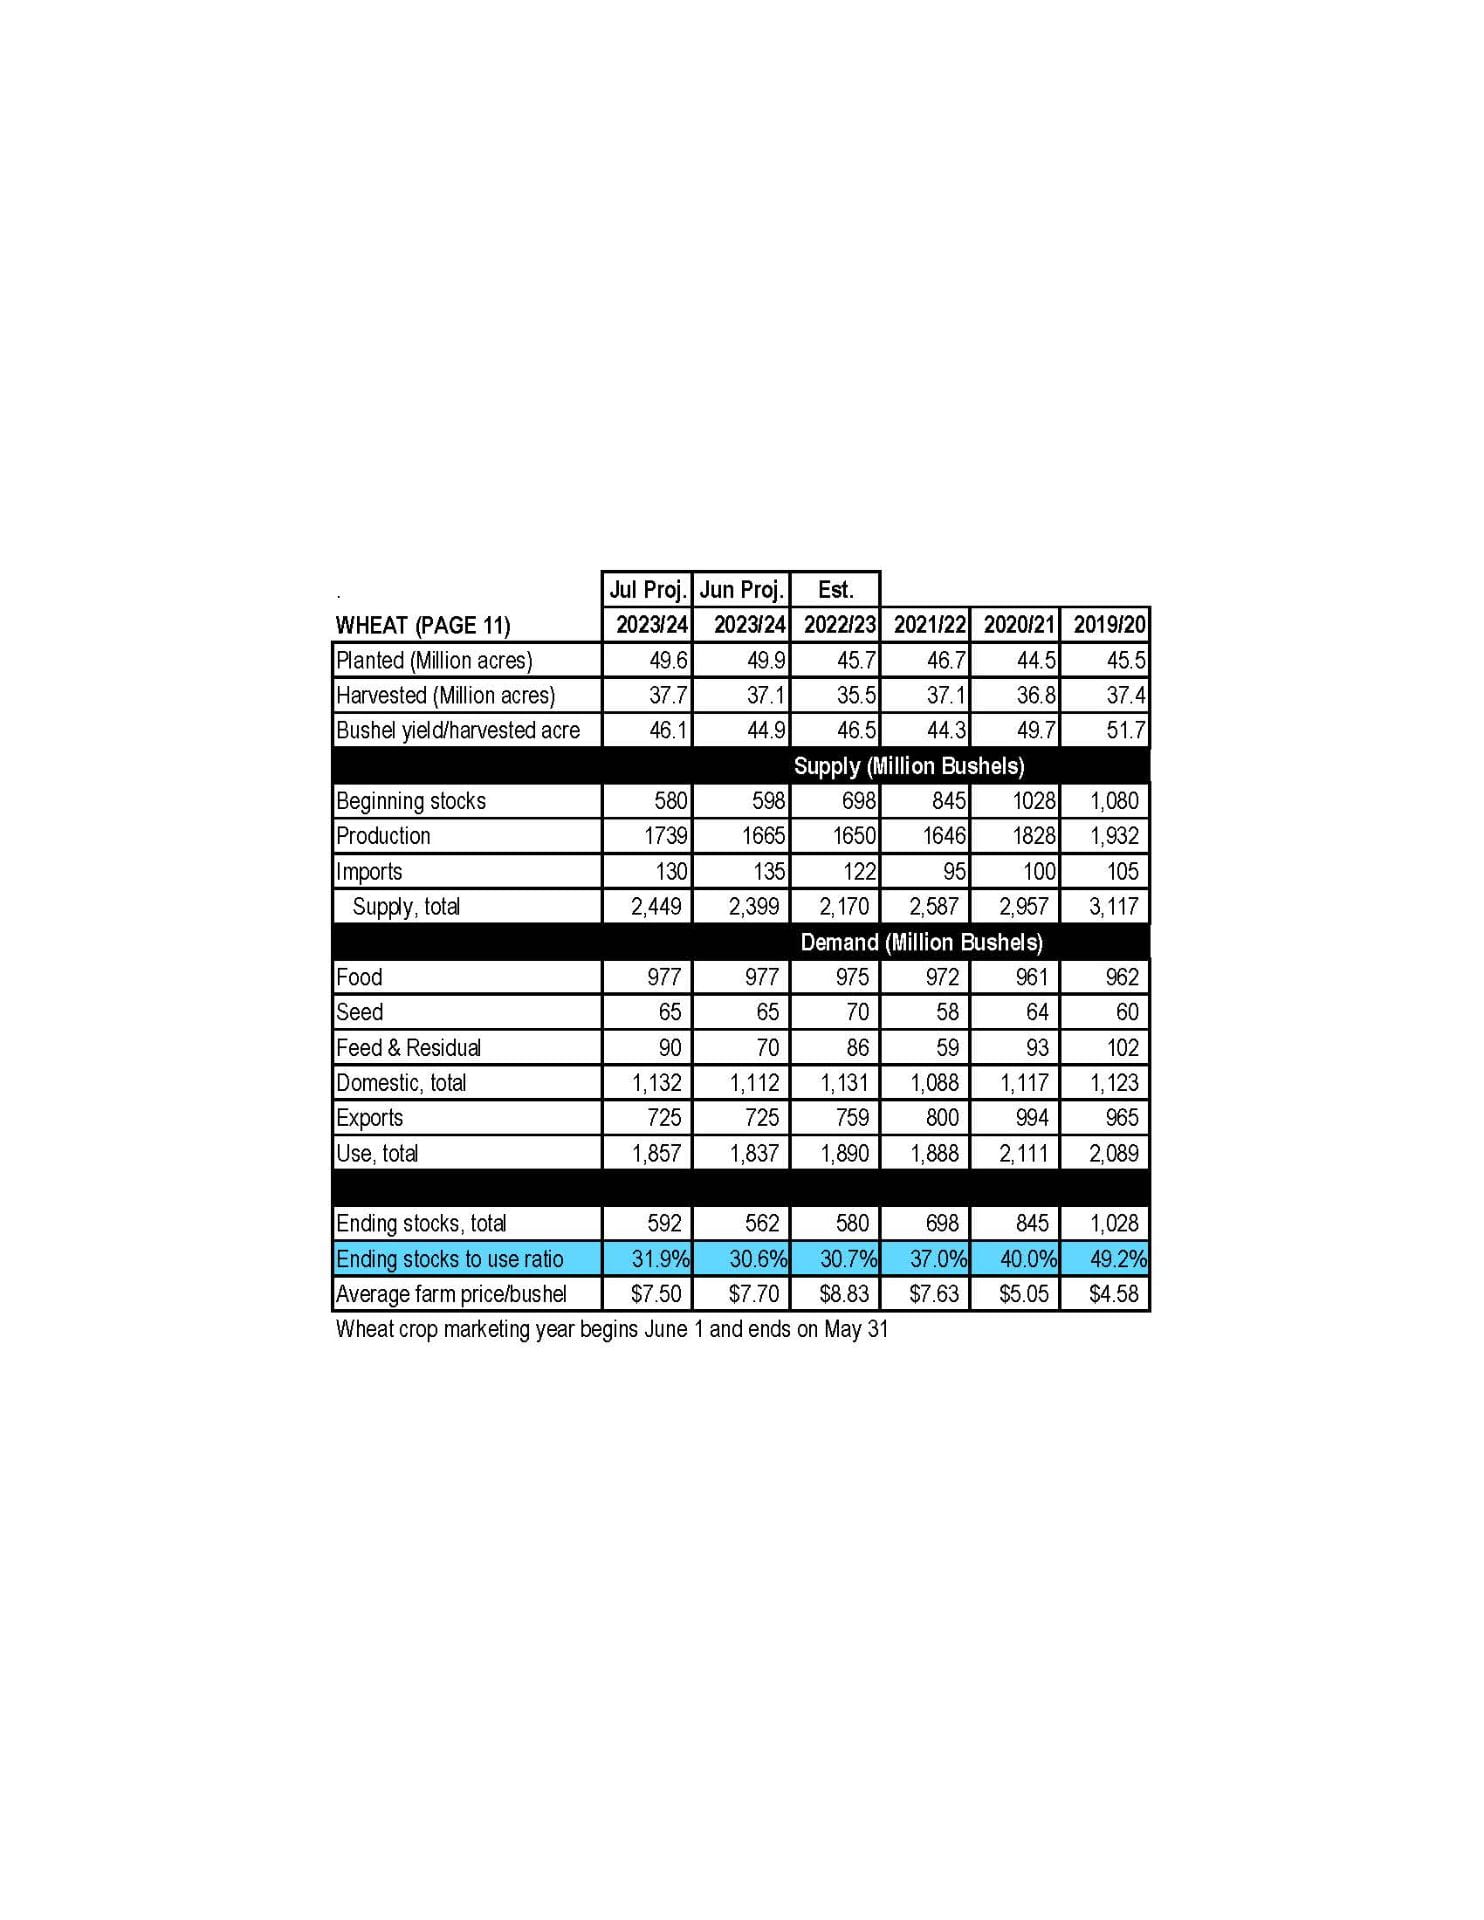
Wheat
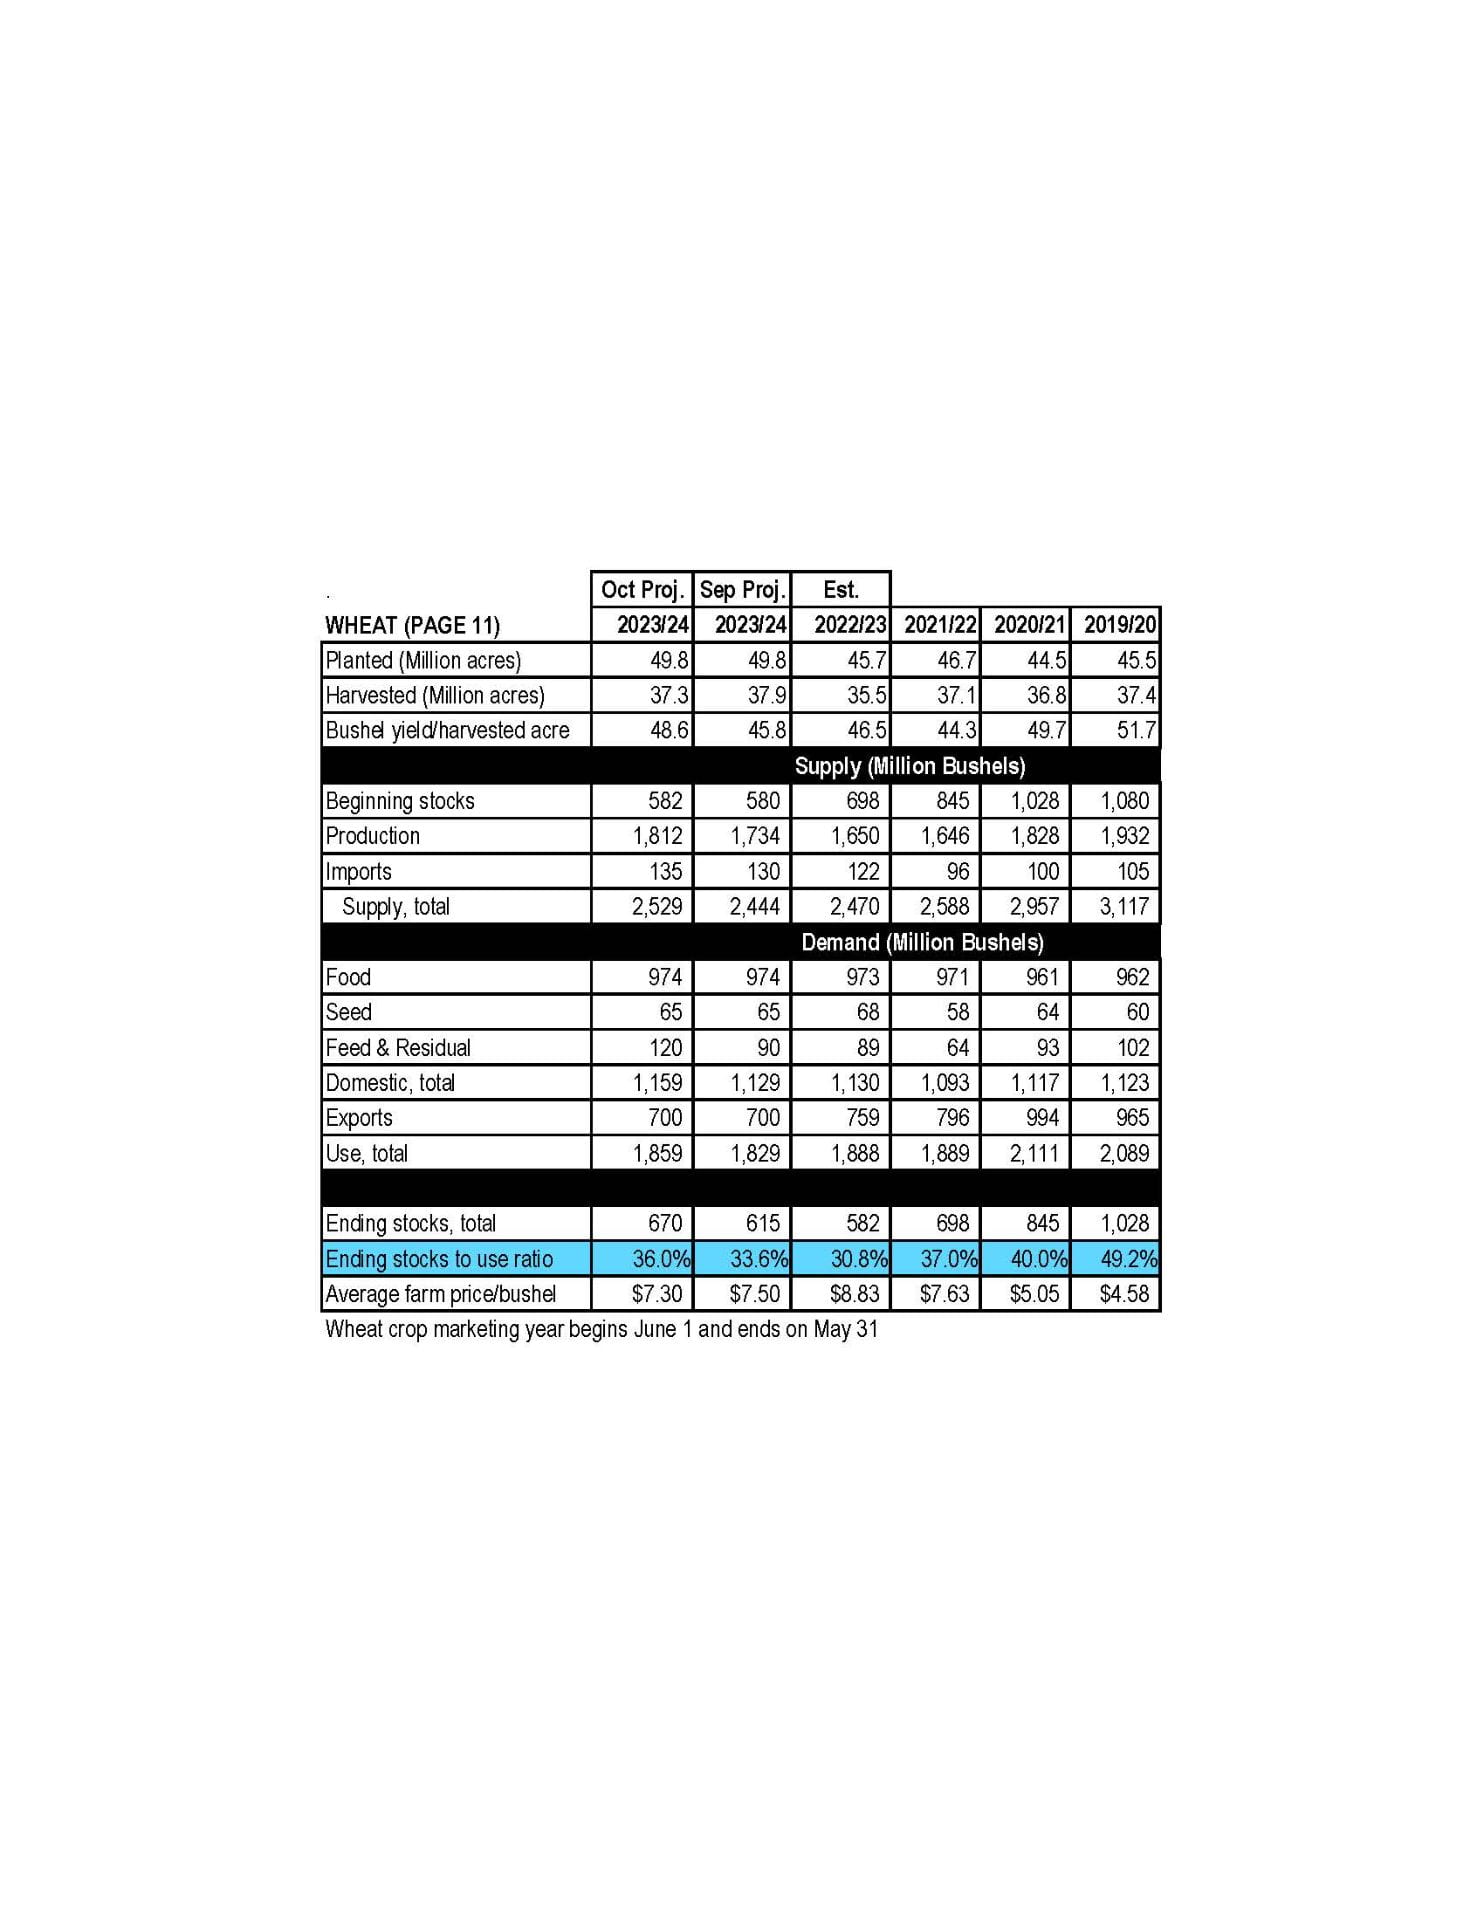
The outlook for 2023/24 U.S. wheat this month is for higher supplies, increased domestic use, unchanged exports, and higher ending stocks. Supplies are raised 85 million bushels, primarily on higher production as reported in the NASS Small Grains Annual Summary, released September 29. Domestic use is raised 30 million bushels, all on higher feed and residual use. The NASS Grain Stocks report released September 29 indicated a higher year-to-year increase for first quarter (June-August) domestic disappearance than previously expected. Exports remain at 700 million bushels with several offsetting by-class changes. Projected ending stocks are raised by 55 million bushels to 670 million, up 15 percent from last year. The season average farm price is reduced $0.20 per bushel to $7.30 on higher projected stocks and expectations for futures and cash prices for the remainder of the marketing year.
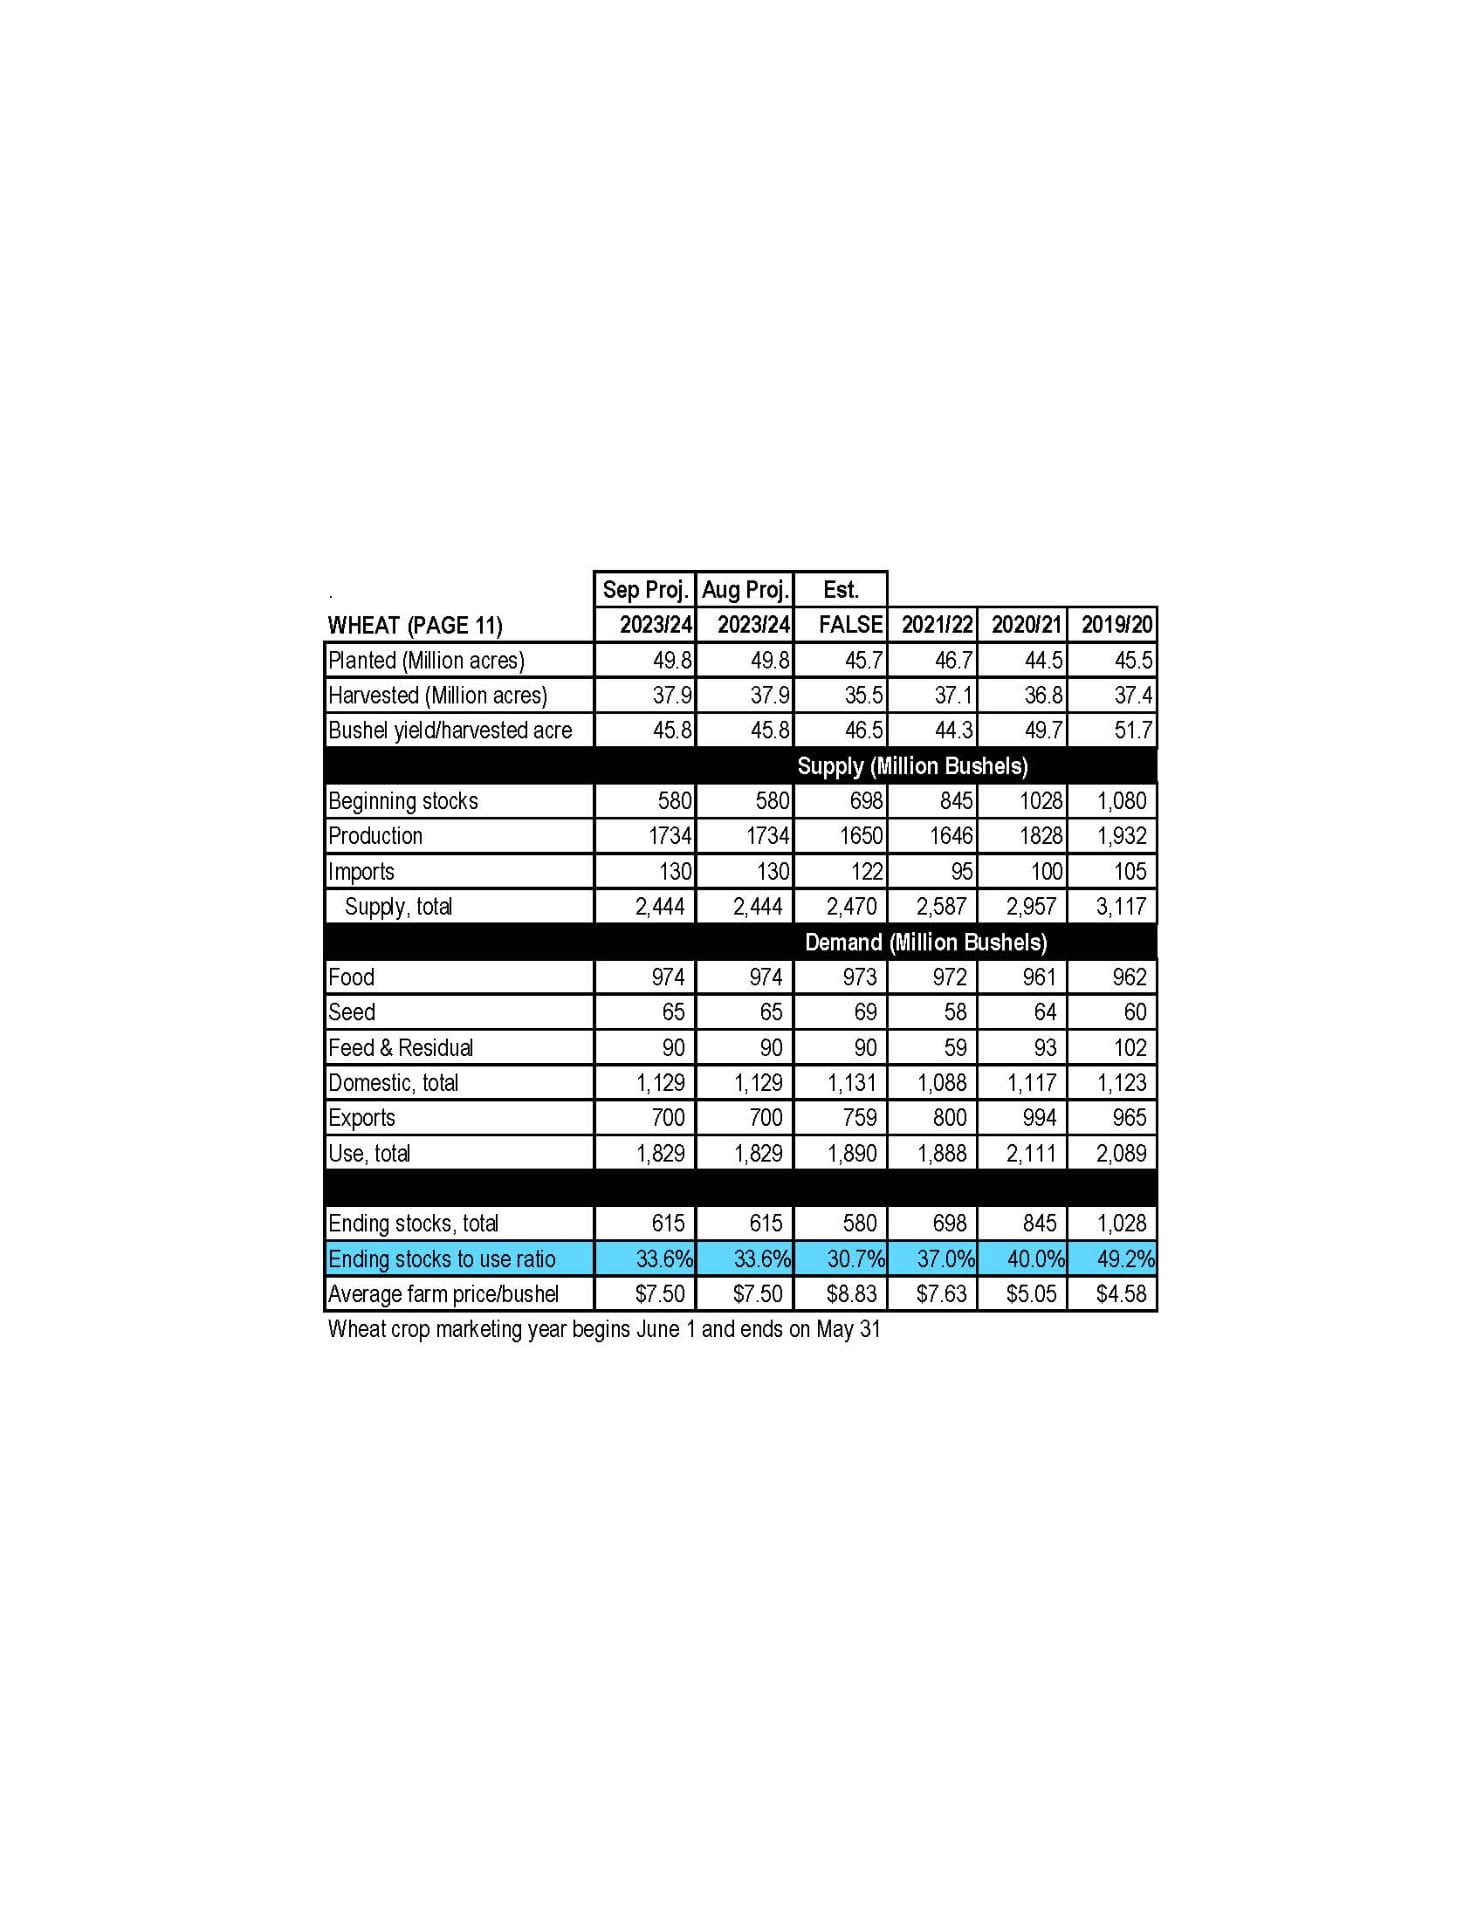
Attached is the summary for the September 2023 WASDE.
Corn
This month’s 2023/24 U.S. corn outlook is for slightly larger supplies and ending stocks. Projected beginning stocks for 2023/24 are 5 million bushels lower based on mostly offsetting trade and corn used for ethanol changes for 2022/23. Corn production for 2023/24 is forecast at 15.1 billion bushels, up 23 million from last month as greater harvested area more than offsets a reduction in yield. The national average yield is forecast at 173.8 bushels per acre, down 1.3 bushels. Harvested area for grain is forecast at 87.1 million acres, up 0.8 million. Total U.S. corn use is unchanged at 14.4 billion. With supply rising slightly and use unchanged, ending stocks are up 19 million bushels to 2.2 billion. The season-average corn price received by producers is unchanged at $4.90 per bushel.
Soybeans
U.S. soybean supply and use changes for 2023/24 include lower beginning stocks, production, crush, exports, and ending stocks. Lower beginning stocks reflect an increase for exports in 2022/23. Soybean production is projected at 4.1 billion bushels, down 59 million with higher harvested area offset by a lower yield. Harvested area is raised 0.1 million acres from the August forecast. The soybean yield of 50.1 bushels per acre is down 0.8 bushels from last month. The soybean crush forecast is reduced 10 million bushels and the export forecast is reduced 35 million bushels on lower supplies. Ending stocks are projected at 220 million bushels, down 25 million from last month. The U.S. season-average soybean price is forecast at $12.90 per bushel, up $0.20 from last month. The soybean meal price is unchanged at $380 per short ton and the soybean oil price is raised 1.0 cent to 63.0 cents per pound. Other changes this month include higher peanut and lower cottonseed production.
Wheat
The 2023/24 U.S. all wheat outlook for supply and use is unchanged this month with offsetting by-class changes on exports. The projected 2023/24 season-average farm price is also unchanged at $7.50 per bushel.
Kurt Vollmer, Weed Management Specialist | kvollmer@umd.edu University of Maryland Extension
Many may be preparing to apply certain postemergence herbicides to soybeans in the next couple of weeks. Those planning to spray Liberty (glufosinate) or Enlist One (2,4-D), should be aware that time is running out to spray these herbicides this season. The crop cutoff stage to apply Liberty in soybeans is “R1” and Enlist or Enlist Duo is “through R1.”
In addition, many may want to apply one of these products as a rescue treatment to control large weeds. At this time of year, it is likely that these weeds are beyond the label recommended growth stage. Some may have previously applied glufosinate and want to follow up with 2,4-D or vice versa. However, research has shown that tank mixing these products will provide better control of larger weeds compared to individual products alone. Both of these products can be applied over the top of E3 soybeans. Consider using the maximum-labeled rate for each herbicide. Liberty can be applied at maximum rate of 43 fl oz/A per application (87 fl oz/year) and Enlist One can be applied at a maximum rate of 2 pt/A (6 pt/year). Be sure to include 1.5 to 3 lbs of ammonium sulfate, apply at a spray volume of 15 gal/A, and follow all label instructions concerning drift.
This month’s 2023/24 U.S. corn outlook is for fractionally higher supplies and ending stocks. Corn beginning stocks are lowered 50 million bushels, as greater feed and residual use for 2022/23 more than offsets reductions in corn used for ethanol and exports. Corn production for 2023/24 is forecast up 55 million bushels as greater planted and harvested area from the June 30 Acreage report is partially offset by a 4.0-bushel reduction in yield to 177.5 bushels per acre. According to data from the National Centers for Environmental Information, harvested-area-weighted June precipitation data for the major Corn Belt states represented an extreme downward deviation from average. However, timely rainfall and cooler than normal temperatures for some of the driest parts of the Corn Belt during early July is expected to moderate the impact of June weather. For much of the crop the critical pollination period will be in the coming weeks. With supply rising fractionally and use unchanged, ending stocks are up 5 million bushels. The season-average farm price received by producers is unchanged at $4.80 per bushel.
Soybean
Soybean production is projected at 4.3 billion bushels, down 210 million on lower harvested area. Harvested area, forecast at 83.5 million acres in the June 30 Acreage report, is down 4.0 million from last month. The soybean yield forecast is unchanged at 52.0 bushels per acre. With lower production partly offset by higher beginning stocks, 2023/24 soybean supplies are reduced 185 million bushels. Soybean crush is reduced 10 million bushels reflecting a lower soybean meal domestic disappearance forecast. Soybean exports are reduced 125 million bushels to 1.85 billion on lower U.S. supplies and lower global imports. With lower supplies only partly offset by reduced use, ending stocks for 2023/24 are projected at 300 million bushels, down 50 million from last month. The U.S. season-average soybean price for 2023/24 is forecast at $12.40 per bushel, up $0.30 from last month.
Wheat
Changes this month to the 2023/24 U.S. wheat outlook increase supplies and domestic use, leave exports unchanged, and increase ending stocks. Supplies are raised on larger production, which is up 74 million bushels to 1,739 million, on higher harvested area and yields. The first 2023/24 survey-based production forecast for other spring and Durum indicates a decrease from last year. Conversely, winter wheat production is forecast higher on larger harvested area and higher yields. Gains for all wheat production are partly offset by smaller beginning stocks, which are lowered 18 million bushels to 580 million as indicated in the Grain Stocks report, issued June 30. The 2023/24 ending stocks are forecast at 592 million bushels, 30 million higher than last month. The projected season-average farm price is forecast at $7.50 per bushel, down $0.20 from last month.