Ag Commodity Markets: Review and Outlook

Mark Townsend, Agriculture Agent Associate | mtownsen@umd.edu
University of Maryland Extension, Frederick County

Grain markets have slid significantly from the highs posted last summer that followed the perceived drought in the Midwest.
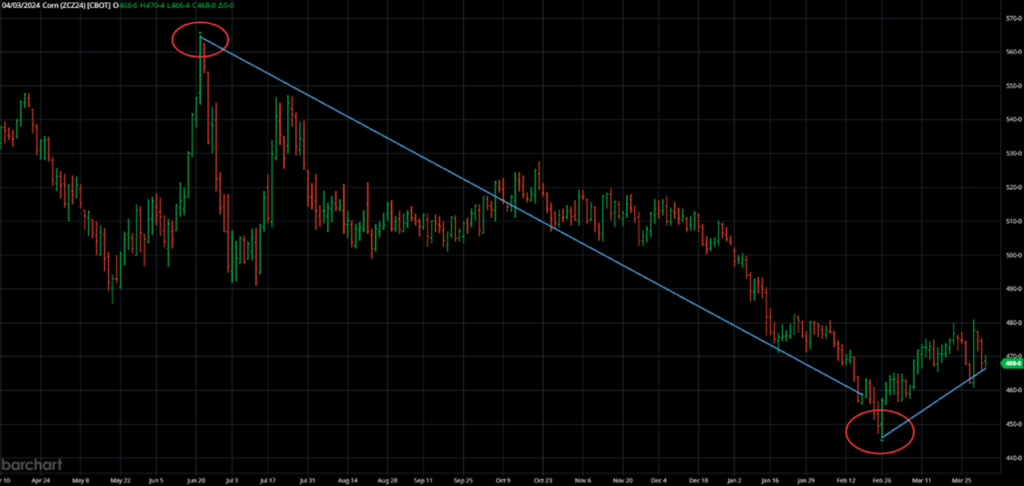
Image Credit: Barchart: December ‘24 Corn Contract from June 2023 to April 3, 2024.

Unfortunately, these drought concerns were generally unfounded as key growing areas received timely rains to keep yields from suffering in the corn belt. In fact, the U.S. set a new corn production record at 15.234 billion bushels topping the previous record set in 2016 at 15.148 billion bushels. The trifecta of a record large U.S. crop, a large Brazilian corn crop, as well as underwhelming domestic and export demand sent prices spiraling lower from August 2023 to February 2024. The March ‘24 Corn contract traded at three-year lows on February 26th dipping below $4 following 11 consecutive week-over-week price declines.

Soybeans were unfortunately no better, falling $2.90 from their summer high ($14.18) to their low ($11.28) in the March ‘24 contract. Much of the same stories plagued this market including an unrealized weather rally and outstandingly large South American production that punished U.S. export demand.

To add insult to injury, “the Funds”—traders in the market who manage money for clients as either hedges or other investment strategies hit a record 340,732 net short position in the corn market on February 20th. Simply stated, these traders placed the largest-ever bet on corn prices continuing to decline, which has placed a metaphorical wet-blanket on any hopes of a rally.

Today

Grains have rallied from the end of February and throughout March. The inflection point was the last day of notice for March hedge-to-arrive (HTA) contracts. To that point, sellers (farmers, dealers, etc.) had the choice of pricing corn at current prices or “rolling” the contract to the May contract. The bleak outlook forced many hands and stimulated selling which pulled prices lower until the selling pressure was over.

Since then, both the corn and soybean markets have rallied off the lows and recovered to price levels previously seen in early February. The upward momentum has been driven by a phenomenon known as “short covering” that creates a positive feedback loop–the more it happens, the more it happens. As prices rise, “The Funds” in their net short position lose money as their bet has turned against them. To stop this, they must exit their position by buying a contract to offset the one they previously sold1. The buying stimulates further price increases that induce another fund manager having to offset their short position. At its extreme, this feedback loop can throw prices to astronomical levels2. In this case, the bump is a welcomed change but is unlikely to send us much higher for now.

More recently, the USDA released its Prospective Plantings Report compiled from surveys asking farmers their planting intentions this season. The report suggests growers will plant 90 million acres of corn and 86 million acres of soybeans, indicating that growers are shifting acres away from corn to soybeans. This was unsurprising, however traders found this as good news as the nearby contracts in both markets traded higher the day of the report. However, traders are generally wary of this recent report given the low farmer response rate and the tendency for acreage figures to climb with subsequent USDA planting reports.
Season Outlook:

The saying, “all models are wrong, but some are useful” may hold true for commodity market predictions as well; there is a significant degree of uncertainty in any market that can render any forecast absolutely incorrect. As such, this is not meant to be a forecast but more of an observation of trends and conditions that may prove useful.

Supply and Demand Fundamentals
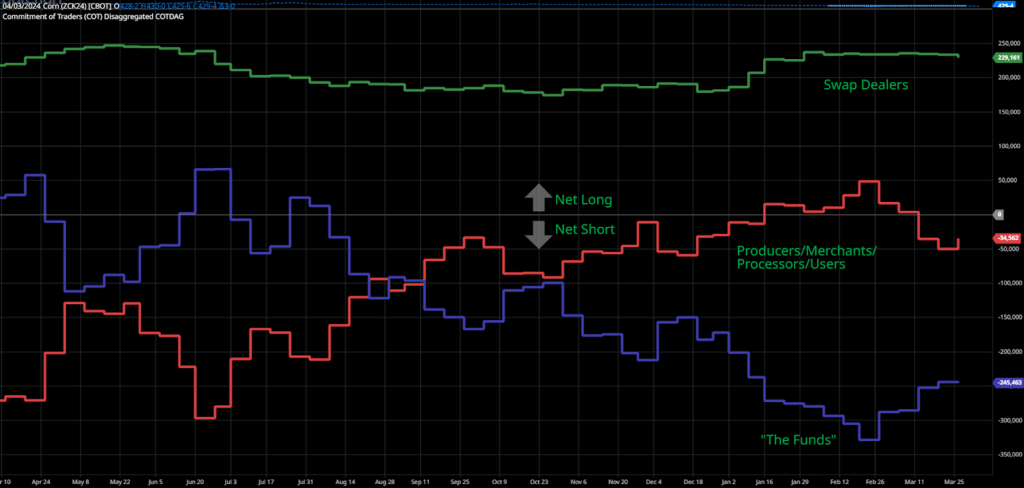
Image Credit: Barchart. CFTC Commitment of Traders in the Corn Market (all contracts).

Every market most fundamentally relies on the interplay between supply and demand. Currently in the grains, supply has outstripped demand. Following last year’s record crop, U.S. corn supply is almost burdensome.

A common metric that evaluates how efficiently we use the crop we grow is the Ending Stocks-to-Use (S/U) ratio derived from the USDA World Agricultural Supply and Demand Estimate (WASDE) each month. Currently, the USDA projects the 2024/25 ending stocks (that which we will not use from the crop we’re about to plant) at 2.53 billion bushels and an S/U ratio of 17.2%–a level we have not seen since the 2006 when corn traded at an average price of $2.62/bu. This current 2023/24 marketing year (ending Sept. 1, 2024) is currently pegged at 14.9% S/U ratio–well higher than the 7-10% range of the last three years and the 12.6% historical average.

The soybean side of things is only marginally better and certainly not rosy by any stretch. The current S/U ratio projection for this year’s crop is 9.9% with the current marketing year sitting at 7.6%. Both these figures are a far cry from the burdensome supplies we accrued during the 2018-2019 trade war with China (22.9% S/U) yet they signal a surplus of soybeans.

Market Movers

With the current fundamentals dreary at best, it’s pleasant to think of those things that could actually help prices higher.

  1. Midwestern drought conditions continue to worsen throughout the growing season. US weather conditions are a significant driver of price action in the growing season–as exemplified by last year. Currently, some of the Midwest is experiencing a moderate drought, with some agronomists questioning the subsoil moisture levels before planting. Importantly, drought conditions would have to persist throughout the growing season well past planting. Generally, drought is bearish to corn in April and May as Midwest growers can plant at a breakneck pace just in time for timely rains that pull yields higher and prices lower. As evidenced by last year, corn did not rally until late-May over weather concerns and in 2012, corn did not rally until mid-June. Both these years indicate that prices will likely stay mixed until real concern over crop condition emerges during the growing season.
  2. The South American (Brazil + Argentina) soybean production is lower than expected, improving export demand for U.S. soybeans. Soybean harvest in Brazil is nearing completion, however final production estimates remain volatile. The same is true with South American corn production: a supply-side shock could support U.S. corn prices. Brazil has completed corn planting this last week of its large safrinha corn crop. Currently, much of the key corn growing regions are in a minor drought or have experiences greater than normal rainfall. More serious and persistent crop-damaging weather events could certainly be a boon to the U.S. market.
  3. Recently, the Federal Reserve signaled that it will likely keep the Federal Funds rate higher for longer–increasing borrowing costs. If this holds true, investors may find themselves less attracted to debt and equity markets as companies may have a more difficult time generating earnings. Instead, investors may revert back to commodities–a market often seen as a hedge against inflation–as they did in 2022. As mentioned above, this may trigger a significant unwinding of short positions which could carry the market to higher prices. Unfortunately, this is likely the most unlikely scenario for increasing commodity prices as equities soar to all time highs in recent weeks.

So What Can We Do About It? 

Marketing grain in 2024 will likely be challenging on all fronts. Put another way, given the current outlook, it is incredibly unlikely that selling grain in the fall at harvest prices will be a winning strategy. Similarly, it’s unlikely that an unhedged, unpriced JFM ‘25 sale will offer anything better as there are additional storage costs involved. That said, developing a preharvest marketing strategy may very well be a key to success this marketing season. Betting on the aforementioned weather stories is hardly a marketing plan.

Like every year the first step is knowing your cost of production inside and out. Marketing opportunities will present themselves, but it will take knowing what is and what is not a good price. With today’s relatively high input costs, “yielding your way out” of low prices is more challenging than previous years. Therefore it may be more crucial than ever to make judicious agronomic decisions.

Take advantage of seasonal market patterns. Generally speaking, we see 3-6% increase in corn and soybean prices between mid-March and late-May from their post-harvest lows in January. As old crop marketing wanes, and concerns over the current year’s crop emerges (like the weather), prices rise slowly during this time. It may be best to price some grain sooner rather than later to take advantage of this general trend. Put it more directly; from May 1st to October 1st, corn prices fall more than $0.30, 74% of the time. Would you bet on something weighted 75% against you?

Track local basis. Generally, basis tends to follow broader market conditions especially when it comes to spreads between nearby and more distant contracts. Seasonal trends in basis also exist with harvest often being the low point and spring generally higher.

Keep a watchful eye on the markets this season. It may be such that prices are favorable for a day or two before they fall back lower.

Please also consider attending a University of Maryland Extension grain marketing meeting. These meetings are filled with all the above strategies, general information, and more that could help you with your marketing decisions.

Best of luck to you all. Here’s to blue skies and high prices!

Footnotes & References:

1 This may seem counter-intuitive. For a review on futures contracts please visit CME’s Self Study Guide to Hedging with Grain and Oilseed Futures and Options.

2 https://en.wikipedia.org/wiki/GameStop_short_squeeze

January 2022 Grain Market Report

Dale Johnson, Farm Management Specialist
University of Maryland

Information from USDA WASDE report

Attached is the summary for the January 2022 WASDE.

Corn

2021/22 harvested acres estimate was increased by 300,000 acres which increased production and supply estimate by 52 million bushel. On the demand side there were minor adjustments with the net effect of a demand estimate increase of 5 million bushel. The result of these supply and demand estimates was an increase in ending stocks of 47 million bushels increasing the stocks-to-use ratio to 10.4% from 10.1 in December. March 2022 futures increased from $5.92 on December 9 to peaked at $6.18 on December 28 and close at $5.99 on January 12.

Soybeans

There were minor adjustments in soybean supply and demand estimates resulting in an increase of ending stocks estimate of 10 million bushels and an increase in the stocks-to-use ratio from 7.8% to 8.0 %. January 2022 futures price increased dramatically from $12.65 on December 9 to close at $13.91 on January 12.

Wheat

On the supply side, wheat import estimate was decreased by 10 million bushel. On the demand side, Feed and Residual estimate was decreased by 25 million bushel and export estimate was decreased by 15 million bushels. The net effect of supply and demand adjustments was an increase in ending stocks of 30 million bushel. The stocks-to-use ratio increased from 29.9% to 32%. December futures decreased from $7.77 on December 9 to $7.58 on January 12.

EPA Renews Enlist Product Registrations with New Control Measures, Providing Growers with Certainty for the 2022 Growing Season

EPA press release

Today, EPA is issuing seven-year registrations for two herbicide products, Enlist Duo and Enlist One, to ensure growers have access to effective pesticide tools for the 2022 growing season. The new product labels, which incorporate robust control measures to protect non-target plants and animals, meet Federal Insecticide, Fungicide, and Rodenticide Act (FIFRA) standards and comply with the Endangered Species Act (ESA).

Enlist Duo and Enlist One are herbicides used to control weeds in conventional and genetically-modified corn, cotton, and soybean crops. Both products, registered in 2014 and 2017, respectively, were set to expire in January 2022 if the Agency did not renew their product registrations. Based on EPA’s thorough analysis of scientific data, evaluation of cost-benefit information, and discussions with industry stakeholders, the Agency has determined that Enlist products, with the new protective measures in place, should remain available to most American farmers.

To evaluate the proposed uses of the Enlist products, EPA evaluated the potential effects of these products on federally threatened or endangered (listed) species, and their designated critical habitats, and initiated ESA consultation with the U.S. Fish and Wildlife Service.

EPA determined that the use of Enlist Duo and Enlist One are likely to adversely affect listed species but will not lead to jeopardy of listed species or to the destruction or adverse modification of designated critical habitats. EPA also anticipates that the new protective measures will reduce the potential for “take.”

In addition to EPA’s effects determination, EPA also completed a comprehensive ecological risk assessment that assessed the risks of 2,4-D choline salt (2,4-D), an active ingredient in both Enlist products, and glyphosate dimethylammonium salt (glyphosate), an active ingredient in Enlist Duo.

EPA’s ecological assessment found direct risks to non-listed and listed plants from pesticide runoff (i.e., pesticide carried off the application site following rainfall or irrigation) and risks to animals that rely on these affected plants for diet or habitat, including non-listed and listed animals and some designated critical habitats. EPA’s ecological assessment also found direct effects to bees and listed species that use corn, cotton, and soybean fields for diet and/or habitat.

Based on these findings, EPA is requiring the implementation of a variety of protective measures as a condition of the product registrations. Some of the protective measures EPA is taking include:

  • Prohibiting Enlist product application when rainfall is expected to occur within 48 hours and when soil can no longer absorb water;
  • Prohibiting irrigation that would result in runoff within 48 hours of application of the Enlist herbicide products;
  • Requiring users to select from a list of runoff reduction measures to reduce 2,4-D and glyphosate concentrations in runoff, while also providing users with flexibility;
  • Minimizing Enlist product application when soybean and cotton crops are in bloom to reduce risks to insect pollinators, such as honey bees; and
  • Requiring the registrant to develop and provide mandatory education and training materials that emphasize the importance of pollinators and pollinator habitat for species including, but not exclusive to, monarch butterflies.

EPA will also be prohibiting the use of Enlist Duo and Enlist One in counties where EPA identified risks to on-field listed species that use corn, cotton or soybean fields for diet and/or habitat. EPA does not expect this measure to disrupt the use of Enlist products for most American farmers—the counties where use will be prohibited by these new measures represents approximately three percent of corn acres, eight percent of cotton acres, and two percent of soybean acres nationally.

The “likely to adversely affect” (LAA) determination means that EPA reasonably expects that at least one individual animal or plant, among a variety of listed species, may be exposed to the pesticide at a sufficient level to have an effect, which will be adverse. The LAA threshold for a Biological Evaluation (BE) is very sensitive because the likely “take” of even one individual of a species, which includes unintentional harm or death, triggers an LAA determination. This is the case even if a species is almost recovered to a point where it no longer needs to be listed. As a result, there is a high number of “may affect” and LAA determinations in these BEs. An LAA determination, however, does not necessarily mean that a pesticide is putting a species in jeopardy. Jeopardy determinations will be made by the U.S. Fish and Wildlife Service and the National Marine Fisheries Service in the course of formal consultation that evaluates any effects of the pesticides on entire species.

To view the final registration for Enlist Duo and Enlist One, go to docket EPA-HQ-OPP-2021-0957.

To learn more about Enlist Duo and Enlist One, read EPA’s Q&A.

2021 Maryland State Soybean Variety Trials

http://www.psla.umd.edu/extension/md-crops
Agronomy Facts No. 32 is prepared by Dr. Nicole Fiorellino, Mr. Louis Thorne, and Mr. Joseph Crank

planter and tractor in field
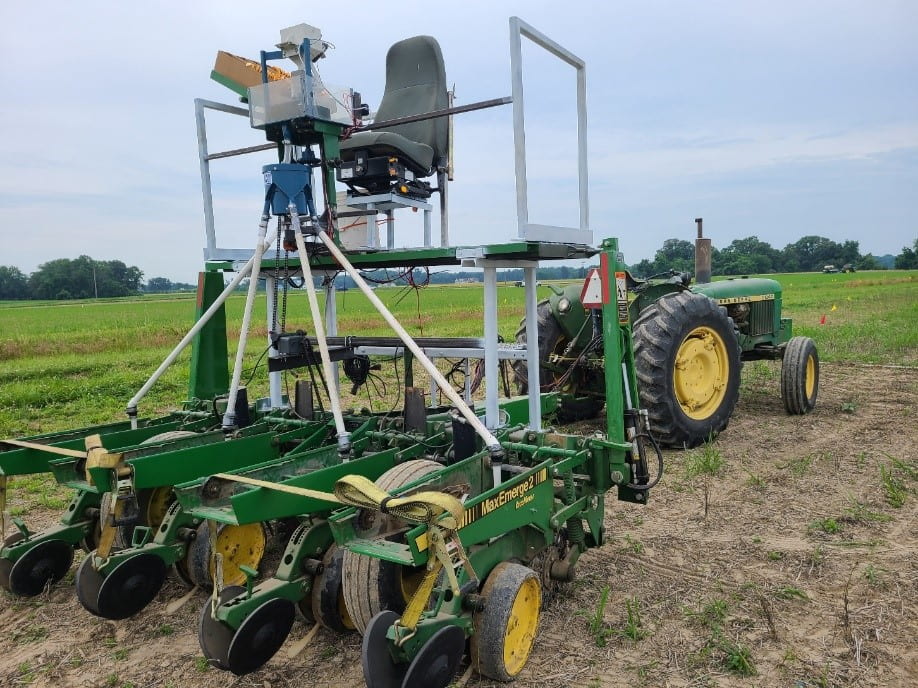
Figure 1. Modified no-till planter fabricated in 2021 for no-till planting of all plots in the test.


Click here to download the full report

Test Procedures

The University of Maryland offers a fee-based, soybean variety performance testing program to local and national seed companies. The results from these replicated trials provide agronomic performance information about soybean varieties tested at four locations in Maryland considered representative of the state’s geography and weather conditions. Table 1 summarizes the agronomic and production information for each test site.

Varieties tested in 2021 were entered by participating seed companies, listed in Table 2, that were solicited for submission of varieties. These varieties represented those currently available for purchase to experimental lines still under evaluation. Select Pioneer and Syngenta varieties were identified for use as checks in the test. The inclusion of the performance data for check varieties that are proven performers in the Mid-Atlantic region allows comparisons of newer varieties to proven varieties.

During 2021, 85 varieties were tested using four maturity groups: MG 3 (22 varieties, Table 6), early MG 4 (4.0-4.3, 21 varieties, Table 7), late MG 4 (>4.4, 36 varieties, Table 8) and MG 5 (6 varieties, Table 9). Check varieties were included in each of the tests. All genetic traits and seed treatments are listed in Tables 6-9.

Each variety was replicated three times per location. For 2021, we modified a John Deere Maxemerge 2 four-row, 30” spacing, no-till planter, with coulters and trash wheels. The modifications included the addition of a single cone planting unit that delivered seed to a spinner powered by a 12v motor to evenly distribute seed to the four planter units (Figure 1). Planting, harvest, and in-season management information is presented in Tables 1 and 2. We aimed for a seeding rate of 6-7 seeds/foot and plot harvest length was approximately 20 feet, but harvested plot length varied slightly across locations. Center two rows (~5 ft. swath) were harvested with an Almaco R1 research combine (Almaco Co., Nevada, IA). Grain yield, harvest moisture, and test weight were measured for each plot. These data were collected with a Seed Spector LRX system (Almaco Co., Nevada, IA) and recorded on Microsoft xTablet T1600. Due to the fabrication of the new planter, planting dates were slightly delayed – especially in the double crop tests. We believe this negatively impacted yields in these tests. Additionally, there was ample stover present on the surface at Central Maryland Research and Education Center when planting, and we believe poor seed-to-soil contact at planting negatively impacted yield at this location. Despite late planting, we were able to harvest plots in a timely manner, due to favorable fall weather conditions.

Test Results

The overall performance across the locations for the full season varieties in each maturity group is reported in Tables 10-13 and double crop varieties in Tables 28-31. Variety performance at individual locations can be found in Tables 14-27. The agronomic characteristics reported are yield, in bushels/acre at 13% moisture content, test weight (lb/bu) at 13% moisture, height in inches (at Wye location, one replication) and date to maturity (at Wye location, one replication).

A least significant difference (LSD) value is reported for each test where statistically significant differences (P ≤ 0.1) for yield was observed among varieties. The mean separation value has been calculated at the 10% probability level (LSD0.1). The LSD can be used to compare two varieties within the same test. For example, when the yield difference between two varieties is greater than the LSD value, there is a 90% certainty that the difference in yield is due to variety performance rather than due to random variability.

Relative Yield

The selection of a variety based solely on performance at one location is not recommended. It is better to select variety based upon performance over a number of locations and years, if possible. To compare the performance of each variety across the five locations, relative yield tables (Tables 32-35) are included. Relative yield is the ratio of the yield of a variety at a location to the mean yield of all the varieties at that location expressed in percentage. A variety that has a relative yield consistently greater than 100 across all testing locations is considered to have excellent stability.

Acknowledgments

The University of Maryland Agronomy Trials Center work would not be possible without the assistance and oversight of equipment maintenance, seed packaging, planting, data collection, and plot harvest by faculty research assistant, Louis Thorne. This work could not be accomplished without the assistance of research technician Joseph Crank during the season. Also, we acknowledge the undergraduate students for their assistance with seed packaging. Thank you to the crew at Wye Research and Education Center for sharing your experience, tools, and space in your shop with Louis Thorne as he continues to keep our equipment running. Table 1 outlines the crews at each test location who assisted with land preparation, flagging, plot management, and harvest. I personally would like to acknowledge each farm manager, David Armentrout, John Draper, Ryan McDonald, and Douglas Price for their continued support of the Agronomy Trials Center and their continued patience with me.

Additional Information

The inclusion of varieties in these tests is not an endorsement by the University of Maryland. Advertising statements about a company’s varieties can be made as long as they are accurate statements about the data as published. Statements similar to “See the Maryland Soybean Tests Agronomy Facts No. 32” or “Endorsement or recommendation by the University of Maryland is not implied” must accompany any reproduced information.

Click here to download the full report

New Web-Based Soybean Budget Tool

Alan Leslie, Agriculture Agent | aleslie@umd.edu
University of Maryland Extension, Charles County

With grant funding from the Maryland Soybean Board, we have been working to develop a new web-based app for calculating crop budgets for growing soybeans. The goal for this new tool is to allow farmers more freedom to customize inputs to better reflect their farming practices with a simple user interface. The web app allows you to download a summary of all inputs and expected profits as a PDF document for your records. The new crop budget tool can be found at: https://awleslie.shinyapps.io/budget_4/.

We are interested in gathering feedback and input about this new format and ways to improve it in the future. After testing the new crop budget tool, we would appreciate if you could take a few minutes to provide feedback through our online survey: https://ume.qualtrics.com/jfe/form/SV_07bOf0994wyKzGd. Survey feedback will be used to develop better crop budget tools in the future.


2019 Dicamba Update

Erika Crowl, Agriculture Agent Associate
University of Maryland Extension, Baltimore County

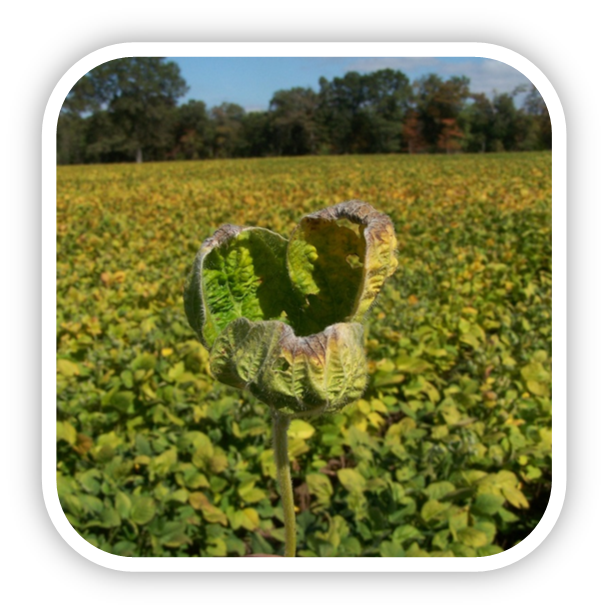
Herbicide-damaged soybeans from dicamba drift
Example of damage when a label rate of 1pt/ac of the herbicide Clarity drifted on to non-tolerant soybeans. Image: Matt Morris, University of Maryland.

In October 2018, the U.S. Environmental Protection Agency (EPA) approved revised labels for Engenia (EPA Reg. No. 7969-345), FeXapan (EPA Reg. No. 352-913), and Xtendimax (EPA Reg. No. 524-617). While the EPA revised labels, they also announced the registration extension on dicamba for two years for “over-the-top” use on dicamba tolerant cotton and soybean plants.

Changes for 2019:

  • Only certified applicators may purchase and apply dicamba; no longer may those working under the supervision of a certified applicator may make applications.
  • For the 2019 growing season and each season thereafter, all applicators must complete the annual dicamba training provided by one of the registrants of a dicamba product approved for in-crop use with dicamba-tolerant crops.
  • Post- emergent dicamba treatments must be applied prior to 45 days after soybean planting, or R1 stage, whichever comes first.
  • Applications will be allowed only from 1 hour after sunrise to 2 hours before sunset.
  • In counties where endangered species may exist, the downwind buffer will remain at 110 feet. There will also be an additional 57-foot buffer required around the sides of the field. For a list of counties requiring additional protection measures check out the EPA endangered species website.

Records must be generated within 72 hours of application instead of 14 days. Must also include planting date on records. Record keeping forms for Engenia, FeXapan, and Xtendimax may be found online on the product website.

Please note this is not a comprehensive list of label changes for each dicamba product. I would encourage all applicators to read in detail all requirements on each specific product label. To find local dicamba trainings, please consult your local extension agent or Maryland residents may take the online training

Proper Stewardship by Growers is Essential to Ensuring Dicamba Tolerant Soybeans Continue to be Available

By Matt Morris, Agriculture Extension Educator
University of Maryland Extension, Frederick County

Dicamba tolerant soybeans, marketed under the trade name Roundup Ready 2 Xtend soybeans, are again available to  Maryland growers for the 2018 growing season. This line of soybeans will combine previous Roundup Ready technology with tolerance to the herbicide dicamba.

While this new dicamba tolerance may be useful in combating certain tough-to-control weeds, including marestail and palmer amaranth, use caution when applying dicamba. Applications of dicamba may cause problems due to the sensitivity of certain crops to the herbicide. Exposure can occur due to drift, volatility, or a non-target application.

Below are some recommendations to consider when using new dicamba-tolerant technologies.

  • Dicamba type:

The only dicamba products that will be approved for in-crop use with Xtend soybeans will be XtendiMax from Monsanto, FeXapan from Dupont, and Engenia from BASF. These are lower volatility formulations than other dicamba products and are designed for dicamba-tolerant soybeans. These products will be classified as restricted-use pesticides for 2018 and all users must take dicamba or synthetic auxin herbicide training prior to purchasing these products.

  • Know the location of sensitive crops:

Talk with your neighbors and know where crops such as tomatoes, grapes, alfalfa, and non-tolerant soybeans are located. Engenia includes woodlands and native vegetation as sensitive crops; any broadleaf cash crop is listed as a sensitive crop in the XtendiMax label. This information will help you decide whether to use dicamba near these crops, especially if a prevailing wind will cause drift in their direction.

In addition, you should maintain buffer zones of 110 feet (220 feet if a 22 oz/ac rate is exceeded), between dicamba application sites and sensitive crops. The two websites below contain a (incomplete) list of some sensitive crops in your area:

http://maryland.maps.arcgis.com/apps/OnePane/basicviewer/index.html?appid=a4e2153518d04317bbac79702aafcd53

www.driftwatch.org

  • Rates:

Engenia – Dicamba tolerant soybeans – maximum of 12.8 fl oz/application and 51.2 oz/season.

FeXapan and XtendiMax – Dicamba tolerant soybeans – maximum of 44 fl oz/pre-plant application, 22 fl oz/post-emergence application, and a maximum of 88 fl oz/season.

  • Nozzle selection:

Engenia – Only TTI11004 and TTI11005 are currently approved.

FeXapan and XtendiMax – Apply large droplets with specific nozzles. Do not use flat fan nozzles that produce driftable fines. Use TTI11004 or nozzles listed on the EPA-mandated product websites.

  • Tank mix partners and water conditioning:

Ammonium sulfate (AMS) CANNOT be mixed with the new dicamba formulations. AMS is commonly used as a water conditioning agent for glyphosate applications. Adding AMS will increase the volatility of dicamba. Also, certain spray adjuvants and herbicide tank mix partners are not compatible with the new dicamba formulations.

Lists of approved tank mix partners can be found at:

http://www.xtendimaxapplicationrequirements.com/Pages/default.aspx

http://agproducts.basf.us/campaigns/engenia/tankmixselector/

http://www.dupont.com/products-and-services/crop-protection/soybean-protection/articles/fexapan-tank-mix-partner.html

  • Recordkeeping:

For the 2018 season, recordkeeping will be mandatory when applying dicamba in-crop on soybeans. Specific recordkeeping requirements will vary between the three approved, in-crop dicamba products, so always consult the label. However, it is recommended you always record wind speed and direction, air temperature, humidity, location of the application, product(s) used, rate, crop being treated, pests being targeted, and total product amounts used, among other information. Proper recordkeeping can provide essential evidence in the event of herbicide damage to a non-target crop.

  • Wind speed, temperature, and temperature inversions:

The optimal wind speed for applying the new dicamba products is 3-5 mph. Applications are prohibited when wind speeds are above 10 mph.

As the temperature increases, so does the volatility of dicamba. Use caution when applying dicamba products in hot, humid weather.

Take caution when wind speeds are below 3 mph, since this could indicate the presence of a temperature inversion. This phenomenon occurs when the temperature, which normally decreases with height in a thin layer of the atmosphere, increases with height. Inversions are another cause of vapor drift. Other indicators of a temperature inversion include low-hanging smoke or dust, morning fog or frost, clear and still nights with little to no cloud cover, and ground temperatures cooler than early morning air temperatures.

  • Multiple applications and weed height:

Multiple herbicide applications with the same mode of action within a single season selects for herbicide resistance. Avoid using dicamba on tolerant soybeans more than once in a season. If possible, a pre-emergence herbicide should be applied before or at planting. It is also important to remember that weeds should be targeted at 4” of height or less for successful control.

  • Application suggestions:

Keep ground speeds below 15 mph and nozzle pressures as low as possible to maintain the desired application rate. Boom height should be no more than 24” above the crop or weed canopy. If a weed is 4” tall, boom height should not exceed 28.”

  • Most importantly:

ALWAYS READ AND FOLLOW PESTICIDE PRODUCT LABELING. It is a violation of Federal and state law to use any pesticide product in a manner inconsistent with its labeling.

Approval of dicamba-tolerant soybeans by the U.S. Environmental Protection Agency will run until the end of 2018. At that point, they will consider whether to renew approval based on the number of problems that occur as a result of this new technology.

If you have questions regarding the use of dicamba tolerant soybean technology or dicamba, please contact Matt Morris @ 301-600-3578 / mjmorris@umd.edu or your local Extension office for more information.

Dicamba Changes for 2018:

  1. Classified as a restricted use pesticide that only certified pesticide applicators can purchase.
  2. Anyone applying these products MUST receive dicamba or auxin-specific training.
  3. Applications can ONLY be made between sunrise and sunset.
  4. Recordkeeping is mandatory. Refer to the individual labels for exact recordkeeping requirements.
  5. All applications cannot be done when wind speeds exceed 10 mph (down from 15 mph).
  6. Record of compliance with spray system cleanout is mandatory.
  7. Labels have enhanced language about susceptible crops. This includes non-dicamba-tolerant soybeans.
Herbicide-damaged soybeans from dicamba drift
Figure 1. Example of damage when a label rate of 1pt/ac of the herbicide Clarity drifted on to non-tolerant soybeans.

Making Timely Herbicide Applications to RR Soybeans in Fields with Palmer Amaranth

Ben Beale, Extension Educator, St. Mary’s County

Palmer amaranth infested soybean field in Southern Maryland.

The recent rains and numerous days of continuous wind has made it difficult to get herbicide applications made when needed.  Ideally, we really like to wait until planting to spray, or have good confidence that the herbicide application will occur right after spraying. Sometimes it doesn’t work out, and what we like and what we get are two different things.  With most weeds you will be ok, but Palmer and other resistant weeds can be another story. In our trials, residuals from pre-emergent herbicides provided 2-5 weeks of control for Palmer. That allows you to get in with an early post emergence product such as Reflex plus Glyphosate or Flexstar around 21 days after planting. This will help to keep the field clean until the beans canopy. If you take away a couple of those weeks, you can be in real trouble with weeds coming in before canopy closure. Continue reading Making Timely Herbicide Applications to RR Soybeans in Fields with Palmer Amaranth

Things to Consider When Using Dicamba Tolerant Soybeans

Matt Morris, Extension Educator, Frederick County (mjmorris@umd.edu)

Dicamba tolerant soybeans, marketed under the trade name Roundup Ready Xtend will be available to Maryland growers for the 2017 growing season. This line of soybeans will combine previous Roundup Ready technology with a tolerance to the herbicide dicamba. While this new dicamba tolerance may be useful in combatting certain tough-to-control weeds including marestail and palmer amaranth, caution needs to be taken when making applications of dicamba. Problems with dicamba applications may arise due to the sensitivity of certain crops to dicamba. Exposure can occur due to drift, volatility, or a non-target application. Below are some recommendations to consider when utilizing new dicamba tolerant technologies.

Know the location of sensitive crops:

Talk with your neighbors and know where crops such as tomatoes, grapes, alfalfa, and non-tolerant soybeans are located. This will aide in the decision to use dicamba near these crops, especially if a prevailing wind is headed their direction. In addition, buffer zones of 110’ (220’ if  a 22oz/ac rate is exceeded), will need to be maintained between dicamba application sites and sensitive crops. These two websites listed below contain a (incomplete) list of some sensitive crops in your area:(Link Here)

Dicamba type:

The only dicamba products that will be approved for in-crop use with Xtend soybeans will be XtendiMax from Monsanto, FeXapan from Dupont, and Engenia from BASF. These are lower volatility formulations than other dicamba products and are designed for the dicamba tolerant soybeans.

Rates:

Engenia – Dicamba tolerant soybeans – max of 12.8 fl oz/application and 51.2 oz/season.

FeXapan and XtendiMax – Dicamba tolerant soybeans – max of 44 fl oz/preplant application, 22 fl oz/postemergence application, and a max of 88 fl oz/season.

 Nozzle selection:

Engenia – Only TTI11004 and TTI11005 are currently approved.

FeXapan and XtendiMax – Apply large droplets with specific nozzles.  Do not use flat fan nozzles that product driftable fines.  Use TTI11004 or nozzles listed on the EPA-mandated product websites.

Spray adjuvants and water conditioning:

Ammonium sulfate (AMS) CANNOT be mixed with these new dicamba formulations. AMS is commonly used as a water conditioning agent for glyphosate applications. Adding AMS will increase volatility of the dicamba. Also, certain spray adjuvants and herbicide tank mix partners are not compatible with the new dicamba formulations. Always consult the label before mixing.

Recordkeeping:

Always keep records of where you’ve planted dicamba tolerant soybeans. This can help avoid costly misapplications to a crop that is not tolerant to dicamba. It will be extremely important to convey this information to custom application companies or employees on your farm.

Wind Speed, temperature, and temperature inversions:

When applying these new dicamba products the optimal wind speed is 3-5mph. Applications are prohibited when wind speeds are above 15mph; however, great caution and even stopping spraying when wind speeds are above 10mph would be ideal.

As temperature increases so does the volatility of dicamba. Caution should be used when applications are made in hot, humid weather.

Caution should also be taken when wind speeds are below 3mph as this could indicate the presence of a temperature inversion. Inversions are another cause of vapor drift. Other indicators of a temperature inversion include low hanging smoke or dust, morning fog or frost, clear and still nights with little to no cloud cover, and ground temperatures cooler than early morning air temperatures.

Multiple applications and weed height:

Multiple herbicide applications with the same mode of action within a single season selects for herbicide resistance. Avoid using dicamba on tolerant soybeans more than once in a season. If possible, a pre-emergence herbicide should be applied before or at planting. It is also important to remember that weeds should be targeted at 4” of height or less for successful control.

 Application Suggestions:

Keep ground speeds below 15 mph and nozzle pressures as low as possible to maintain the desired application rate. Boom height should be no more than 24” above the crop or weed canopy. If a weed is 4” tall, boom height should not exceed 28”.

Most importantly:

ALWAYS READ AND FOLLOW PESTICIDE PRODUCT LABELING. It is a violation of Federal and state law to use any pesticide product in a manner inconsistent with its labeling.

The U.S. EPA will allow its approval of dicamba tolerant soybeans to run until the end of 2018. At that point they will consider whether or not to renew approval based on the amount of problems that arise as a result of this new technology. In order to have this technology in the future, proper stewardship by the grower is essential. If you have questions regarding the use of dicamba tolerant soybean technology or dicamba itself please contact Matt Morris @ 301-600-3578 / mjmorris@umd.edu or contact your local Extension office for more information.

 References and other Resources:

-University of Illinois Extension. The Bulletin. Dicamba and Soybean: What to Expect in 2017. http://bulletin.ipm.illinois.edu/?p=3765

-Purdue University Extension ID-453-W. 2,4-D- and Dicamba Tolerant Crops- Some Facts to Consider. https://www.extension.purdue.edu/extmedia/id/id-453-w.pdf

-Reviewed by Ron Ritter, Professor Emeritus, University of Maryland