2021 Maryland Crop Production Meetings Announced

Virtual meets to offer CEUs for pesticide and Nutrient Management

University of Maryland Extension has announced dates for this year’s crop production meetings December through February. The meetings will be conducted online. The most recent research, information and data will be shared at these meetings and will help make 2021 growing decisions for agricultural crops.

The meetings are free and open to all interested in agronomy, forage, vegetables and fruit. Pesticide applicator, nutrient management and certified crop advisor credits will be offered. Registration is required please visit:  https://go.umd.edu/WinterAgMeetings. Meeting details and agendas will also be posted to this site. If you need special accommodations please call two weeks prior to the event.

If you are unable to attend or have limited access to a computer or internet, there will be additional opportunities throughout the winter for small in-person meetings and an online self-paced recertification option. Contact your local Ag Extension agent for details regarding these additional opportunities.

Fruit Growers

December 10, 2020 | 8am-Noon

February 10, 2021 | 8am-Noon

Vegetable Growers

December 2, 2020 | 8am-Noon

January 28, 2021 | 8am-Noon

Agronomy

December 1, 2020 | 4pm-8:30pm

December 3, 2020 | 8am-Noon

January 21, 2021 | 8am-Noon

February 17, 2021 | 4pm-8:30pm

February 26, 2021 | 8am-Noon

Forage

January 14, 2021 | 9am-Noon

January 19, 2021 | 9am-Noon

Connect with your local Extension educator to receive newsletters and notifications of events.

https://extension.umd.edu/agriculture

https://extension.umd.edu/locations

Maryland Crop Update: November 2020

Western Maryland

Much needed moisture graced the valley this past week but is being followed by strong winds which are giving some pause as we race to get the remaining corn and beans harvested. The cover crops and cereals that have been planted are off to a good start as well. It is just about time to blow off the equipment, grease it and rinse the sprayer for the final time before buttoning things up for the winter. The manure spreaders and tankers will continue to get out the last of the stores before the December cut off as nobody wants to go into winter with any extra manure hanging around. After a good winter’s nap we look forward to spring. Happy Thanksgiving and Merry Christmas to all!—Jeff Semler, Washington Co.

Central Maryland

After a rainy, cloudy, and windy transition from October to November, the sun is making more of an appearance, and slightly warmer weather is predicted moving into next week. Most corn and soybean fields have been harvested, with a few still standing. Cover crop planting is well underway. Even though we’ve had some colder weather, it’s been warm enough for those winter annual weeds (i.e. chickweed, henbit, and deadnettle) to grow well, so be sure to scout your fields if going into small grains.—Kelly Nichols, Montgomery Co.

Northern Maryland

In the last two weeks we have had some rains, heavy dews, and fog that has slowed an otherwise early harvest. Soybean harvest is just now starting to pick back up since last report. Full season soybean yields continue to be very impressive. Corn harvest is about 70% complete; moisture has been stubbornly high. Overall, yields are down from 2019, but the later planted corn and later maturing varieties are yielding strong. Cover crops have emerged very well with the moisture we had in October. 2021 wheat and barley planting for grain is approximately half finished.—Andy Kness, Harford Co.

Upper & Mid Shore

Wet, wetter, wettest, etc. It has been the wettest and most humid October that I can remember. Harvest has been difficult and stressful. Corn harvest is almost complete, but soybean harvest has been in the starting stage for 3 weeks. Hopefully by the time this is published, combines are rolling thru bean fields. Early yield reports are phenomenal and hopefully continues. Early planted cover crops looks great, with the exception of being nitrogen deficient. This year, it didn’t seem to matter how it was planted, it emerged and started growing in record time. There is very little commodity barley and wheat planted, but that should change this week. There are going to be many cut up/compacted fields this year.—Jim Lewis, Caroline Co.

Lower Shore

Corn is 90% harvested with slightly below average yields. Soybean harvest was delayed due to a rainy couple of weeks and very saturated soils. This week’s conditions have dried out to the point where growers are beginning to resume soybean harvest. We have had frosts in some areas. Cover crop seeding was also delayed in many fields due to very saturated conditions.—Sarah Hirsh, Somerset Co.

Southern Shore

Season Wrap-Up—“I’ve said it once and now I’ll say it again—I need a taller pair of boots”. Those are my exact words from the fall 2018 season wrap-up. It seems I may need to upgrade to hip waders after 2020. The region received record rainfall over the last several months and it just won’t quit. Producers are still struggling to get corn off, with moisture remaining high, stalk rots causing significant lodging, and pictures of combines stuck up to their axles an all too common site. Soybean harvest is finally underway, though fields remain wet and hard to navigate. Small grain planting is behind schedule as well. This week should allow farmers to catch up on some acres with drier conditions in the short-term forecast.

In general, this season has resulted in good to very good yields for corn with prospects for very good soybeans yield as well. The season started with a series of late frost holding back planting. Those same frosts caused significant damage to an otherwise healthy wheat crop. Crops grew well through June, but faced a few weeks of hot and dry conditions in late June and early July, followed by scattered showers in late July. That all changed in August when remnants of hurricane Isaias dropped double-digit rainfall totals in many areas. Rains have continued through November. Corn and beans have been slow to dry down and as mentioned before the harvest has been a challenge. On the brighter side- duck season comes in soon. Maybe those hip-waders will come in handy if the water does not recede shortly.—Ben Beale, St. Mary’s Co.


2020 Soybean Fungicide Trials

Alyssa Koehler, Extension Field Crops Pathologist
University of Delaware

Carvel Research and Education Center Georgetown, DE

2020 Soybean Foliar Fungicide Trial


Variety: CZ 3930GTLL treated with Poncho/VoTiVo + Ilevo | Planting Date: 5/11/20

Plant Population: 150,000 sd/a | Harvest Date: 10/22/20

Treatmentz % Green Stems at Harvesty Test Weight Moisture Yieldx Avg. Purple Seed Stainw Avg. Diaporthe/Phomopsis Seed Decayv
Control 6.2 a 55.0 a 15.8 a 67.2 ab 2.4 ab 1.2 a
Revytek (R3)

8 oz/a

8.3 a 55.4 a 15.6 a 69.7 ab 1.6 ab 0.4 a
Priaxor  (R3)

4 oz/a

4.9 a 55.5 a 15.6 a 65.4 b 0.8 ab 0.6 a
Veltyma (R3)

7 oz/a

10.0 a 55.2 a 15.6 a 75.7 ab 1.8 ab 1.0 a
USF0411 (R3)

8 oz/a

6.2 a 55.3 a 15.5 a 68.8 ab 1.6 ab 0.6 a
Delaro (R3)

8 oz/a

8.5 a 55.2 a 15.5 a 78.7 a 1.0 ab 0.8 a
Topguard EQ (R3)

5 oz/a

6.2 a 55.1 a 15.8 a 68.2 ab 1.8 ab 0.6 a
Lucento (R3)

5 oz/a

7.1 a 54.9 a 15.6 a 71.5 ab 1.8 ab 1.2 a
Miravis Neo (R3)

13.7 oz/a

4.4 a 55.5 a 15.2 a 71.2 ab 0.6 b 1.0 a
Miravis Top (R3)

13.7 oz/a

5.8 a 55.5 a 15.2 a 71.0 ab 1.0 ab 0.6 a
Quadris Top SBX (R3) 8 oz/a 8.7 a 55.5 a 15.3 a 74.9 ab 0.6 b 0.6 a
Miravis Neo (R5)

13.7 oz/a

6.9 a 55.1 a 15.4 a 71.9 ab 3.0 a 1.0 a
Miravis Top (R5)

13.7 oz/a

7.0 a 55.0 a 15.4 a 70.7 ab 0.8 ab 0.4 a
Miravis Neo (R3) fb Trivapro (R5)

13.7 + 13.7 oz/a

7.4 a 55.3 a 15.6 a 66.3 ab 0.8 ab 0.4 a
p-value 0.184 0.141 0.30 0.04 0.017 0.844
LSD (α=0.05) 3.654 0.452 0.491 7.52 1.35 1.05

zR3 treatments applied 7/30/20, R5 8/12/20 using a Co2 pressurized backpack sprayer equipped with extended range 8002VS flat fan nozzles calibrated to deliver 20 GPA at 40 psi. Plots were set up in a randomized complete block design with five replications. All treatments included 0.125% non-ionic surfactant, Induce.

y Percent of green stems out of total stems in rows 2 and 3 of each plot the day of harvest. Means followed by the same letter are not significantly different based on Fisher’s Least Significant Difference (LSD; α=0.05).

x Yield was calculated from the center two rows of each plot and adjusted to 13% moisture.

w Avg. number of seeds in 10g subsample from each plot with purple discoloration.

v Avg. number of seeds in 10g subsample from each plot with white/chalky appearance.

2020 Corn Fungicide Trials

Alyssa Koehler, Extension Field Crops Pathologist
University of Delaware

Carvel Research and Education Center Georgetown, DE

2020 Irrigated Corn Fungicide Trial – Rotated Field


Variety: Hubner H6187RCSS | Planting Date: 5/14/20 | Harvest Date: 9/15/20 | Planting Population: 32,000 sd/A   


Treatmentz

% GLS Incidence 14 daay % GLS Severity 14daax % GLS Severity 28 daa % GLS Severity 42 daa Canopeo green canopy cover

49 daa

Moisture Test Weight Yieldw
Veltyma (R1)

7 oz/a

24.0 ab 0.24 ab 0.48 ab 1.10 abc 47.2 ab 22.8 a 52.5 abc 227.2 a
Headline AMP (R1)

10 oz/a

22.0 ab 0.22 ab 0.52 bc 1.48 d 43.4 bc 22.8 a 52.7 bc 232.3 a
Priaxor  (R1)

4 oz/a

24.0 ab 0.24 ab 0.50 ab 1.36 bcd 43.7 abc 22.9 a 52.6 bc 227.8 a
USF0411 (R1)

8 oz/a

30.0 b 0.30 b 0.54 b 0.88 a 49.8 a 23.3 a 52.5 abc 228.6 a
Topguard EQ(R1)

5 oz/a

22.0 ab 0.24 ab 0.52 ab 1.30 bcd 46.0 ab 23.0 a 52.6 bc 229.4 a
Lucento (R1)

5 oz/a

22.0 ab 0.22 ab 0.48 ab 1.04 ab 48.0 ab 23.0 a 52.3 ab 231.8 a
Trivapro (V8) fb Miravis Neo (R1)

13.7 +13.7  oz/a

16.0 a 0.18 ab 0.50 ab 1.36 bcd 48.3 ab 23.6 a 52.2 ab 230.1 a
Trivapro (R1)

13.7 oz/a

24.0 ab 0.24 ab 0.52 ab 1.34 bcd 43.7 abc 23.1 a 52.5 abc 230.0 a
Trivapro (V8) (3 reps) 13.7 oz/a 30.0 b 0.30 b 0.50 ab 1.23 a-d 38.8 c 22.8 a 52.8 c 220.2 a
Miravis Neo (V8)

13.7 oz/a

20.0 ab 0.20 ab 0.52 ab 1.42 cd 39.3 c 22.8 a 52.8 c 224.8 a
Miravis Neo (R1)

13.7 oz/a

14.0 a 0.14 a 0.46 a 1.30 bcd 46.2 ab 23.3 a 52. 1 a 228.4 a
Control 86.0 c 0.88 c 0.70 c 2.50 e 39.5 c 22.7 a 52.9 c 218.1 a
p-value 0.0001 0.0001 0.0001 0.0001 0.007 0.108 0.05 0.315
LSD (α=0.05) 12.16 0.13 0.07 0.36 6.05 0.57 0.47 10.75

z V8 applied 6/24/20, R1 applied 7/14/20 using a Co2 pressurized backpack sprayer equipped with TP8002-VS flat fan nozzle nozzles calibrated to deliver 20 GPA at 40 psi with plots set up in RCBD with five replications. All treatments included 0.125% non-ionic surfactant, Induce.

 y Disease incidence was rated as percentage of 10 ear leaves with grey leaf spot lesions caused by Cercospora zeae-maydis. Means followed by the same letter are not significantly different based on Fisher’s Least Significant Difference (LSD; α=0.05).

x Grey leaf spot severity was visually assessed as the average % ear leaf covered in lesions per plot; means of 10 leaves per plot were used for analysis.

 w Yield was calculated from the center two rows of each plot and adjusted to 15.5% moisture.


Warrington Irrigation Farm: 2020

Irrigated Corn Fungicide Trial – Corn on Corn


Variety: Axis 64K24 | Planting Date: 5/11/20 | Harvest Date: 10/6/20 | Planting Population: 34,000 sd/A

Treatmentz Avg % GLS Incidence 14 daay Avg % GLS Severity 14daax Avg % GLS Severity

28 daa

Avg % GLS Severity

42 daa

Avg % Curvularia Severity

42 daaw

Canopeo green canopy cover

42 daa

% Lodging

72 daa

Test Weight Moisture Yieldv
Veltyma (R1)

7 oz/a

8.0 a 0.08 a 0.88 a 2.28 c 8.87 abcd 42.4 cd 6.0 ab 57.0 ab 20.26 abcd 218.8 a
Headline AMP (R1)

10 oz/a

18.0 abc 0.18 abc 1.00 a 2.02 abc 9.22 bcd 44.0 bcd 6.0 ab 57.0 ab 19.90 bcd 228.4 a
Priaxor  (R1)

4 oz/a

14.0 ab 0.14 ab 0.98 a 2.18 bc 9.14 bcd 40.9 d 8.0 ab 57.2 ab 19.80 de 220.9 a
Revytek (R1)

8 oz/a

16.0 abc 0.16 ab 0.84 a 1.56 abc 7.72 a 47.7 abcd 2.0 ab 56.2 c 20.38 ab 228.7 a
USF0411 (R1)

8 oz/a

16.0 abc 0.16 ab 0.86 a 1.20 a 7.60 a 51.8 a 0.0 a 56.7 bc 20.42 a 225.8 a
Delaro (R1)

8 oz/a

14.0 ab 0.14 ab 0.96 a 1.76 abc 9.50 bcd 41.4 d 2.0 ab 57.1 ab 19.86 cde 221.5 a
Topguard EQ (R1)

5 oz/a

12.0 ab 0.12 ab 1.02 a 1.82 abc 8.40 ab 46.8 abcd 10.0 b 57.0 ab 20.16 abcd 233.9 a
Lucento (R1)

5 oz/a

20.0 bc 0.20 bc 0.78 a 1.60 abc 7.76 a 49.2 ab 0.0 a 56.6 bc 20.26 abcd 227.0 a
Trivapro (R1)

13.7 oz/a

26.0 c 0.28 c 0.84 a 1.90 abc 9.08 bcd 46.3 abcd 2.0 ab 57.0 ab 20.12 abcd 226.7 a
Miravis Neo (R1)

13.7 oz/a

12.0 ab 0.12 ab 0.70 a 1.42 ab 8.58 abc 48.7 abc 4.0 ab 56.8 bc 20.32 abc 226.3 a
Quilt Xcel (R1)

10.5 oz/a

20.0 bc 0.20 bc 1.08 a 2.00 abc 9.74 cd 46.3 abcd 8.0 ab 56.8 bc 20.22 abcd 219.7 a
Control 98 d 1.18 d 2.7 b 11.18 d 9.90 d 32.5 e 26.0 c 57.5 a 19.38 e 205.2 a
p-value 0.0001 0.0001 0.0001 0.0001 0.004 0.0001 0.0003 0.05 0.005 0.33
LSD (α=0.05) 10.45 0.12 0.50 0.84 1.29 6.8 9.77 0.65 0.50 19.0

zAll treatments applied 7/14/20 using a Co2 pressurized backpack sprayer equipped with TP8002-VS flat fan nozzles calibrated to deliver 20 GPA at 40 psi with plots set up in RCBD with five replications. All treatments included 0.125% non-ionic surfactant, Induce.

y GLS incidence was rated as percentage of 10 ear leaves with grey leaf spot lesions caused by Cercospora zeae-maydis. Means followed by the same letter are not significantly different based on Fisher’s Least Significant Difference (LSD; α=0.05).

x GLS severity was visually assessed as the avg % ear leaf covered in GLS lesions per plot; means of 10 leaves per plot were used for analysis.

w Curvularia severity was visually assessed as avg % ear leaf covered in Curvularia lesions per plot; means of 10 leaves per plot were used for analysis.

v Yield was calculated from the center two rows of each plot and adjusted to 15.5% moisture.


EPA Announces Dicamba Registration Decision

EPA press release, abridged

At the Cromley Farm, U.S. Environmental Protection Agency (EPA) Administrator Andrew Wheeler announced that EPA is approving new five-year registrations for two dicamba products and extending the registration of an additional dicamba product. All three registrations include new control measures to ensure these products can be used effectively while protecting the environment, including non-target plants, animals, and other crops not tolerant to dicamba.

“With today’s decision, farmers now have the certainty they need to make plans for their 2021 growing season,” said EPA Administrator Andrew Wheeler. “After reviewing substantial amounts of new information, conducting scientific assessments based on the best available science, and carefully considering input from stakeholders we have reached a resolution that is good for our farmers and our environment.”

Through today’s action, EPA approved new registrations for two “over-the-top” (OTT) dicamba products—XtendiMax with VaporGrip Technology and Engenia Herbicide—and extended the registration for an additional OTT dicamba product, Tavium Plus VaporGrip Technology. These registrations are only for use on dicamba-tolerant (DT) cotton and soybeans and will expire in 2025, providing certainty to American agriculture for the upcoming growing season and beyond.

To manage off-site movement of dicamba, EPA’s 2020 registration features important control measures, including:

  • Requiring an approved pH-buffering agent (also called a Volatility Reduction Agent or VRA) be tank mixed with OTT dicamba products prior to all applications to control volatility.
  • Requiring a downwind buffer of 240 feet and 310 feet in areas where listed species are located.
  • Prohibiting OTT application of dicamba on soybeans after June 30 and cotton after July 30.
  • Simplifying the label and use directions so that growers can more easily determine when and how to properly apply dicamba.

The 2020 registration labels also provide new flexibilities for growers and states. For example, there are opportunities for growers to reduce the downwind spray buffer for soybeans through use of certain approved hooded sprayers as an alternative control method. EPA also recognizes and supports the important authority FIFRA section 24 gives the states for issuing locally appropriate regulations for pesticide use. If a state wishes to expand the federal OTT uses of dicamba to better meet special local needs, the agency will work with them to support their goals.

This action was informed by input from state regulators, grower groups, academic researchers, pesticide manufacturers, and others. EPA reviewed substantial amounts of new information and conducted assessments based on the best available science, including making Effect Determinations under the Endangered Species Act (ESA). With this information and input, EPA has concluded that these registration actions meet Federal Insecticide, Fungicide and Rodenticide Act (FIFRA) registration standards. EPA believes that these new analyses address the concerns expressed in regard to EPA’s 2018 dicamba registrations in the June 2020 U.S. Court of Appeals for the Ninth Circuit. Further, EPA concluded that with the control measures now required on labels, these actions either do not affect or are not likely to adversely affect endangered or threatened species.

To view the final registration of the dicamba products, visit docket EPA-HQ-OPP-2020 0492 at www.regulations.gov.


Plant parasitic nematode genera in Maryland and Delaware Soybean fields and strategies for their management

Ramesh Pokharel1, Alyssa Koehler2, Sarah Hirsh3, Jim Lewis3, & Nidhi Rawat4
1USDA APHIS, Riverdale, MD
2Department of Plant and Soil Sciences, University of Delaware
3University of Maryland Extension
4Department of Plant Science and Landscape Architecture, University of Maryland, College Park

Small-scale soil surveys were conducted in the major soybean growing counties of Maryland and Delaware in summer 2019 with funding support from Maryland Soybean Board. The following eight genera of parasitic nematodes were observed in varying densities: root-knot (Meloidogyne), Cysts (Heterodera), root lesion (Pratylenchus), dagger (Xiphinema), stunt (Tylenchorhynchus), stubby root (Trichodorus), spiral (Helicotylenchus), lance (Hoplolaimus), and needle nematode (Longidorus). Out of these eight, soybean cyst, root-knot, and root lesion nematodes are the most economically significant to soybean production. It is important to note that nematode management in fields requires long-term application of management tactics, and should be adopted is the densities of problematic nematodes exceeds their Economic threshold levels. Economic Threshold Level (ETL) is defined as the density of nematodes at which the damage caused by a particular nematode exceeds the cost of managing it. Biology of major parasitic nematodes of soybean found in the mini-survey, as well as the management approaches recommended for them are described in this article.

Soybean Cyst Nematode (SCN)

Soybean cyst nematode (SCN) was first detected in Worcester County in Maryland in 1980 (Sardanelli et al., 1982) and subsequently spread to most eastern shore counties of MD and to DE.  In the present survey 41 and 57, samples from Maryland and Delaware, respectively were found positive for SCN, where 50 and 41 % of fields had SNC densities higher than ETL (60 individuals per 500 cc soil). This survey indicated that SCN remains an important problem in the eastern shore counties of MD and in DE.

Biology: Juvenile larvae (J2), the most infective stage, emerge from eggs and enter plant roots establishing feeding sites. Males become vermiform (worm-shaped) and exit the roots, whereas lemon-shaped young females slightly less than 1 mm in diameter, whitish-yellow in color appear on the roots. The adult females break through the root surface but remain attached to the root. Mating takes place on the root surface and females lay 50-100 eggs in an egg mass on the back of their body. The female then fills will more than 200 eggs and dies. The body walls harden to form a tough cyst around the eggs, which can remain viable in the soil for long periods, even in adverse conditions. The vermiform (worm-shaped) juvenile and adult males as well as the brown cysts (dead female body containing eggs), and freed eggs can be extracted from the soil. Often, cysts may get confused with nitrogen fixing bacteria Bradyrhizobium root nodules, which are pinkish in color and smaller than cysts and can easily be squeezed in between fingers producing pinkish fluid. Under favorable environmental conditions, SCN can complete a life cycle in four weeks, making it possible to have multiple life cycles over the course of a season.

Symptoms: SCN infected fields often lack obvious above ground symptoms, making SCN infestation difficult to predict unless soil samples are taken for nematode assessment. If symptoms are present, they may be confused with other diseases or abiotic stress. High SCN populations may cause yellowing or stunting of above ground plant parts and/or root distortion, dwarfing, stunting, reduction in nitrogen-fixing nodules, and increased susceptibility to other soil-borne plant pathogens.

Management strategies: SCN is often called the silent yield robber because it can be difficult to know that  populations are building. Since SCN can survive in the soil for many years even in adverse conditions, it will take consistent long-term efforts to reduce SCN problem in a field. Currently, ‘PI 88788’, ‘Peking’, and ‘PI 437654’ ‘Hartwig’ are the available sources of resistance. ‘PI 88788’ has been the primary source of resistance for decades and is found in over 95% of soybeans currently available. Long-term exposure to this resistance gene has selected for SCN populations that are able to reproduce at higher rates and overcome the ‘PI 88788’ source of resistance. Rotating resistance from ‘PI88788’ to ‘Peking’ has been reported to minimize losses, while plots with the continuous use of ‘PI 88788’ or ‘Peking’ had 5% and 8% lower yields, respectively. Race determination is important to decide the efficacy of resistant sources or cultivars. Soybean maturity group also affects SCN reproduction.

Late maturing groups remain in the field until late October or November, allowing an extra generation of SCN to develop. Selecting soybeans with an earlier maturity group can help reduce SCN population numbers the following year. Soybeans rotated with non-host crops such as corn, small grains, and alfalfa help to reduce the nematode build up in a field. All types of beans, lespedeza and hairy vetch, some ornamental plants and weeds such as henbit, purple deadnettle and common mullein can help maintain SCN populations and should be avoided. One year in a weed-free non-host crop can reduce SCN population up to 55%.

Since some of the eggs may remain unhatched in the cyst for years, it is impossible to completely destroy SCN populations by starvation. Seed treatments generally help to protect young roots from nematode infection, thereby reducing crop yield losses, but this will not reduce the SCN population in a field. Aveo and ILEVO are some of the products that are known to reduce nematode damage to the crop.

Root-knot nematode (RKN)

Root-knot nematode (RKN) may cause significant (more than 70%) yield loss, when a susceptible variety is planted in field with a high population density of root-knot nematodes. In less fertile soil, soybean and corn can be severely damaged, especially when they are mono-cultured for several years. Damage to these crops is more serious and wide-spread in years when soils where temperatures are unusually warm during the early part of the growing season. Several species of Meloidogyne are reported to infect soybean; M. incognita (southern root knot), M. enterlobii (guava root knot), M. javanica (Javanese root knot), M. hapla (northern root knot), and M. arenaria (peanut root knot). Of which, Meloidogyne incognita, is the most common root-knot nematode species found in Maryland and Delaware (Everts et al., 2006). In the present mini-survey of Maryland and Delaware, 58% and 17% of samples, respectively had RKN. Three percent of the fields tested in Maryland had RKN densities higher than ETL of 170 nematodes per 500 cc soil.

Biology: The life cycle of root knot nematodes (eggs, larvae and adults) is completed within 14-25 days depending upon several factors, especially soil temperature. Under favorable conditions, juveniles hatch immediately from eggs, otherwise eggs remain dormant and can survive in soil for several years until favorable conditions for hatching are available.

Symptoms: Plants infected with RKN exhibit symptoms varying from asymptomatic to non-uniform stunting, wilting, and chlorotic patches, mostly caused by high populations in the soil. When dug up, plants infected by RKN will exhibit root galling symptoms. Root galls caused by RKN may get confused with root nodules produced by nitrogen fixing bacteria, Bradyrhizobium. Root nodules are generally round and can easily be squeezed producing pink to reddish milky substances whereas nematode induced root galls vary in shape and size,are hard to squeeze, and do not produce milky substance when crushing.

Management strategies: Knowing where RKN is distributed in a field is an important first step to management. Nematodes can easily be carried field to field by equipment and vehicles, so sanitizing equipment between affected fields can minimize the change of moving RKN to new fields. Like many nematode genera, RKN is often worse in sandy-to-sandy loam soils.  Due to a wide host range, crop rotation is not always an effective management strategy for root-knot nematode. Rotation with poor host crops can help to decrease populations. Broccoli, cauliflower, grain sorghum or millet (for bird feed) can lower root-knot numbers, particularly if they are grown for two consecutive years. Rye, grown as a winter cover crop, may also help lower nematode populations. Delaying soybean planting until mid-June, as done in double-crop wheat/soybean systems will reduce the number of nematode reproductive generations.

With the phase out of many chemical nematicides, chemical control is not cost-effective for RKN currently. The most cost-effective management strategy is to select a RKN resistant variety.

Root Lesion Nematode (RLN)

Root-lesion nematode (RLN) is one of the most common nematodes in Maryland and Delaware in soybean crops. Jenkins et al. (1956) reported higher numbers of this genus in soybean samples than other crops. Later, Pratylenchus spp. were found in 78% of 362 samples in eight counties across MD and DE with P. penetrans being the most common species (Sindermann et al., 1993). In the present mini-survey, genus Pratylenchus was observed in 58% and 60% of the field samples in MD and DE, respectively. Densities higher than the ETL (>500 nematodes per 500 cc) soil were found in 5% of the fields.

Biology: Sexual reproduction is common in P. penetrans, but not in all species. Males are rare or absent in many species such as P. hexincisus, P. neglectus, and P. scribneri. The females lay eggs (after/ without mating) singly or in small groups in the host root or in the soil near the root surface. The first larval stage and molt occur within the egg. The second-stage larva emerges from the egg and undergoes three more molts before becoming an adult. The egg hatches within 1 to 3 weeks, depending on the soil temperature.

Symptoms: RLN produces characteristic necrotic lesions (darkened areas of dead tissue) on infected roots, which turn reddish-brown to black later. Nematode migration and feeding within the roots cause coalescence  of several small spots  into large necrotic areas that may eventually girdle the root. High nematode populations can cause stunting and necrosis of the root system. The extent of lesion formation can be accelerated by root infection by other soilborne plant pathogens, which may produce synergistic disease complexes.

Management strategies: Due to the wide host range, crop rotation is generally not effective for the management of RLN especially in high density populations. RLN can cause extensive yield loss in more than 160 host plants that includes both grasses and broadleaf plants including crops and weeds. Grain crops such as corn, wheat, and alfalfa are favorite hosts. If the nematode population is low, cover crops such as ryegrass or canola used as green manures may be useful to decrease population build up if successively incorporated into rotational cropping sequences (Everts et al., 2006). Limited information is available on soybean cultivars with  RLN resistance.

Dagger nematode (Xiphinema)

Dagger nematode is not an important problem in soybean in Maryland and Delaware at present because of lower densities and incidence as compared to other nematodes. The damage due to dagger The ETL of dagger nematode is population densities above 250 per 100 cc soil. Dagger nematode has a very wide host range and many grass species appear to be good hosts of dagger nematode. Species of Xiphinema are sensitive to changes in soil temperature and moisture and will migrate away from desiccating conditions in topsoil; most dagger nematodes can live and survive deep in the soil. Dagger nematodes feed on the outside of roots and root cells eventually collapse due to feeding. These nematodes are important in crop production because they vector some important plant viruses. Soybean severe stunt virus (SSSV) transmitted by this nematode has been reported in some fields in MD and DE.

Lance nematodes (Hoplolaimus spp.)

Lance nematodes feed on plant roots as ectoparasites (body remaining outside) or semi-endoparasites (body within roots). Previously this genus was observed in 23% of samples in 1956, and 38% in 1978 (Golden and Rebois,1978). Additionally, lance nematode were found in 43% of 199 soybean fields in eight counties of Maryland in 1993 (Sindermann et al., 1993). In the present mini-survey, Lance nematodes were found in 8% samples with only 2% fields having levels higher than ETL. Higher percentages of tested fields (about 25%) were positive for lance nematodes in Delaware, but only 2% of fields were above ETL. Lance nematodes have been associated with alfalfa, barley, carnation, clover, corn, grass, lespedeza, oat, pea, pepper, rye, soybean, sweet potato, timothy, tobacco, tomato, and wheat. No difference in the preference of soil type of this nematode was found and Hoplolaimus spp. were considered less common than other plant parasitic nematodes of the region.

Stubby root nematodes (Trichodorus and Paratrichodorus spp.)

Stubby root nematodes are difficult to manage in corn/soybean rotations, as both crops are susceptible.  Optimal growing condition, especially moisture and fertilizer, will help to support plant growth. Nematicide seed treatments are not effective if high populations of the nematodes are present. Stubby root nematodes may live below the depth that fumigants would be placed, so fumigant treatments are not recommended.

Concluding remarks: Mini-surveys of soybean fields conducted in summer 2019 in Maryland and Delaware soybean growing counties identified Soybean Cyst, Root knot, and Root lesion nematodes as predominant parasitic nematodes in the two states. Dagger and lance nematodes were found to be other potentially damaging nematode genera in variable densities, but not in all samples. Other minor nematode genera observed included Stunt nematode, Needle nematode, and Spiral nematode, with low densities and incidences.  By the time aerial symptoms become apparent, high densities of nematodes have already developed in the field. It is advisable to keep an annual track of problematic nematodes by soil sampling and scouting for root symptoms. Consistent long-term management strategies need to be applied to keep the nematode problem successfully and sustainably in control. Table 1 below summarizes the economic threshold levels and management strategies recommended for managing major problematic soybean nematode genera found in the 2019 mini-survey. It is important to note that the need to consider application of major management strategies should be based on population densities of the parasitic nematodes in your field. If the nematode population density in a field exceeds the ETL, suggested management strategies should be used. For making this decision, it is important to measure the density of particular nematodes in your fields.  The following article, “Sampling for plant parasitic nematodes” provides details about how to correctly collect representative soil samples for nematode determination in crop fields.

Table 1. Economic Thresholds and Management Strategies for Parasitic nematodes found in soybean fields in Maryland and Delaware during a mini-survey conducted in summer 2019.

Nematode ETL* per 500 cc soil Available management strategies
Soybean Cyst Nematode 60 1. Rotate soybeans with non-host crops like corn, small grains, and alfalfa.

2. Avoid lespedeza, hairy vetch, and beans which maintain SCN population.

3. Avoid weeds such as henbit, purple deadnettle, and common mullein.

4. Grow early maturing cultivars if your field has high population level of SCN.

5. Manage and rotate resistant cultivars as majority of ‘PI 88788’ resistant cultivars are becoming susceptible to SCN.

6. If severe nematode populations persist, apply seed treatments such as Aveo and ILEVO.

Root Lesion Nematode >500 1. Grow non-host crop such as ryegrass or canola.

2. Grow relatively tolerant soybean cultivar such as ‘Essex’ and avoid sensitive cultivars such as ‘Forrest’.

3. Delay soybean planting until mid-June, as done with double-crop wheat/soybean systems.

4. Avoid planting other suitable host crops such as tobacco and peanuts.

Root Knot Nematode 170 1. Plant resistant soybean cultivars.

2. Use cover crops ryegrass or canola and incorporate as green manures.

3. Rotate soybean with non-host crops such as Broccoli, cauliflower, grain sorghum or millet (for bird feed) and winter crops such as Rye.

4. If severe RKN persist, apply seed treatment.

Lance Nematode 250 1. Grow moderately tolerant cultivars such as ‘Northrup King’, ‘S83-30’, ‘Coker 368, ‘Centennial, ‘Hagood’ and ‘Maxcy’.

2. Grow small grains if nematode numbers are moderate-to-high.

3. Grow castor bean, rape seeds and sorghum sundangrass as green manure crops and incorporate after three months.

4. If high nematode population exists for several years apply chemical seed treatment.

Dagger Nematode 250 1. Practice crop rotation with corn or grain sorghum, wheat followed by ‘HT-5203’ soybean, or 2-year fallow
Stubby root Nematode >100 1. Grow moderately tolerant cultivars.

2. Avoid host crops such as corn, cotton, and soybean.

References:

Everts, K. L., Sardanelli, S., Kratochvil, R. J., Armentrout, D. K., & Gallagher, L. E. (2006). Root knot and root lesion nematode suppression by cover crops, poultry litter, and poultry litter compost. Plant Disease, 90, 487–492.

Golden, A. M., & Rebois, R. V. (1978). Nematodes on soybean in Maryland. Plant Disease Report, 62, 430–432.

Jenkins, W. R., Taylor, D. P., & Rohde, R. A. (1956). A preliminary report of nematodes found on corn, tobacco, and soybean in Maryland. Plant Disease Report, 40, 37–38.

Sardanelli, S. L., Krusberg, L. R., Kantzes, J. G., & Hutzell, P. A. (1982). Soybean cyst nematode, fact sheet 340. College Park: Maryland Cooperative Extension Service.

Sindermann, A., Williams, G., Sardanelli, S., & Krusberg, L. R. (1993). Survey for Heterodera glycines in Maryland. Journal of Nematology, 25, 887–889.

 

Evaluating Efficacy of Aerial Spray Applications Using Drones

Andrew Kness and Erika Crowl
University of Maryland Extension

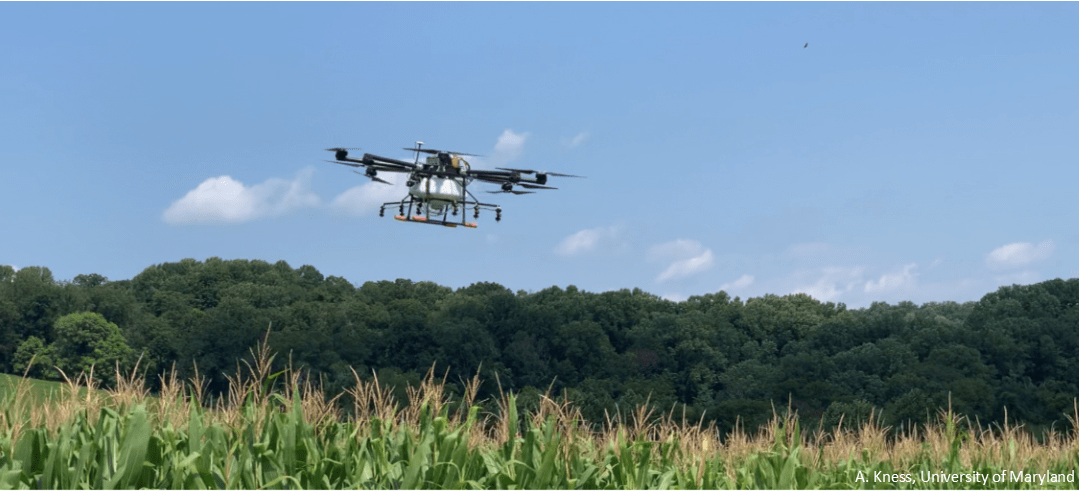
Drone flying over corn fieldDrones are becoming increasingly popular in agriculture for not only imagery, but product application. As a result, startup companies offering aerial pesticide application via drone are emerging. Farmers have taken interest in the technology and service for several reasons, but the main benefit to using a drone to apply crop production products in soybean and corn is that it offers a feasible method for in-season foliar product application to fields that are smaller, fragmented, or irregularly shaped, without the potential for damaging the crop with a ground spray rig. Additionally, drones may have an advantage over helicopters or fixed-winged aircraft in small fields because they are more nimble and have the potential to achieve application to field edges that would be missed by aircraft. Finally, drones are much less intrusive to curious neighbors who often raise concerns when they see an aircraft applying products to fields.

Although drones offer a lot of potential, there is very little published data on their efficacy to apply products, which is cause for question and concern as to if drones are a viable and worthwhile means of applying products, such as pesticides, to corn and soybeans. Additionally, drones tend to lack spray tank capacity, so spray volumes with drone applications are low (1-2 gallons per acre). These low-volumes may pose challenges in achieving adequate coverage; however, products are applied at a greater concentration. This research project, funded by the Maryland Soybean Board, aims to collect data regarding drone spray efficacy in corn and soybean.

Methods

Two different drones (Figure 1) were used to apply water to standing corn and soybeans in fields located in Harford County, Maryland on August 27, 2020. Corn was planted on 30-inch rows and at the R4 growth stage during application. Full season soybeans were planted on 15-inch rows and at R6 during application.

drones used for aerial spraying
Figure 1. Drone 1: HSE-TTA (left) and Drone 2: DJI (right).

The drones were operated by certified pilots who offer custom pesticide application in field crop and nurseries. Weather conditions were sunny and 91°F with variable winds out of the Northeast at 5 mph, gusting to 25 mph.

Prior to spraying, water-sensitive cards (Syngenta AG®, Basel, Switzerland) were placed within the crop canopy at various heights in sets of five replicates. Three heights were used for both corn (top: third leaf from tassel; middle: ear leaf; and bottom: third leaf from bottom) and soybean (top: upper most fully expanded leaf; mid: middle of canopy; and bottom; 1 foot up from soil). When water droplets hit the card, the card arrests the spread of the droplet and stains the card blue. The cards were retrieved then scanned into the computer and analyzed using the software DepositScan (USDA-ARS, Wooster, OH), which calculates percent spray coverage, droplet density, and droplet size.

Each drone applicator flew on water at approximately 4 feet above the canopy at 16 mph onto corn and soybeans at a rate of 1 gallon per acre for Drone 1 and 1.5 gallons per acre for Drone 2 using TeeJet® TXA8002VK nozzles.

Results & Discussion

Due to the extremely high humidity, close canopy, and transpiration rate of the soybean plants, the middle and bottom spray cards in the soybean plots were difficult to read. As a result, data for bottom soybean cards were omitted.

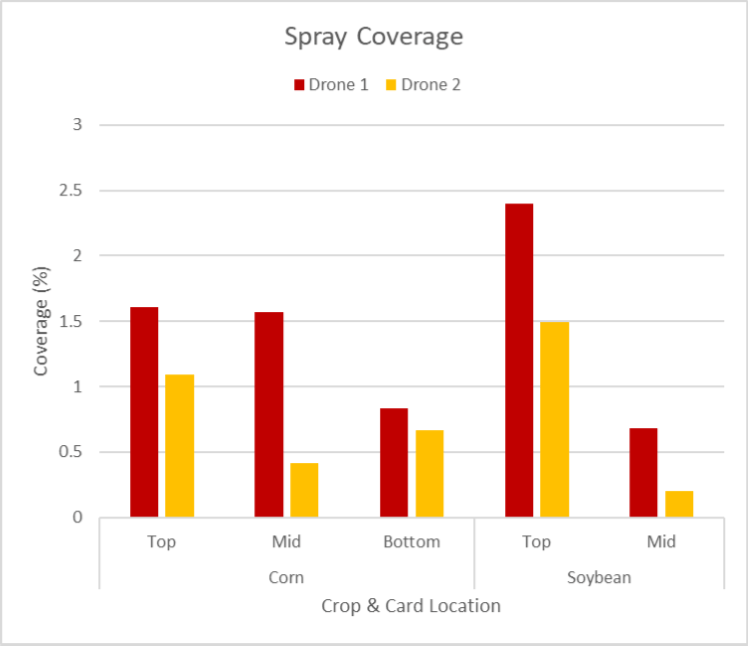
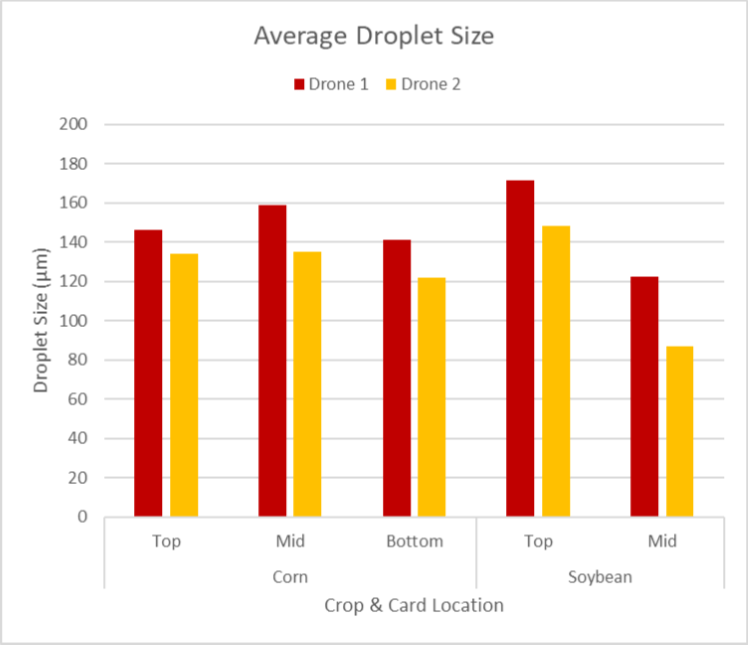
As to be expected, spray coverage was highest in the top of the canopy for both corn and soybean for both drones (Figure 2). Drone 1 achieved 1.61% and 2.40% coverage in the top canopy of corn and soybean respectively. Drone 2 also achieved greater coverage in the top canopy of soybean (1.50%) than corn (1.10%). Both drones delivered nearly identical droplet density (Figure 3) in the top canopy of both corn (18.9 drops/cm2) and soybean (22.0 drops/cm2). Droplet size (Figure 4) in the top canopy of corn for Drone 1 was 146 µm vs. 134 µm for Drone 2 and 171 µm for Drone 1 vs 148 µm for Drone 2 in soybean top canopy.

Figure 2. Average percent spray coverage for water sensitive spray cards placed in the top, middle, and bottom canopy of corn and soybean for two drones.
Figure 3. Average droplet density on water sensitive spray cards placed in the top, middle, and bottom canopy of corn and soybean for two drones.

Spray coverage dropped only slightly for Drone 1 (to 1.57%) in corn from top to middle, but much more in soybean (down to 0.68%), likely due to the dense canopy. Coverage dropped to 0.42% for Drone 2 at the ear leaf in corn and down to 0.20% in the mid canopy soybean. Drone 1 achieved 21.65 drops/cm2 for the ear leaf in corn whereas Drone 2 delivered 7.00 drops/cm2. In mid canopy soybean, droplet density was similar for both drones (13.5 drops/cm2 for Drone 1 and 10.17 drops/cm2 for Drone 2). Droplet size for both drones were similar between top, middle, and bottom corn. Droplet size decreased for both drones in middle canopy soybean to 122 µm for Drone 1 and 87 µm for Drone 2.

Figure 4. Average droplet size for Drones 1 and 2 on water sensitive spray cards placed in the top, middle, and bottom canopy of corn and soybean.

Spray coverage and droplet density were similar for both drones in bottom canopy corn. Spray cards for bottom canopy soybeans were not analyzed due to artifacts created by canopy humidity.

It is generally recommended that droplet density should be between 20-30 droplets/cm2 for adequate insecticide application, between 20-40 droplets/cm2 for herbicide application, and at least 50 droplets/cm2 for fungicide applications. Based on these assumptions, both Drones have the capability to deliver densities at or over 20 droplets/cm2 in the upper canopy, which may be adequate for herbicide or insecticide applications. However, a greater density of droplets needs to be achieved for adequate fungicide application. Previous research has shown that flight velocity plays a significant role in droplet density and spray coverage (Hunter III et. al., 2020). Spraying slower would likely improve coverage and efficacy of fungicides applied via drones, which will be an area of future research for this project.

Example Spray Card Images (click to enlarge)


Acknowledgements

We would like to thank the Maryland Soybean Board for funding this research, A1-Aerials, K Drone, and Crowl Brothers, Inc. for collaborating on this research project.

Literature Cited

Hunter JE III, Gannon TW, Richardson RJ, Yelverton FH, Leon RG (2020) Coverage and drift potential associated with nozzle and speed selection for herbicide applications using an unmanned aerial sprayer. Weed Technol. 34: 235–240. doi: 10.1017/ wet.2019.101


Evaluating Drone-Seeded Cover Crops

Erika Crowl and Andrew Kness
University of Maryland Extension

Recent interest has been generated in using drones to seed cover crops into agronomic crops in small, irregularly shaped fields with rolling terrain or those fields otherwise not suitable for aerial seeding using a fixed-wing aircraft or helicopter. However, little is known about how effective drones are at seeding cover crops and if they can deliver seed at the appropriate rate to establish a sufficient cover crop. In order to evaluate cover crop stand establishment seeded via drones, we conducted an on-farm trial with support from the Maryland Soybean Board.

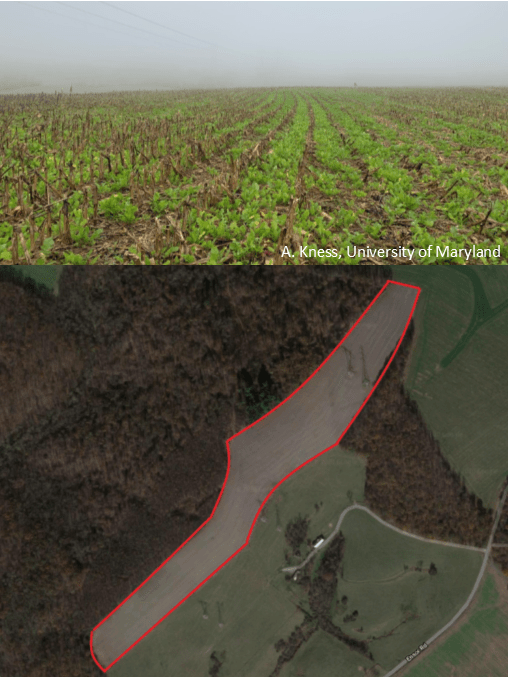
A cover crop of radish was flown on to a 26 acre standing corn field in Baltimore County, MD on August 27, 2020 at the rate of 16 pounds of pure live seed per acre using a HSE-TTA drone equipped with a spin spreader capable of carrying 40 lbs of seed. The field was an excellent candidate for this trial because of its irregular shape, rolling terrain, and close proximity to power lines and wood lines (Figure 1). Corn grain was harvested on September 15, 2020 and cover crop establishment was measured on October 21, 2020 by counting the number of radish plants per square foot in a one square foot area at 20 random locations across the field. The average cover crop plant population in the field was 3.1 plants/ft2, with a minimum of 0 and maximum of 6. Radish plants averaged 5 inches in height at the time of rating.

field seeded with radish cover crop
Figure 1. Field location of drone-seeded cover crop (outlined in red). Image: Google Maps (bottom).

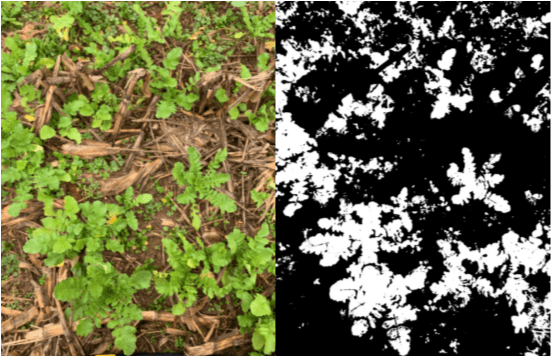
Canopy density was calculated using the Canopeo© application for smartphones (Oklahoma State University Department of Plant and Soil Sciences, Stillwater, OK; www.canopeoapp.com). Images were captured at 20 random locations across the field at a height of 2.5 feet above the ground and percentage green canopy was calculated by the Canopeo software (Figure 2). Average canopy coverage was 39.1%, with a minimum and maximum value of 20.3 and 53%, respectively.

field seeded with radish cover crop
Figure 2. Unedited image (left) and percentage canopy cover image (right) calculated by Canopeo software showing 31% coverage.

Aerial establishment of cover crops is heavily influenced by soil moisture availability. August and early September saw sufficient rainfall in the region, contributing to conducive conditions for cover crop establishment. These data, representing only one field and one environment, demonstrate the potential that aerial seeding a radish cover crop with drones may be an effective method for establishing cover crops in these challenging fields. Future work will be done to replicate and gather additional data so that we can fully understand the feasibility of seeding cover crops with drones.

Acknowledgements: We would like to thank A-1 Aerials, K Drone Services, Graystone Farm, and the Maryland Soybean Board for supporting this work.


2020 Forage Variety Trial Update

Amanda Grev, Pasture and Forage Specialist
University of Maryland Extension

As new forage varieties continue to be developed and released, the efficacy and performance of these varieties needs to be evaluated. Similarly, as forage and livestock producers are making decisions on which forage species and variety to establish, it is helpful to compare performance data from a number of available varieties. To this end, the University of Maryland Extension Forage Team is in the process of establishing a series of forage variety trials.

In September 2019, an orchardgrass variety trial was established at the Western Maryland Research and Education Center (WMREC) in Keedysville, MD in order to evaluate select orchardgrass varieties based on forage production and quality. Plots were arranged in a randomized complete block design with each individual entry replicated four times. All varieties were planted at a rate of 25 pounds per acre; seed was broadcast and then cultipacked to establish good seed-to-soil contact. The varieties planted included: Alpine, Bounty II, Extend, HLR Blend, Inavale, Olathe, Pennlate, and Rushmore II.

Data collection began when the majority of forage varieties reached the boot stage of development (prior to seed head emergence). The first cutting occurred on May 18, 2020; this was followed by a second cutting on August 3, 2020 and a third and final cutting on September 28, 2020. At each cutting, forage biomass was collected along a 3 ft. by 20 ft. strip from the center of each plot using a forage harvester set to a cutting height of 4 inches. Collected biomass was weighed, dried in a forced air oven, and weighed again for dry matter and forage yield determination. Sub-samples were also taken from each plot and sent to a commercial laboratory for forage quality analysis.

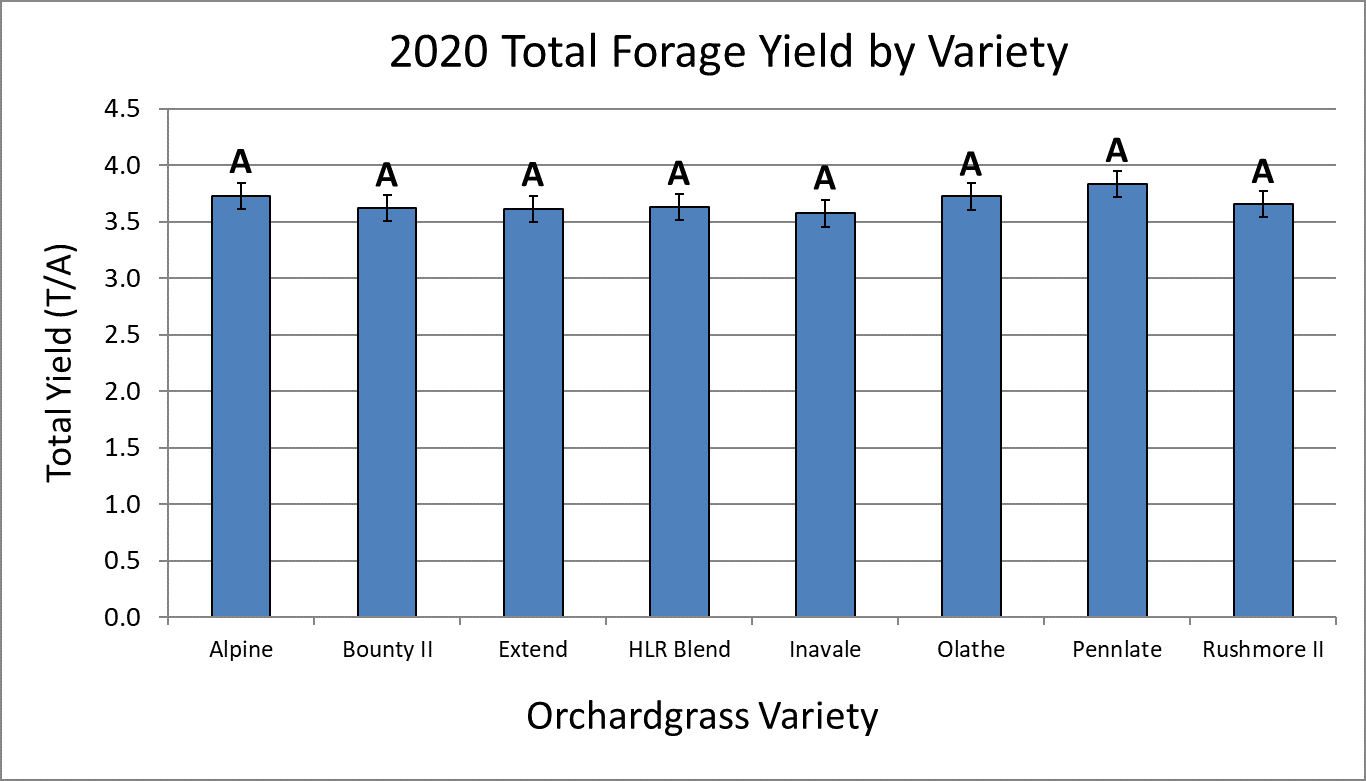
Seasonal cumulative yield for all orchardgrass varieties ranged from 3.6 to 3.8 tons per acre (Figure 1). Statistical analysis indicates no significant difference in forage yield among any of the varieties for the 2020 growing season. Forage quality analysis is underway; forage quality results will be shared once the analysis is complete.

A big thank you to Jeff Semler and the entire WMREC crew for their assistance in getting this trial started and their help with harvest and data collection. Seed for this study was donated by DLF Pickseed, Seedway, and Kings Agriseeds. These plots will continue to be evaluated for yield, quality, and additional performance parameters in the coming years. We hope to expand the trial to include multiple locations, as well as additional forage species and varieties.

Figure 1. Orchardgrass forage variety trial yield results for 2020, presented as total seasonal yield in tons per acre. Varieties marked by a common letter indicate similar yield production (i.e. no significant difference).

Planting Population Effects on Soybean Yield

Kelly Nichols, Agriculture Agent
University of Maryland Extension, Montgomery County

Research on the effect of soybean planting population on yield was conducted for a second year. In 2019, there were two on-farm locations in Frederick County. This year, the study was expanded to include one on-farm location in Carroll County and four University research farm locations (Keedysville, Beltsville, Upper Marlboro, and Queenstown). Soybeans were planted at 80,000, 100,000, 120,000, 140,000, and 160,000 plants per acre. At the Queenstown location, a population of 50,000 plants per acre was added.

A final stand count was taken prior to harvest at all locations. While we are still summarizing and collecting data, a few observations can be made. Final stand counts indicate that similar plant loss occurred across all planted populations, most likely due to the percent germination of the seed, insects, disease, and weather. Soybeans at the lower populations were more branched and bushy compared to soybeans in the higher populations. This is not surprising, as beans are able to compensate for missing plants around them. This ability to compensate may result in comparable yields across the planted populations. In 2019, yields across all populations were within a few bushels and not statistically different. The cost of the seed will be compared to the sale of the soybeans to determine net profit per acre. For more information on the 2019 and 2020 results (once completed), visit this project’s webpage on the National Soybean Research Checkoff Database.