April 2023 Grain Markey Update

Dale Johnson, Farm Management Specialist
University of Maryland

Information from USDA WASDE report

Attached is the summary for the April 2023 WASDE.
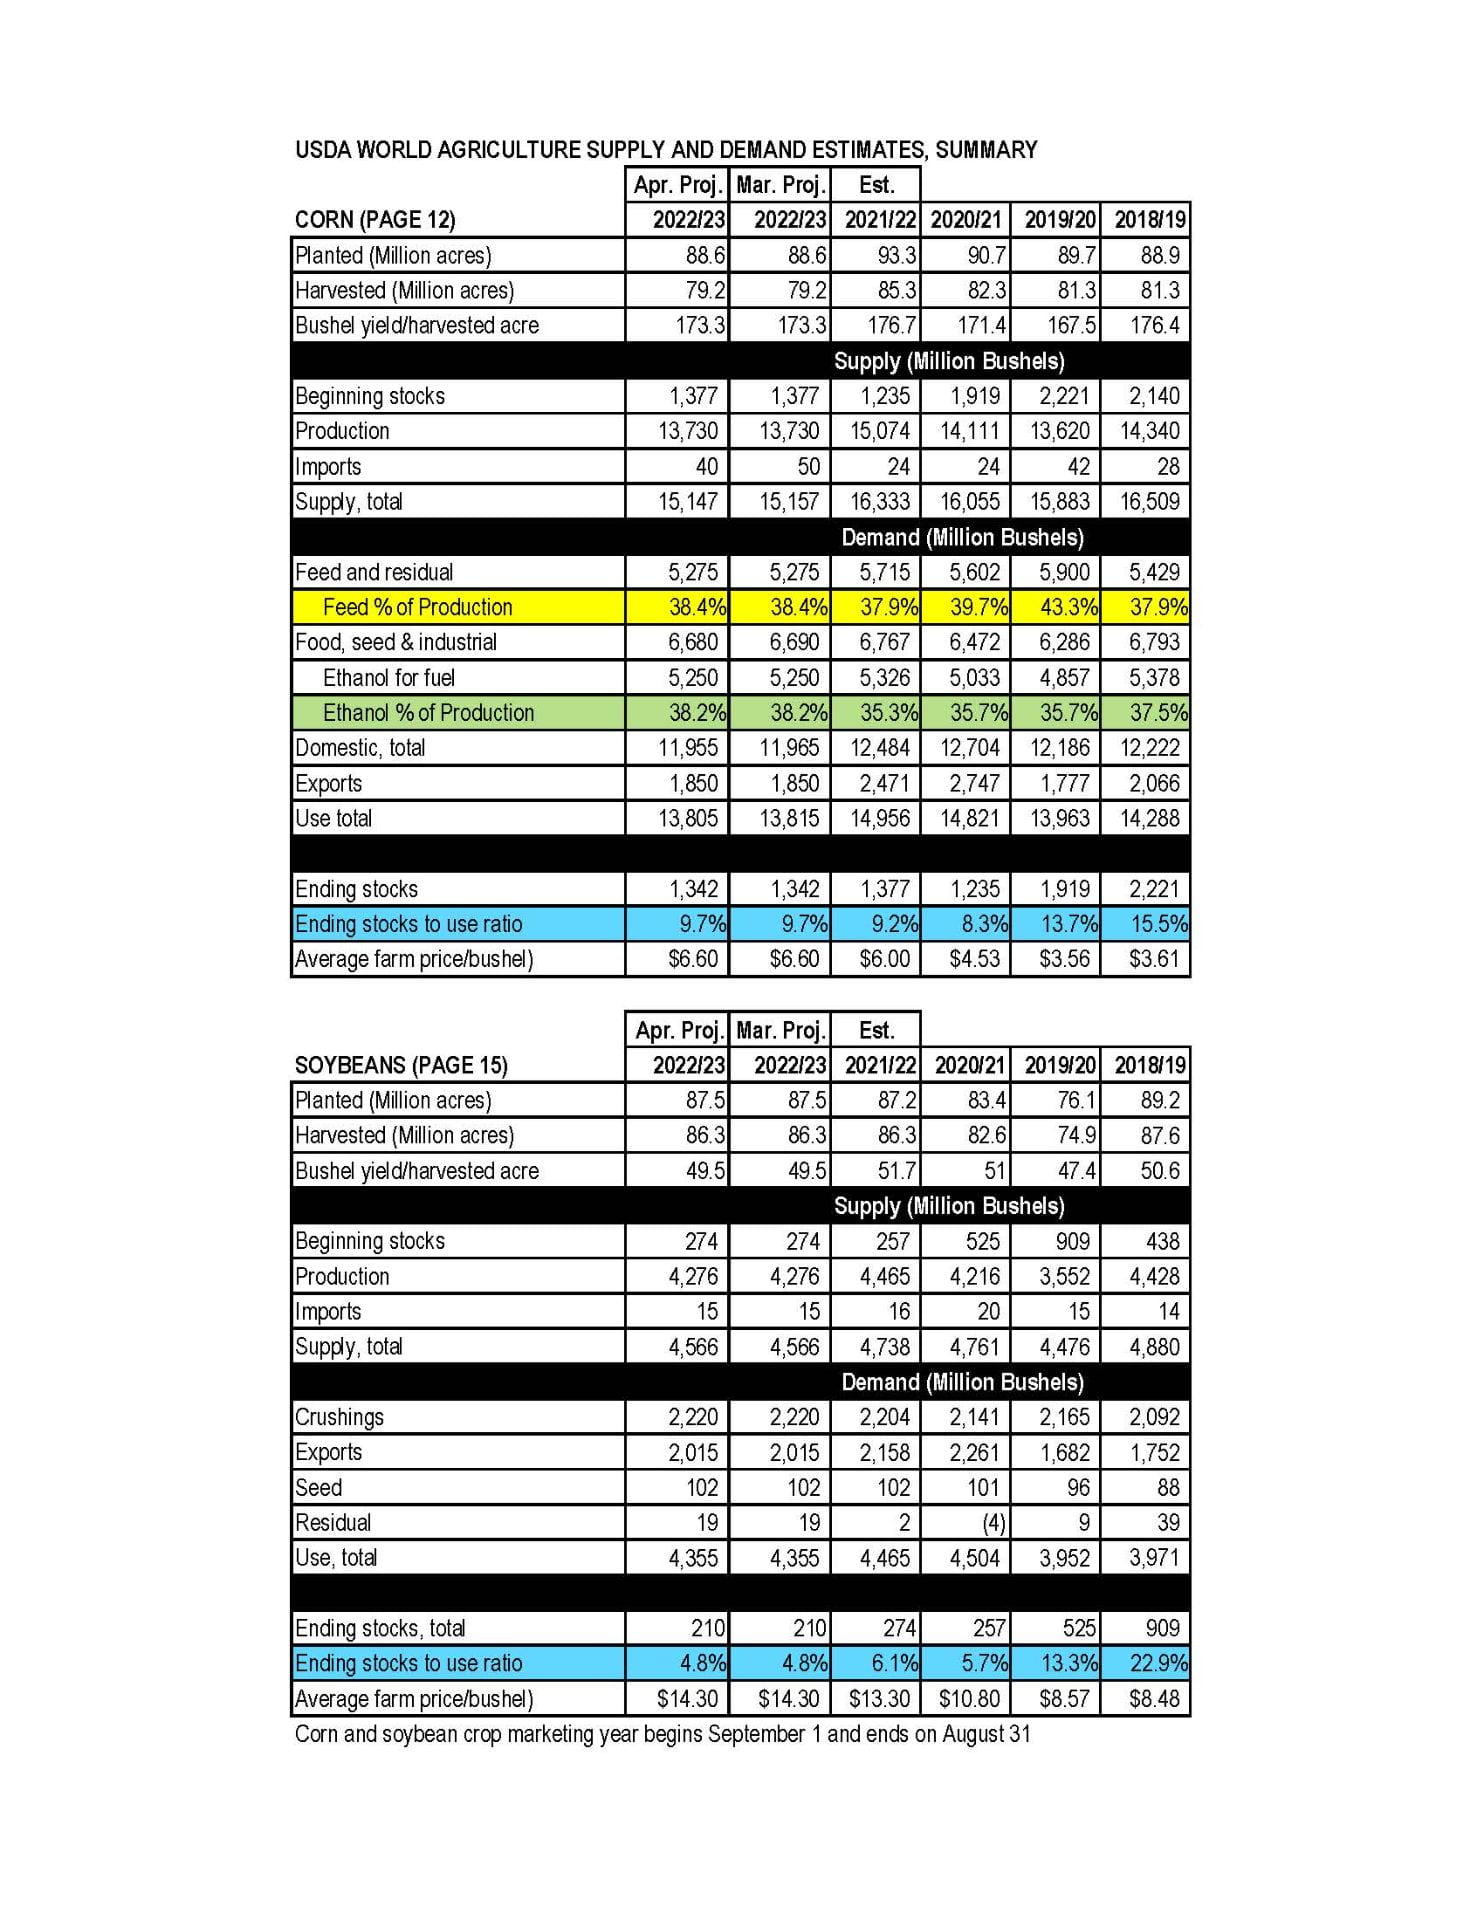
Corn

This month’s ‘22/23 U.S. corn outlook is for reductions to imports and food, seed, and industrial (FSI) use, with unchanged ending stocks. Corn imports are lowered 10 million bushels based on observed trade to date. Feed and residual use is unchanged at 5.275 billion based on indicated disappearance during the December-February quarter. FSI is lowered 10 million bushels reflecting cuts to corn used for glucose and dextrose and starch. With supply and use falling by the same amount, ending stocks are unchanged at 1.342 billion bu. The season-average price is unchanged at $6.60 per bu.

Soybeans

U.S. soybean supply and use forecasts for ‘22/23 are unchanged relative to last month. Soybean and soybean meal prices are also unchanged. The soybean oil price is projected at 64.0 cents per pound, down 2 cents. Global ‘22/23 soybean supply and demand forecasts include lower production, crush, and exports. Global soybean production is reduced 5.5 million tons to 369.6 million. Lower crops for Argentina and Uruguay are partly offset by higher production for Brazil. Soybean production for Argentina is lowered 6.0 million tons to 27.0 million on hot and dry weather conditions through March. Uruguay production is lowered 0.9 million tons to 1.2 million on a lower harvested area and yield. Partly offsetting is higher production for Brazil,  increased 1.0 million tons to 154.0 million on higher area. Soybean crush is lowered on reduced supplies and slow pace to date for Argentina, China, Bangladesh, Pakistan, and Egypt. Crush for Argentina is reduced 3.3 million tons to 32.0 million leading to lower product exports. Partly offsetting is higher crush and higher soybean oil and meal exports for Brazil. Soybean exports are lowered 0.4 million tons to 168.0 million on lower exports for Uruguay. Imports are lowered for Bangladesh, Egypt, and Pakistan and raised for Argentina. Soybean ending stocks are raised fractionally with higher stocks for China and Brazil that are mostly offset by lower stocks for Argentina.
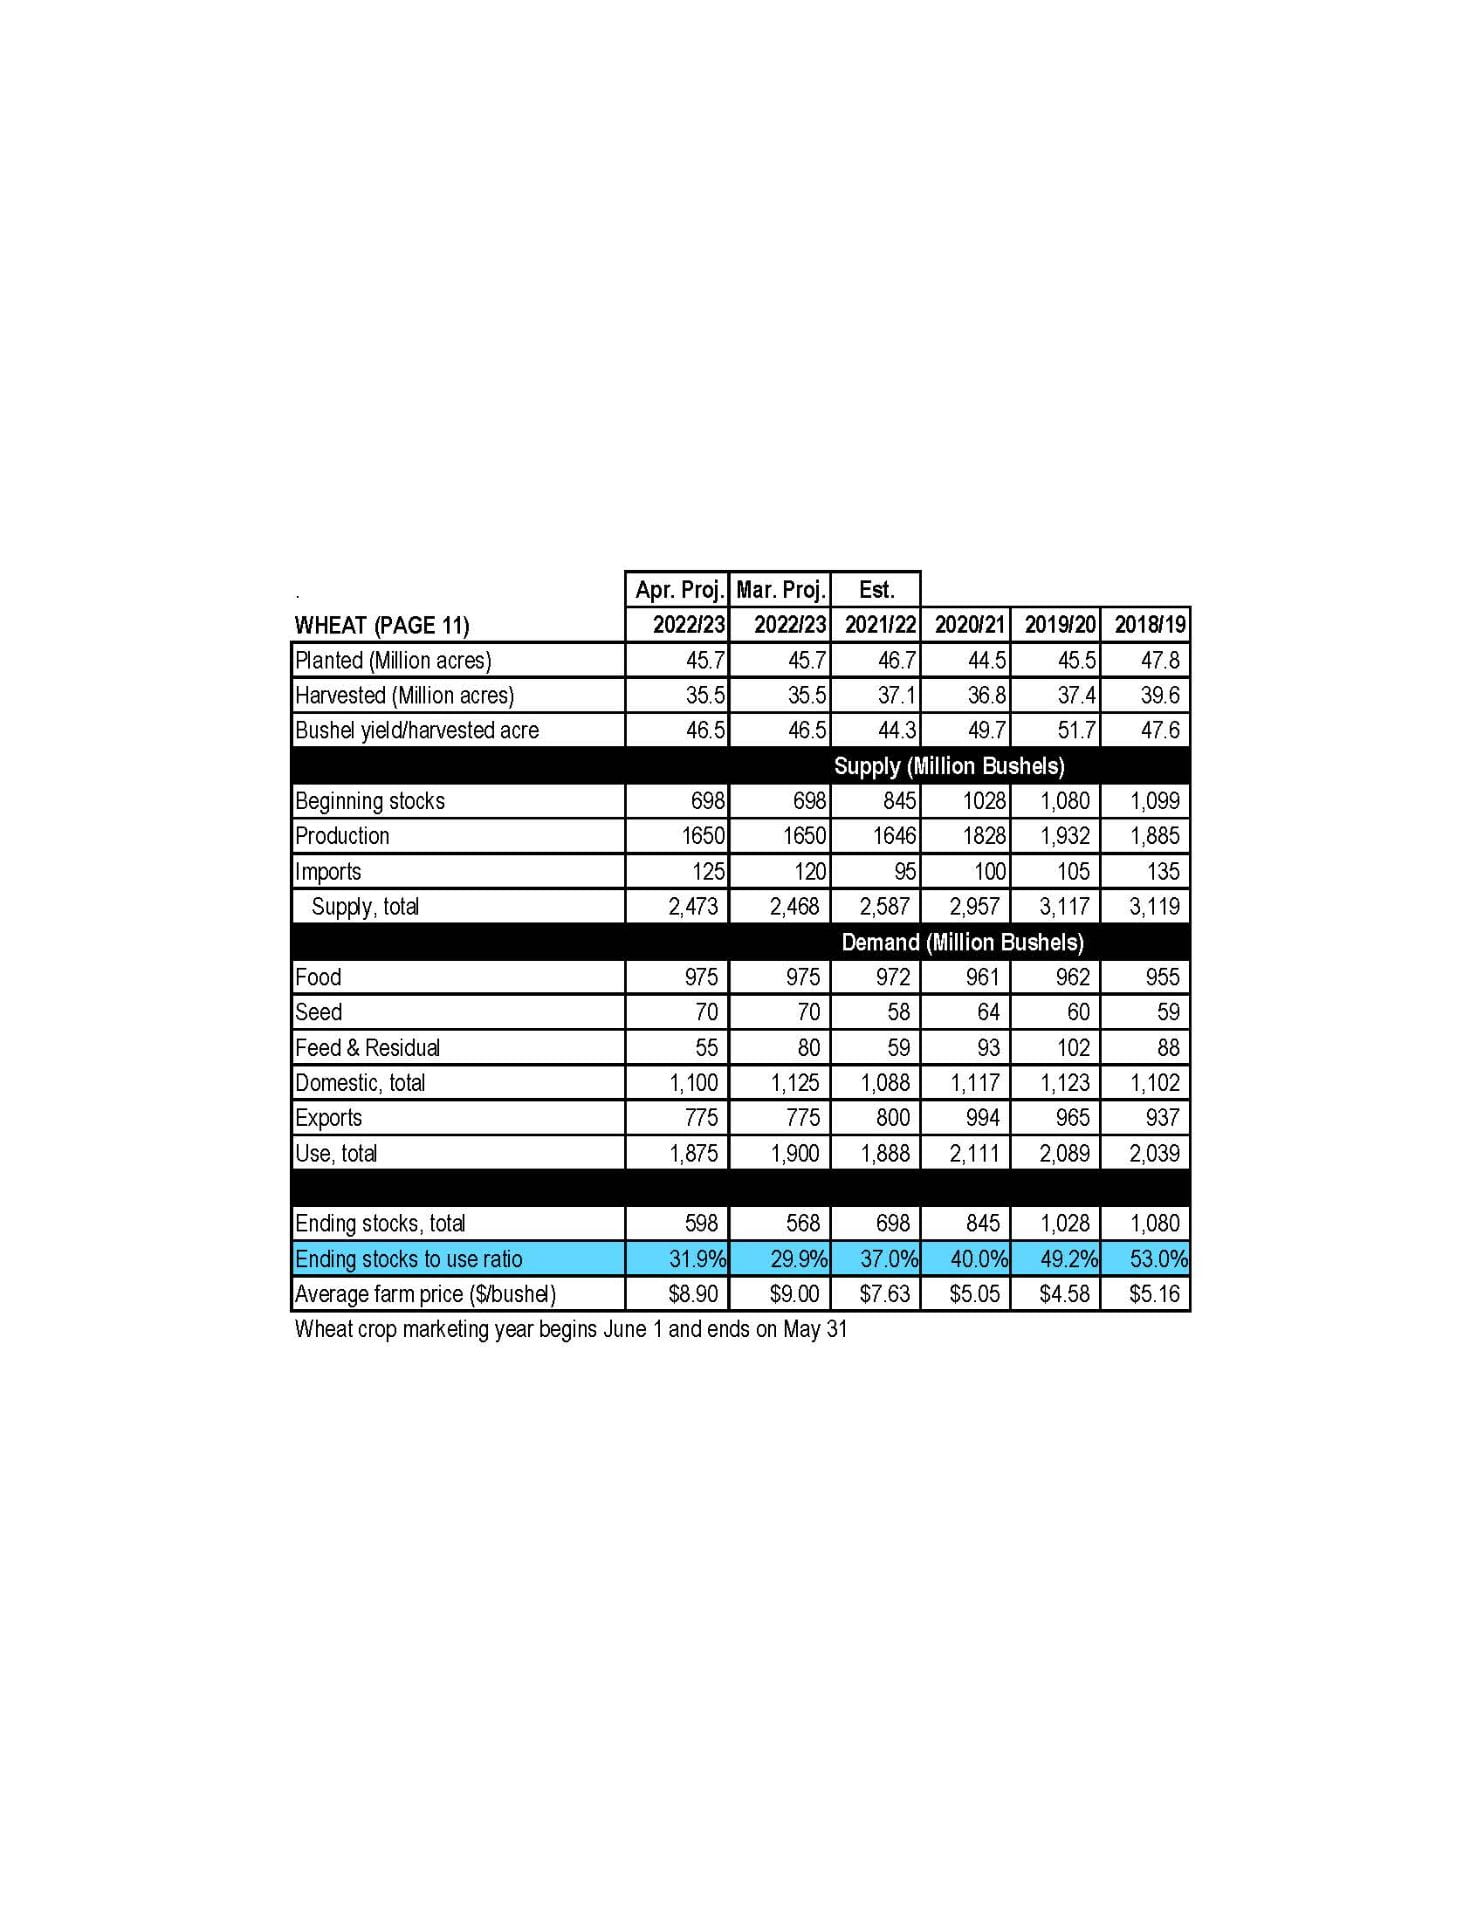
Wheat

The outlook for ‘22/23 U.S. wheat this month is for slightly higher supplies, reduced domestic use, unchanged exports, and increased ending stocks. Supplies are raised 5 million bushels on higher imports, based on the pace of Census imports reported to date. Domestic use is lowered 25 million bushels on reduced feed and residual use, which is decreased to 55 million. The downward revision is based on the implied disappearance for the second and third quarters indicated in the NASS Grain Stocks report. Wheat exports remain at 775 million bushels but there are offsetting by-class changes for White and Hard Red Spring exports. Projected ‘22/23 ending stocks are raised 30 million bushels to 598 million but are still 14% below last year. The ‘22/23 season-average farm price is forecast $0.10 per bushel lower at $8.90, based on NASS prices reported to date and expectations for cash prices for the remainder of ‘22/23. The global wheat outlook for ‘22/23 is for increased supplies, higher consumption, and reduced trade and stocks. Supplies are raised 0.7 million tons to 1,061.1 million, primarily on higher beginning stocks for Syria and increased production for Ethiopia. Global consumption is increased 2.9 million tons to 796.1 million, mainly on higher food, seed, and industrial use for India, and increased feed and residual use for China and the EU. World trade is lowered 1.2 million tons to 212.7 million on reduced exports by the EU, Argentina, and Brazil more than offsetting increases for Russia and Ukraine. China’s wheat imports are raised 2.0 million tons to 12.0 million, which would be the highest imports for China since 1995/96. China’s imports are raised on strong imports to date, particularly from Australia; China is now the leading 2022/23 global wheat importer. Projected 2022/23 world ending stocks are lowered 2.1 million tons to 265.1 million, the lowest since 2015/16. This month, India, the Philippines, and Ukraine are projected to have lower stocks, more than offsetting increases for Syria, the EU, and the United States.

New Web-Based Soybean Herbicide Selection Tool

Alan Leslie, Center Director
Maryland Agriculture Experiment Station

With grant funding from the Maryland Soybean Board, we have developed a new web-based app for selecting herbicides to use in soybean production. The goal for this new tool is to provide guidance in navigating different herbicide options with a simple user interface. The web app allows you to download a summary of your custom herbicide program as a PDF document for your records. Herbicide inputs can then be used to create your custom crop budgets using the web-based crop budget tool.

To use the app, users first select the major weed species from the lists that are the key management concerns on their farm. Choices of herbicides will then appear in three tables: burndown herbicides, pre-emergence herbicides, and post-emergence herbicides. These tables show herbicide options that are effective against at least one of the weed species selected. Users then use these tables to select their burndown, pre-emergence, and post-emergence herbicides, with the option to select between zero and three chemicals for each application. The page is then pre-populated with recommended rates and estimated costs, though actual rates and costs can be inputted by the user. After all of this information is entered, users can click the button to generate a report of everything they entered.

We are interested in gathering feedback and input about this new tool and ways to improve it in the future. After testing the new pesticide selection and crop budget tools, we would appreciate if you could take a few minutes to provide feedback through our online comment form. Feedback will be used to develop better tools in the future.

Figure 1. Screenshot of the web-app tool, showing where to select key weed species, where to view herbicide efficacy information, and where to input herbicide choices.

Wet Cool Spring May Increase Slug Damage

Maria Cramer, Graduate Student and Kelly Hamby, Entomology Specialist
Department of Entomology, University of Maryland, College Park

Recently planted field crops may be at risk from slug damage due to the heavy rains and cooler temperatures we have experienced in the mid-Atlantic from the end of April into the beginning of May. Therefore, the UMD fact sheet “Managing Slugs in Field Crops Using IPM Principles” may be of interest. This fact sheet summarizes the most up-to-date research on managing slugs in our area. Highlights include:

  1. Identify the pest and monitor. Make sure the issue is slugs. If it is cool and overcast you may find slugs (Figure 1A+B) or slug eggs (Figure 2) in crop residue. Otherwise, as they are nocturnal, you may only find their damage on plants (Figure 3A+B). Corn is generally tolerant to defoliation, while soybeans are at risk if the growing point of the plant is damaged.
  2. Prevent. If you have not planted yet and if possible, use row cleaners and adjust the planter so that the seed slot fully closes to reduce the risk of damage. In the long term, reducing insecticidal seed treatments may favor slug predatory insects and harvestmen.
  3. Treat. If you use a slug bait, maximize efficacy by applying just prior to slug activity (in the afternoon or evening when weather is still and mild), but not before periods of heavy rain which may make the active ingredient less effective. Remember, the label is the law. Make sure the product you use is registered in your state and for your crop(s). Follow all application restrictions.
Figure 1. A) Gray garden slug and B) Marsh slug.
Figure 2. Slug eggs in corn residue.
Figure 3. A) Foliar feeding in corn with dried mucus, and B) feeding on soybean cotyledons showing characteristic pitting.

How’s That Burndown Looking?

Kurt Vollmer, Extension Weed Management Specialist | kvollmer@umd.edu
University of Maryland Extension

In last month’s issue of Agronomy News, I discussed considerations for glyphosate-based burndown programs. This month I wanted to share some of my results using similar programs to manage a rye (Fig. 1) and hairy vetch (Fig. 2) cover crop. Treatments were applied on April 11, and consisted of glyphosate, glufosinate, paraquat, glyphosate + 2,4-D, glyphosate + dicamba, glyphosate + glufosinate, and glyphosate + paraquat. Currently, this is what I am seeing:

  • Glyphosate tank mixed with 2,4-D, dicamba, and glufosinate are doing an excellent job controlling hairy vetch, and glufosinate alone is providing similar control (Fig 3.);
  • Vetch control appears to be declining with individual treatments of glyphosate and paraquat, as well as the mixture of the two (Fig. 4);
  • Glyphosate + 2,4-D is doing an excellent job controlling cereal rye (Fig. 3b), but control with glyphosate alone has improved (Figs. 4a, 4b).
Figure 1. Hairy vetch control 2 and 3 weeks after application (WAA).
Figure 2. Cereal rye control 2 and 3 weeks after application (WAA).
*Glyphosate containing treatments consisted of 20.5 fl. oz./A Roundup PowerMax3®; glufosinate containing treatments consisted of 43 fl. oz./a Liberty 280®, paraquat containing treatments consisted of 3 pt/A Gramoxone SL 2.0®, 2,4-D containing treatments consisted of 2 pt./A Enlist One®, and dicamba containing treatments consisted of 12.8 fl. oz./A Engenia®
*Ammonium sulfate (8.5 lb./A) was included in all treatments except the glyphosate + dicamba treatment, nonionic surfactant (0.25% v/v) was included with 2,4-D and dicamba treatments, crop oil (1% v/v) was included with paraquat treatments.
*Treatments were applied using Turbo Teejet 11002 nozzles at spray volume of 15 gal/A.

As previously discussed, the same herbicide program may not have the same desired effect on all species. Here are some things to remember.

  1. There are certain species where control with glyphosate can be difficult, even if those species are not classified as being glyphosate-resistant. Additional trials from the Mid-Atlantic have also indicated lower vetch control with glyphosate alone (Figs. 4a, 4b) compared to glyphosate tank mixtures (Figs. 3b, 3c, 3d).
  2. Group 4 herbicides such as 2,4-D and dicamba, will not control grasses. In addition, including dicamba in a tank mix with glyphosate has been shown to reduce glyphosate’s ability to control grasses (Fig. 3c).
  3. Contact herbicides such as glufosinate and paraquat require good spray coverage for optimal control. If plants are too large, if spray volume is too low, or if nozzles do not provide adequate spray coverage, then plants can regrow (Figs. 4c, 4d).
Figure 3. Efficacy of preplant herbicides for managing a rye/vetch cover crop 2 weeks after application
Figure 4. Differences in herbicide efficacy for managing a rye/vetch cover crop 2 and 3 weeks after application.

Considerations for Burndown Programs in 2023

Kurt Vollmer, Extension Weed Management Specialist | kvollmer@umd.edu
University of Maryland Extension

It’s that time of year when growers are considering which herbicides to include in their burndown programs. Utilizing effective herbicides will help to ensure less weed competition at planting. However, growers should consider not only what herbicides they plan to use in their burndown programs, but also the weed species present in the field.

The most common preplant treatment for both corn and soybean is either a combination of 2,4-D + glyphosate or dicamba + glyphosate. These mixtures can provide good to excellent control of winter annual weeds such as common chickweed and common groundsel, as well as good control of emerging summer annual species such as common lambsquarters and foxtail species. These herbicides can also control henbit, purple deadnettle, and mustard species if sprayed before flowering and seed set. However, control may be reduced with winter annual weeds such as Carolina geranium and field pansy, as well as perennial species such as curly dock. If Carolina geranium and field pansy are present, consider adding atrazine or metribuzin to the tank mix. If curly dock is a problem consider using Harmony + 2,4-D.

The use of these herbicides will also influence planting date if using non-tolerant varieties, such as Enlist® (2,4-D) and XtendFlex® (dicamba). Generic forms of 2,4-D or dicamba should be applied 7 to 14 days before or 3 to 5 days after planting corn. The planting interval for soybean will depend on the amount of product applied. For most generic 2,4-D esters (LVE), wait at least 7 days if using 1 pt/A and at least 30 days if using 2 pt/A. However, some LVE formulations allow a 15 day application interval, be sure to consult the product label for specific instructions. The planting interval for dicamba formulations is at least 14 days if 0.5 pt/A is applied and at least 28 days if 1 pt/A is applied.

Glyphosate resistant weeds such as horseweed (marestail) and common ragweed may also be present at the time of application. Be advised that when using combinations of glyphosate and 2,4-D or dicamba, the 2,4-D or dicamba component is being relied upon to control these weeds. Therefore, these species should be sprayed when they are small (< 6 in.). Local data has shown applications of 2,4-D or dicamba made 30 days before planting to be more effective on horseweed than applications made 14 days before planting. Sharpen® is another option for controlling horseweed that is less than 6 inches tall.

Finally, it is important to note the importance temperature will play in the efficacy of these herbicides. When the temperature is lower than 60˚F, weed growth slows, resulting in reduced uptake and translocation of systemic herbicides like 2,4-D, dicamba, and glyphosate. If the temperature is below 40˚F, it is best to avoid applying these herbicides until conditions are more suitable. Fortunately, it looks like warmer days are ahead!

March 2023 Grain Market Update

Dale Johnson, Farm Management Specialist
University of Maryland

Information from USDA WASDE report

Attached is the summary for the March 2023 WASDE.

Corn

This month’s 2022/23 U.S. corn outlook is for lower exports and larger ending stocks. Exports are reduced 75 million bushels reflecting the poor pace of sales and shipments to date despite relatively competitive U.S. prices. With no other use changes, ending stocks are up 75 million bushels from last month. The season-average corn price received by producers is lowered 10 cents to $6.60 per bushel based on reported prices to date. Ending stocks-to-use ratio increased from 9.1% in February to 9.7% in March.

Soybeans

U.S. soybean supply and use changes for 2022/23 include higher exports, lower crush, and reduced ending stocks compared with last month’s report. Soybean exports are raised 25 million bushels to 2.02 billion based on higher-than-expected shipments through February. Soybean crush is reduced on a small reduction in domestic soybean meal disappearance combined with a higher extraction rate. With higher exports more than offsetting lower crush, ending stocks are reduced 15 million bushels to 210 million. If realized, ending stocks would be the lowest in seven years. With relatively strong domestic demand for soybean oil limiting export competitiveness, U.S. soybean oil exports are reduced 200 million pounds to a historically low 500 million. Higher domestic use and reduced production are offsetting, leaving soybean oil stocks unchanged this month. Ending stocks-to-use ratio decreased from 5.2% to 4.8%, the lowest since the 2012/13 marketing year.

Wheat

The 2022/23 U.S. wheat supply and demand outlook is unchanged from last month. The projected season-average farm price remains $9.00 per bushel.

MD Grain Marketing Site Updated for 2023: Field Crop Budgets and Custom Rates

Shannon Dill, Principal Agriculture Agent
University of Maryland Extension, Talbot County

The University of Maryland Extension has updated the grain marketing website (www.go.umd.edu/grainmarketing) with new input data and spray programs for the 2023 field crop budgets. Also posted is the recent 2023 Maryland and Delaware Custom Rate Survey.

Crop Budgets

Cost of production is essential when making decisions about your farm enterprise and grain marketing. Enterprise budgets provide valuable information regarding individual enterprises on the farm. An enterprise budget uses farm revenue, variable cost, fixed cost, and net income to provide a clear picture of the financial health of each farm enterprise. This tool enables farm managers to make decisions regarding enterprises and plan for the coming production year.

The 2023 Maryland enterprise budgets were developed using average yields and estimated input costs based on producer and farm supplier data. The figures presented are averages and vary significantly from one farm and region to the other. It is, therefore, crucial to input actual farm data when completing enterprise budgets for your farm.


Cost Per Acre 2023          
  Corn – No Till Corn – Conventional Soybeans Wheat Wheat/Beans
2022 $689.00 $749.00 $402.00 $490.00 $749.00
2023 $735.50 $799.57 $422.86 $537.64 $800.23
Difference $46.50 $50.57 $20.86 $47.64 $51.23
Percent Change 7% 7% 5% 10% 7%

How to Use University Enterprise Budgets: 

The enterprise budgets can be used as a baseline for your operation.  Make changes to these budgets to include your production techniques, inputs, and overall management. 

 Use this document as a start or reference to creating your crop budgets.  The budgets are available electronically in PDF or Excel online at www.extension.umd.edu/grainmarketing. Contact information is on the website if you have problems downloading any of these budgets.

2023 Custom Rate Survey Now Available for Maryland and Delaware

Financial and economic considerations such as limited capital, untimely cash flow, low labor, small acreage, or other reasons require farmers to hire custom services for field operations.

Custom work charges are determined by demand and supply and are negotiated between farmers and custom operators. The purpose of the publication is to provide information on custom work charges in Maryland and Delaware. 

Custom Work Charges

A mail survey was conducted in the fall of 2022 to determine custom works charges in Maryland and Delaware. Rates were collected from 67 custom operators and farmers and summarized for the state. Participants indicated the rates they charge for various field operations. The charges reported in this publication may serve as a guide in determining an acceptable rate for a particular job where little other information is available. The charges can also be compared with costs and returns and may be used as a basis for working out more equitable charges for both the custom operator and the customer.  These are available online at www.go.umd.edu/grainmarketing or contact your local Extension Office. 

Operation AVERAGE ’23 AVERAGE ’21 Percent Change
Field Preparation $20.21  $19.07  6%
Planting $21.87  $18.31  19%
Field Applications $14.09  $9.84  43%
Forage Production $15.17  $12.32  23%
Harvesting $73.07  $71.30  2%
Labor $42.19  $40.38  4%
Equipment Expenses $85.50  $71.23  20%
Average Total Change $38.87  $34.64  12%

*The accuracy of this survey depends on the number of realistic responses. If you would like to be added to the custom applicator list for future surveys, send your name and email/mailing address to sdill@umd.edu c/o MD Custom Rates.


2023-2024 Agronomy Guide Avalable

The 2023-2024 version of the Penn State Agronomy Guide is available at https://extension.psu.edu/agronomy-guide. This is available as a digital download for $15, printed copy for $35, or a print and digital bundle for $45. They are offering a 25% discount through March 25. Enter the code CROPS-8GS in the “apply a discount code” section at checkout.

2022 Maryland State Soybean Variety Trials

Nicole Fiorellino, Extension Agronomist | nfiorell@umd.edu
University of Maryland, College Park

The University of Maryland offers a fee-based, soybean variety performance testing program to local and national seed companies. The results from these replicated trials provide agronomic performance information about soybean varieties tested at four locations in Maryland considered representative of the state’s geography and weather conditions. Click the link below to download the full report.

Download the full report here

Evaluating Late Season Burndown Options for Palmer Amaranth

Ben Beale, Principal Agriculture Agent| bbeale@umd.edu and Alan Leslie, Agriculture Agent
University of Maryland Extension

A common question asked by farmers dealing with herbicide resistant Palmer amaranth is, “What are the most effective burndown options in situations where Palmer amaranth is larger then the ideal 3-4 inch control range?” We often encounter this scenario in fields left fallow for a year, fields with delayed planting due to saturated soils, and double crop fields following wheat. In the summer of 2022, we undertook a study evaluating eight different treatments for control of larger Palmer amaranth in Southern Maryland. The study was completed at a site with a history of Glyphosate and ALS-resistant Palmer amaranth. The field was fallowed through the spring and early summer, and mowed at a 8 inch height in mid July. At the time of herbicide applications on August 4,  Palmer amaranth was 5-8 inches tall and present at a high density. Most plants were not clipped (Figure 1). Germination of Palmer amaranth was delayed due to a heavy cover of winter annual weeds. Other weeds present at the site at the time of application included annual foxtail and perennial broomsedge. Enlist soybeans were planted on August 3rd in order to evaluate any potential phytotoxicity or herbicide injury. We evaluated treatments with Roundup, Liberty, Enlist and Gramoxone with some using a non ionic surfactant or crop oil as the adjuvant. We also evaluated combinations of Liberty + Roundup or Liberty + Enlist.

Figure 1. Palmer amaranth plants were 5- 8 inches tall at time of application.

Treatments:

  1. Glyphosate (Roundup Power Max) 32 fl oz/ac + Amm. Sulfate 48 oz/ac
  2. Paraquat (Gramoxone SL 2.0) 48 fl oz/ac + Non Ionic Surfactant 6.4 fl oz/ac
  3. Paraquat (Gramoxone SL 2.0) 48 fl oz/ac + Crop Oil 32 fl oz/ac
  4. Glufosinate (Liberty 280 SL) 43 fl oz/ac + Amm. Sulfate 48 oz/ac + Crop Oil 32 fl oz/ac
  5. Glufosinate (Liberty 280 SL) 43 fl oz/ac + Amm. Sulfate 48 oz/ac + Non Ionic Surfactant 6.4 fl oz/ac
  6. 2,4-D choline (Enlist One) 32 fl oz/ac + Non Ionic Surfactant 6.4 fl oz/ac
  7. Glufosinate (Liberty 280 SL) 43 fl oz/ac + Glyphosate (Roundup Power Max) 32 fl oz/ac + Amm. Sulfate 48 oz/ac + Non Ionic Surfactant 6.4 fl oz/ac
  8. Glufosinate (Liberty 280 SL) 43 fl oz/ac + 2,4-D choline (Enlist One) 32 fl oz/ac + Amm. Sulfate 48 oz/ac + Non Ionic Surfactant 6.4 fl oz/ac

A randomized complete block design with four replications was used. Plot size was 10 ft. by 30 ft., with 5 ft aisles separating plots and running checks on each side of the plots. Treatments were applied  using a ATV plot boom sprayer utilizing TeeJet AIXR 11003 flat fan nozzles at 35 psi applying 20 gallons per acre of spray solution. Application was made on August 4th in the mid-afternoon with clear bright sunshine and air temperature of 90°F. Plots were evaluated for percent control of Palmer amaranth and grass weeds 10, 20, and 30 days after treatment.

Results

Palmer Amaranth Control

As depicted in Figure 2, treatments containing Gramoxone either with crop oil or a non-ionic surfactant, and the tank mix treatment of Liberty and Enlist One performed well throughout the study. Liberty applied either with non-ionic surfactant or crop oil, and Liberty with Roundup only achieved around 50 % control of Palmer Amaranth. It is notable that all Liberty treatments saw reduction in the level of control as the season progressed. This was evidenced in the field by Palmer amaranth plants suckering out from the base and re-growing approximately 2 weeks after the application. We did not observe suckering with the Gramoxone treatments or Liberty + Enlist treatments. Surprisingly, Enlist One treatments did not provide acceptable control of larger Palmer Amaranth plants in this study with an average control of around 25%. Enlist One control did gradually increase after the 10 day evaluation most likely due to the systemic nature of the product. As expected, we saw negligible control of Palmer amaranth with Roundup. The evaluation 20 days after treatment provided the clearest assessment of control, with no significant difference between Gramoxone treatments or the Liberty + Enlist One treatments (Figure 3). Liberty + NIS and Liberty + Crop Oil and Liberty + Roundup were not significantly different from each other, but significantly less effective than Gramoxone or Liberty + Enlist one treatments. Enlist treatment was not significantly different than the Roundup treatment. We should also note that new Palmer amaranth seedlings began to emerge just 20 days after the burn down treatments. Palmer amaranth continues to germinate throughout the summer, especially in open areas where sunlight reaches the soil. Controlling this weed takes a season long approach.

Figure 2. Palmer amaranth control at 10, 20, and 30 days after treatment.
Figure 3. Palmer amaranth control at 20 days after treatment.

Grass Control

As depicted in Figure 4, all treatments provided a satisfactory level of grass control. While Roundup didn’t have any efficacy on resistant Palmer amaranth, the enduring  benefit of this product can clearly be seen in control of other tough weeds, such as grasses with 100% control in our study. We saw no reduction in control of the grasses present when Roundup was tank mixed with Liberty. The Gramoxone +NIS treatment had slightly lower grass control at 84%, and was significantly lower than Roundup treatments. Enlist only has activity on broadleaf and was omitted in the analysis for grass control. An interesting question for further study is the potential efficacy of Gramoxone + Roundup treatments.

Figure 4. Grass control in soybean plots.