Researchers at the University of Maryland are inviting growers across the state to participate in their University of Maryland – Testing Ag Performance Solutions (UMD-TAPS) program this year. The program is supported by the Maryland Soybean Board and will run throughout the summer.
Piloted at the University of Nebraska-Lincoln, the TAPS program provides farmers with a zero-risk opportunity to advance their agricultural management skills and knowledge. It serves as a growing season contest and research framework, designed to uncover how producers’ management decisions drive crop yields, farm profitability, and input-use efficiency.
Growers must make decisions about variety selection, fertility, pest management, and irrigation and their management decisions will be executed in small plots at the Wye Research and Education Center. Decisions made by all participants will be executed in one field, in a true head-to-head competition. The goal is to identify which suite of management decisions will become the most profitable, efficient, and highest yielding.
Researchers at the Maryland Agricultural Experimentation Station (MAES) WYE Research and Education Center will lead the program and gather data on each plot to share with farmers.
When the season ends, growers will participate in an awards dinner where they will gain access to valuable data sets to help them enhance their agricultural operations.
The irrigated corn competition is limited to 20 teams and the irrigated soybean competition is limited to 15 teams. Due to limited availability, researchers urge teams to sign up as soon as possible.
Interested applicants can sign up by following this link: bit.ly/UMDTAPS25. For any questions, please reach out to Dr. Nicole Fiorellino at nfiorell@umd.edu.
Farmers and crop consultants are encouraged to complete this survey
This survey is intended to estimate the impact of pests on soybeans and currently used management strategies. Your perspective is valuable in making these estimates as accurate as possible. Your responses will be kept confidential and only aggregated responses for the state will be published. You can find last year’s estimates at https://midsouthentomologist.org.msstate.edu/Volume17/Vol-17-1_TOC.html.
Nicole Fiorellino | nfiorell@umd.edu Assistant Professor & Extension Specialist, Agronomy
The 2024 Maryland Corn Hybrid Trials results can be found at https://psla.umd.edu/extension/md-crops or downloaded at the link below. Many thanks to Louis Thorne, Gene Hahn, and Audrey Sultenfuss for their time spent preparing, establishing, collecting data, and preparing the report. These trials could not be completed without them. I greatly appreciate the Center managers and personnel who assist our team with executing these trials.
We are grateful for the funding provided by Maryland Grain Producers Utilization Board to support these trials. MGPUB provides our program with checkoff funding to support applied agricultural research and so we may generate results that directly benefit Maryland producers.
Andrew Kness, Senior Agriculture Agent | akness@umd.edu University of Maryland Extension, Harford County
Figure 1. Map of tar spot of corn for 2024 growing season as of September 5.
Our first official reports of tar spot have been confirmed in Maryland for 2024; almost exactly on pace for when we first detected tar spot in 2023 and 2022. The first report came from a dent corn field in Baltimore County on August 22 and subsequent reports were made from fields in Harford County on August 27 and September 4. All of these fields are near black layer and yield loss due to tar spot infection is not likely unless infection occurred earlier in grain fill or during pollination. It is not likely that we had tar spot infections occurring in July due to the extreme heat this year. Tar spot infections require lower temperatures than other common fungal diseases of corn such as gray leaf spot.
As average daily temperatures begin to dip into the mid 70s and mid 60s, tar spot symptoms will likely start to flare up in corn. Tar spot can spread as long as there is green tissue on the plant, which means symptoms can worsen even past black layer, making for a field that could look far worse than it actually is. For reference, last fall I did yield checks in two corn fields and one research plot that had fairly moderate levels of tar spot infection (Figure 2) but still yielded very well (220-300 bu/a), with the field with the worst symptoms topping 300 bushels. What likely happened is tar spot infected corn close to R5-R6 and it continued to spread after black layer since the plants stayed green beyond physiological maturity due to the stay green effect of foliar fungicides that were applied to these fields. Even though tar spot spores can blow short distances in the wind, if you are harvesting a field infected with tar spot, it would be a good practice to try to clean as much corn fodder off of equipment prior to moving to a new farm; a blower or air compressor will do the trick.
Figure 2. Tar spot symptoms on a senesced corn leaf.
As you are scouting your corn fields, be on the lookout for tar spot. With funding from the Maryland Grain Producers Utilization Board, we are conducting a survey of the distribution of tar spot in Maryland. If you have tar spot, or think you might, please report it to corn.ipmpipe.org or reach out to me at akness@umd.edu or (410) 638-3255. Reports are kept anonymous and individuals and/or farms are not identified in any reports, publications, or communications.
Andrew Kness, Senior Agriculture Agent | akness@umd.edu University of Maryland Extension, Harford County
Stalk rot (left) and ear rot (right) of corn.
With the dry then wet (then dry again) weather pattern we had this year, corn went through a lot of stress. Stressed corn is much more susceptible to ear rots and stalk rots. The degree of severity is dependent on a variety of factors, so it is wise to scout fields prior to harvesting in order to identify problematic fields and give them harvest priority.
Several different pathogens can cause ear rots in Maryland; the main contenders are listed in the table below. Although they typically do not affect yield, they can cause grain quality issues through the production of mycotoxins. Furthermore, if infected grain is not dried quickly or to a low enough moisture content, infection can spread, even when in the bin. Therefore, it is important to scout and identify fields that are infected with ear rots and harvest those first. It is better to pay a few cents in propane to dry the wet grain than to wait and risk infection levels getting worse, and the potential for elevated mycotoxin concentration in the grain. Quickly dry infected grain to 15% for short-term storage and to below 13% for long term storage and it is not recommended to store infected grain for longer than a year. It is important to note that not all ear rotting fungi produce mycotoxins, so I would recommend working with your Extension agent or crop advisor to get proper identification so that you know the species in question and thus if mycotoxin contamination is a concern.
Table 1. Common ear rots of corn.
Disease
Pathogen
Symptoms (see next page for pictures)
Mycotoxin
Fusarium ear rot
Fusarium verticillioides
“Starburst” kernels, white kernels, infected kernels may be scattered on ear
Fumosin
Gibberella ear rot
Fusarium graminearum
Ear covered in white mat often with pink hue, infection starts at tip and can progress to butt end of ear
Vomitoxin (DON)
Diplodia ear rot
Stenocarpella maydis and S. macrospora
White fungal mat on ear, may cover the entire ear
None
Penicillium ear rot
Several Penicillium species
Blue-grey spores on kernels developing on damaged ears (hail, deer feeding, insects, birds, etc.), may infect the germ of the kernel
Some species may produce mycotoxins
Trichoderma ear rot
Trichoderma viride
Green spores in between kernels
None
Aspergillus ear rot
Aspergillus flavus
Olive green spores on ear, usually starting at tip, associated with damaged ears (feeding from insects, deer, birds, etc.)
Aflatoxin
Stalk rots are also a harvest concern. Like ear rots, stalk rots are also caused by many different pathogens, several of which are listed in Table 2 below. No single factor causes stalk rots; they are rather the end result of a host of factors that contribute to a net deficit in plant carbohydrates needed for grain fill. The grain fill process is a major carbohydrate sink for the plant. As the plant produces carbohydrates through photosynthesis, it allocates almost all of it’s carbohydrate production to filling the kernels. A healthy plant will have sufficient leaf area to maximize photosynthesis and can therefore produce enough carbohydrates to fill the grain. However, when photosynthetic leaf area is compromised, the plant cannot make enough food to fill the kernels. In order to compensate for the deficit, the plant cannibalizes carbohydrates from existing tissues. The first tissues to go are the stalks, which are then easily compromised by stalk-rotting pathogens. Stalk rot is a byproduct of stressed plants during the growing season, particularly during grain fill.
Table 2. Common stalk rots of corn.
Disease
Pathogen
Anthracnose stalk rot
Colletotrichum graminicola
Diplodia stalk rot
Stenocarpella maydis
Charcoal rot
Macrophpmina phaseolina
Gibberella stalk rot
Fusarium graminearum
Fusarium stalk rot
Multiple Fusarium species
Any factor that reduces leaf area or reduces photosynthesis after pollination will predispose plants to stalk rots. These include reduced leaf area through insect feeding, lesions from foliar diseases, or mechanical damage (such as hail). Other factors include inadequate fertility, water stress, and excessive plant populations. Another significant factor is hybrid genetics; both resistance ratings to stalk rotting pathogens as well as ear and kernel size. High-yielding, large kernel hybrids are more susceptible to stalk rots if they are not kept healthy through grain fill.
Scout fields for stalk rots as early as black layer. The “pinch test” is one way to scout for stalk rots. Pinch the stalk in between the nodes at one of the lower two nodes. You should not be able to pinch healthy stalks, but rotted stalks will fairly easily collapse. Do this at several random locations to assess the field. Alternatively, you can do a “push test,” which involves pushing the corn stalks approximately 30 degrees from horizontal (8 inches laterally) at a height of about eye level. Healthy stalks will return to vertical while infected plants will not. If more than 10% of plants tested exhibit stalk rot symptoms, you may want to harvest as soon as possible or risk a not-so-fun harvest of lodged corn.
Nicole Fiorellino, Assistant Professor & Extension Agronomist | nfiorell@umd.edu University of Maryland, College Park
With the recent dry weather, some corn sidedress applications have been delayed past the optimum application window, causing farmers to think about the necessity of a “late” sidedress application. Let’s discuss corn growth stages and nitrogen (N) utilization in the plant and summarize research findings of yield response to “late” sidedress applications. This information can be useful for farmers to decide how to make decisions based on profitability, which sometimes may mean foregoing a late application which may result in decreased yields.
What is the “short stave”?
I often quote Liebig’s Law of Minimum and the visual analogy of a barrel made of wooden staves to represent agronomic management decisions, specifically fertility decisions. The first step to correcting a growth problem, be it fertility or otherwise, is identifying the problem that must be corrected – determining the “short stave” of the barrel limiting its capacity. While the gut reaction to stunted corn that missed a sidedress application may be a N deficiency, the “short stave” could be dry soils. I have seen corn that visually improved this week just due to precipitation. If you have heavier soils, good organic matter, maybe used manure, your corn may improve as the soil is rewetted and some N in the soil makes its way to the plant, eliminating the need for a trip across the field. Further, a rushed N application without precipitation in the forecast is not useful, as the N will not reach the plant roots with water as its vehicle.
Defining a “late” application
Each farmer may have a different definition of “late” sidedress application, so we should clarify this term and translate it to corn growth stages. Corn sidedress application is recommended between V4 and V6, to provide N to the corn as it enters a rapid uptake phase through the rest of the vegetative growth stage, as depicted in Figure 1. As the plant tassels and enters reproductive growth, the plant shifts from soil N uptake to translocation of N stored within plant tissues to the grain [1]. Thus, VT is the “turning point”, where a sidedress application between V6 and VT could be characterized as “late” but one might categorize any application after R1 as “the point of no return.” Confirming the growth stage of your corn is an important point to consider when weighing the possibility of a late sidedress application.
Figure 1. Nitrogen utilization of corn crop by plant tissue across the growing season. Source: Iowa State University Extension.
Risks of a late sidedress
Beyond missing the optimum window of utilization of applied N by the corn plant, there are other risks to consider when weighing a late application. Taller corn with more canopy coverage runs the risk of physical damage to the corn as application equipment moves through the field. There is the risk of leaf burn with foliar product applied, although the use of drop nozzles could help minimize this. Moreover, the delayed application of N may have stressed the corn in the early growth stages, already decreasing your corn’s yield potential. This means that even with perfect conditions and unlimited nutrients moving forward in the growing season, the yield “ceiling” has already been lowered. So, the cost of an additional N application will not be realized in profit (increased yield) and the most profitable decision may to forego applying more nitrogen. Finally, no farmer wants to risk making an N application when there is potential for loss to the atmosphere or to nearby surface water. Including potential off-site losses of applied N not utilized by the crop into the decision-making process may help make a late application decision more clear.
Yield impacts with late sidedress – pre-tassel
Yield benefits with sidedress through late vegetative growth compared to no application has been observed in other areas of the country; with researchers at Purdue University demonstrating sidedress at V15 and even up to R1 showed improved corn yield compared to no sidedress application, but still significantly less than corn sidedressed at V4 or V6 [2,3]. Research performed at Ohio State demonstrated an N application up to V10 minimized yield loss [4] and results from Cornell indicated significantly decreased corn yield with sidedress at V10 compared to sidedress at V4, V6, or V8 but significantly better than corn yield with no sidedress application [5]. In Minnesota, where the growing season is shorter, a sidedress application at V12 did not result in increased corn yield compared to no sidedress or sidedress prior to V8, with the researcher attributing this to compromised yield potential from early season N deficiency [6]. While these data are not local, they illustrate the potential for rescuing a corn crop from total loss with a sidedress application while the corn is still in the vegetative growth stage.
Yield impacts with late sidedress – post-tassel
Limited research findings exist to evaluate corn yield response to N application post-tassel [7]. There is a potential for rescue with a post-tassel sidedress application where severe N deficiency is observed, but this decision should be balanced with the potential return [6]. The lack of research findings of a post-tassel sidedress application should indicate this practice may not be recommended to optimize corn yield, farmer profitability, or environmental benefits.
Conclusions
Multiple factors should be considered when weighing a late sidedress application, first, determining the “short stave” and considering it could be drought, not N deficiency, and second, confirming the growth stage of the corn. While there are risks associated with late sidedress application, namely physical damage to corn with application equipment or increased potential for N loss off-site, data support sidedress application up to the end of vegetative growth can result in corn yield between optimum sidedress application and no sidedress application. There is no research to support yield benefits with sidedress applications post-tassel. Farmers should understand that early season N deficiency may have limited corn’s yield potential and consider this point when making profitable, late season sidedress decisions.
Andrew Kness, Senior Agriculture Agent | akness@umd.edu
University of Maryland Extension, Harford County
Tar spot is on the mind of many farmers as we enter the 2024 growing season and I have had many conversations with farmers and consultants about strategies for managing this disease. Here are some things to consider and keep in mind as we get into the peak of the corn growing season.
Tar spot is a disease of corn caused by the fungus Phyllachora maydis. This disease was first reported in limited amounts in Harford and Cecil County in 2022; in 2023 the disease spread to at least 8 counties in Maryland and by harvest ‘23, we found tar spot at a frequency of over 50% of fields scouted here in Harford County.
The tar spot disease cycle starts with old corn crop residue where the fungal spores lay dormant over winter. As conditions become optimal for its development in late spring/summer, spores are released and blown and/or splashed onto corn plants where the spore will germinate and infect the plant. Approximately 12-15 days after infection, symptoms will develop on the corn leaves and/or husks, which include dark, raised, lesions, which are the reproductive structures called stromata (Fig. 1). Inside the stromata are spores (Fig. 2), which are released and will infect new tissue. Tar spot is a polycyclic disease, meaning it has multiple generations or cycles per year. New infections will occur throughout the growing season for as long as green, living corn tissue is present and environmental conditions are favorable.
Figure 1. Tar spot stromata (raised black specks) on corn leaf.
Figure 2. Microscope image of P. maydis ascus containing ascospores, which are blown and splashed to infect new corn tissue. Image: A. Kness, UMD.
Here in Maryland and the Mid-Atlantic, tar spot has not been reported to cause any significant epidemics or yield losses thus far, mostly because it becomes established late in the growing season; but that is not to say that serious epidemics couldn’t happen. In the Midwest, tar spot has been reported to cause upwards of 50 bushel per acre yield loss, and it was ranked the #1 yield-limiting disease for corn in the U.S. in 2021, 2022, and 2023.
Since tar spot was first confirmed in the United States in 2015, we have learned a lot about its epidemiology. Tar spot hails from the cooler mountain areas of Latin America. When tar spot first moved into the U.S., we had initially thought that mild temperatures and moisture were key variables in the development of the disease; however, recent research has found that moisture plays a role, but temperature is far more crucial. Webster et. al. (2023) found that monthly temperature average between 64-73°F were optimal for tar spot development and temperatures exceeding 73°F significantly reduced tar spot progression. What was more interesting is that they found that moisture both promoted and inhibited tar spot disease progression. Moisture early in the disease cycle aids in infection, but prolonged moisture (greater than 90% humidity) actually inhibits disease progression. Tar spot develops when relative humidity is less than 90% for a 2-3 week period, coupled with mild temperatures. This makes sense for many that may have observed tar spot in 2023, which was not a particularly wet year.
With this in mind, we should consider how these weather parameters influence our management of this disease here in Maryland where our summers tend to be hotter and more humid than many areas of the corn belt states.
If you look at the 5-year average monthly temperatures from regional weather stations (Table 1), you can see that the months of July and August for Mid-Atlantic regions are well outside of the 64-73°F window for optimum tar spot development. Compare that with data from Iowa for example, and they consistently run within or very close to the optimal temperature range. While only a few degrees may not seem like much, I believe our hot summers may actually keep tar spot at bay until later in August and September on an average year, which would be consistent with when we have found tar spot in Maryland in 2022 and ‘23. If these trends hold true, the majority of our corn crop is well into later grain fill stages by the time milder temperatures arrive, effectively avoiding tar spot development during the most crucial growth stages. In contrast, 30-day average temperatures are within or near the 64-73°F optimum range during corn’s most vulnerable growth stages in the corn belt.
Table 1. Average Monthly Temperatures (°F), 2019-2023
Westminster, MD
Salisbury, MD
Arlington, VA
Waterloo, IA
May
63.46
64.08
66.13
60.70
June
72.48
72.95
75.53
72.90
July
79.54
77.99
80.96
75.52
August
77.22
76.25
78.77
72.00
September
69.94
69.99
72.60
66.20
Where tar spot could become problematic here are instances where we have an unusually cool June and July which would put the majority of our corn at risk of tar spot infection during it’s most vulnerable time, which is tasseling through early to mid grain full.
Another situation where tar spot could be a problem is for late planted and late maturing hybrids that are in reproductive phases in August and September. Fields that are corn after corn are also in a higher risk situation.
For 2024, I would highly recommend scouting and paying close attention to the weather conditions just prior to tasseling through grain fill in your corn fields. There is an app that can help you determine your tar spot risk, called Tarspotter, and has been reported to be 90% accurate. The app takes into consideration regional weather data and field management to determine a risk percentage. It’s available for download for free on iPhone and Android.
If you decide to treat your corn with a fungicide to manage tar spot, VT/R1 timing is still found to be the most effective and economical. A fungicide application at this time will also effectively manage other common foliar fungal diseases of corn (which we shouldn’t forget about), such as grey leaf spot and northern corn leaf blight. Most fungicides labeled for tar spot are effective, however there is a better response to products that have 2 and 3-way modes of action.
This year we will continue to conduct research on tar spot in Maryland with funds from the Maryland Grain Producers Utilization Board. If you find tar spot this year, please report your findings to me via email (akness@umd.edu) or phone (410-638-3255) or on corn.ipmpipe.org.
Nicole Fiorellino, Extension Agronomist | nfiorell@umd.edu University of Maryland, College Park
Have you thought about how you might incorporate newly-available biological products into your operation? Maybe you are interested, but skeptical about the return on investment? I will briefly define “biologicals” then provide my thoughts on how to navigate the old adage, “to use or not to use.” I operationally define biological products as commercially-available amendments that are adding a living organism to your growing system, either to the soil or directly to the plant. Generally, these products are meant to replace a fertilizer application by unlocking nutrients stored in the soil or amplifying natural processes that harness nutrients, namely nitrogen (N), from the atmosphere. While a variety of products from different brands can be broadly categorized as biologicals, it is important to take the time to understand the specific “mode of action” of individual biological products and compare that to your field conditions as a first step towards deciding if you will use a product.
Most biological N products aim to increase the mineralization of organic N stored in your soil to inorganic forms that are plant available. The mineralization step of the N cycle is mediated by microorganisms that spend energy to digest organic N and transform it to inorganic, plant-available N. When there is ample inorganic N present in the soil, like after a fertilizer application, for example, the microorganisms are “signaled” that ample N is present and they conserve energy by slowing down, or even stopping, mineralizing organic N. So biological products aim to “block” the signal to microorganisms that instructs them to cut off mineralization and they signal microorganisms to increase the organic N that is mineralized; hence adding more N to the soil with additional fertilizer application.
The increased availability of the soil storage of organic N or the provision of N to plants without fertilizer is accomplished through the introduction of novel N-fixing bacteria that allow a cereal crop, like corn, to fix N like a legume; by providing a stimulant to native soil bacteria to kick-start mineralization; or by infecting the corn plant with an N-fixing bacteria that fixes N from the atmosphere with no additional available N present in the soil – each of these examples represents the mode of action of a different biological product. While it seems like these products have the potential to supply nearly unlimited amounts of N to your crops, they should be viewed as fertilizer replacements, not necessarily as bonus N on top of your current fertility plan. Moreover, despite some marketing claims that yield benefits would be observed across all acres of a farm, a farmer might be more likely to observe a yield response where fertility is low, maybe on marginal acres where fertilizer applications or field operations are delayed due to logistics and timing. Finally, beyond the cost per acre of the product itself, you may want to consider the ease of use of the product and the cost in time associated with product use, including restrictions on tank mixing, application timing, and extra trips across the field.
Once your head is spinning from those considerations and you think you may want to try a new product, your next step may be to see out local research data on a product’s efficacy or maybe even check with your neighbor to learn about their experience with the product. The specific nature of the individual biological products and their interaction with soil nutrient concentration means that University data or even data from your neighbor may not represent the results you might expect on your farm. Unlike the universally-expected yield response with increased fertilizer application across the spectrum of soil and environmental conditions, the potential yield response to the use of biological products varies greatly with location, soil type, and weather conditions – meaning in the same location across multiple years, there may be a different response to the use of these products.
We recommend performing trials on your farm to aid your decision to use biological products. A first step to determine a yield response will be to understand how efficiently you are using N fertilizer on your field. This can be accomplished with a simple field-length strip plot protocol using multiple N fertilizer rates and up to two biological products of your choice. The Agronomy Program at University of Maryland has launched an On-Farm Trials program, with funding support from the Maryland Grain Producers Utilization Board. We encourage farmers to sign up to participate in the trials, one protocol is a biological product comparison. As we enter our second field season in 2024, more information for how to sign up for the trials and brief results summary from 2023 can be found at https://bit.ly/UMDOnFarmTrials or you can email Dr. Nicole Fiorellino at nfiorell@umd.edu or Mr. Gene Hahn at ghahn@umd.edu for more information. We offer a payment to offset potential yield loss and to compensate you for your time spent working with our team to execute the trials. If you have not planted corn yet, there is still time to sign up! Check back to the November research summary issue of Agronomy News for 2024 Field Trials results.
Mark Townsend, Agriculture Agent Associate | mtownsen@umd.edu University of Maryland Extension, Frederick County
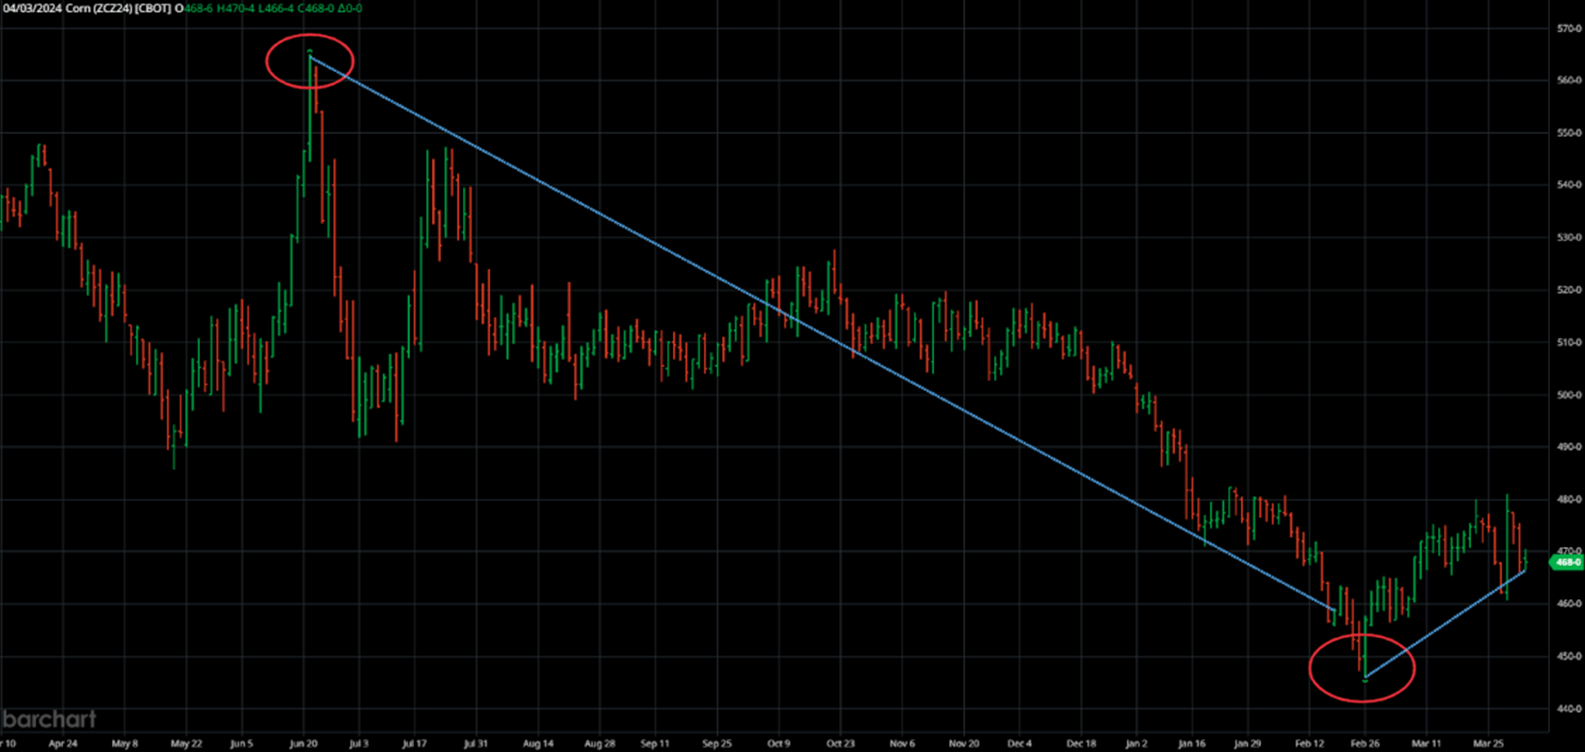
Grain markets have slid significantly from the highs posted last summer that followed the perceived drought in the Midwest.
Image Credit: Barchart: December ‘24 Corn Contract from June 2023 to April 3, 2024.
Unfortunately, these drought concerns were generally unfounded as key growing areas received timely rains to keep yields from suffering in the corn belt. In fact, the U.S. set a new corn production record at 15.234 billion bushels topping the previous record set in 2016 at 15.148 billion bushels. The trifecta of a record large U.S. crop, a large Brazilian corn crop, as well as underwhelming domestic and export demand sent prices spiraling lower from August 2023 to February 2024. The March ‘24 Corn contract traded at three-year lows on February 26th dipping below $4 following 11 consecutive week-over-week price declines.
Soybeans were unfortunately no better, falling $2.90 from their summer high ($14.18) to their low ($11.28) in the March ‘24 contract. Much of the same stories plagued this market including an unrealized weather rally and outstandingly large South American production that punished U.S. export demand.
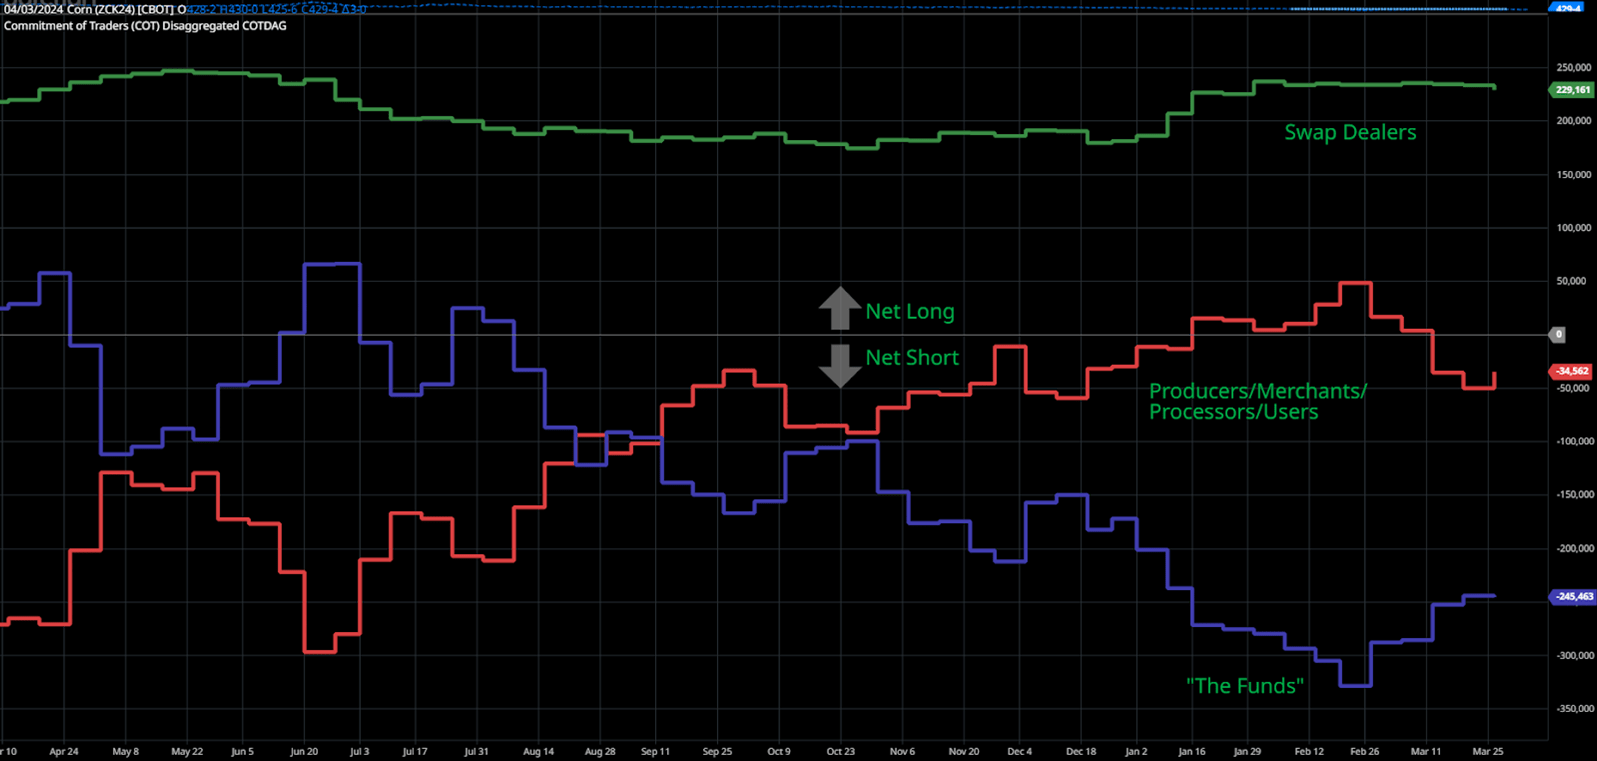
To add insult to injury, “the Funds”—traders in the market who manage money for clients as either hedges or other investment strategies hit a record 340,732 net short position in the corn market on February 20th. Simply stated, these traders placed the largest-ever bet on corn prices continuing to decline, which has placed a metaphorical wet-blanket on any hopes of a rally.
Today
Grains have rallied from the end of February and throughout March. The inflection point was the last day of notice for March hedge-to-arrive (HTA) contracts. To that point, sellers (farmers, dealers, etc.) had the choice of pricing corn at current prices or “rolling” the contract to the May contract. The bleak outlook forced many hands and stimulated selling which pulled prices lower until the selling pressure was over.
Since then, both the corn and soybean markets have rallied off the lows and recovered to price levels previously seen in early February. The upward momentum has been driven by a phenomenon known as “short covering” that creates a positive feedback loop–the more it happens, the more it happens. As prices rise, “The Funds” in their net short position lose money as their bet has turned against them. To stop this, they must exit their position by buying a contract to offset the one they previously sold1. The buying stimulates further price increases that induce another fund manager having to offset their short position. At its extreme, this feedback loop can throw prices to astronomical levels2. In this case, the bump is a welcomed change but is unlikely to send us much higher for now.
More recently, the USDA released its Prospective Plantings Report compiled from surveys asking farmers their planting intentions this season. The report suggests growers will plant 90 million acres of corn and 86 million acres of soybeans, indicating that growers are shifting acres away from corn to soybeans. This was unsurprising, however traders found this as good news as the nearby contracts in both markets traded higher the day of the report. However, traders are generally wary of this recent report given the low farmer response rate and the tendency for acreage figures to climb with subsequent USDA planting reports.
Season Outlook:
The saying, “all models are wrong, but some are useful” may hold true for commodity market predictions as well; there is a significant degree of uncertainty in any market that can render any forecast absolutely incorrect. As such, this is not meant to be a forecast but more of an observation of trends and conditions that may prove useful.
Supply and Demand Fundamentals
Image Credit: Barchart. CFTC Commitment of Traders in the Corn Market (all contracts).
Every market most fundamentally relies on the interplay between supply and demand. Currently in the grains, supply has outstripped demand. Following last year’s record crop, U.S. corn supply is almost burdensome.
A common metric that evaluates how efficiently we use the crop we grow is the Ending Stocks-to-Use (S/U) ratio derived from the USDA World Agricultural Supply and Demand Estimate (WASDE) each month. Currently, the USDA projects the 2024/25 ending stocks (that which we will not use from the crop we’re about to plant) at 2.53 billion bushels and an S/U ratio of 17.2%–a level we have not seen since the 2006 when corn traded at an average price of $2.62/bu. This current 2023/24 marketing year (ending Sept. 1, 2024) is currently pegged at 14.9% S/U ratio–well higher than the 7-10% range of the last three years and the 12.6% historical average.
The soybean side of things is only marginally better and certainly not rosy by any stretch. The current S/U ratio projection for this year’s crop is 9.9% with the current marketing year sitting at 7.6%. Both these figures are a far cry from the burdensome supplies we accrued during the 2018-2019 trade war with China (22.9% S/U) yet they signal a surplus of soybeans.
Market Movers
With the current fundamentals dreary at best, it’s pleasant to think of those things that could actually help prices higher.
Midwestern drought conditions continue to worsen throughout the growing season. US weather conditions are a significant driver of price action in the growing season–as exemplified by last year. Currently, some of the Midwest is experiencing a moderate drought, with some agronomists questioning the subsoil moisture levels before planting. Importantly, drought conditions would have to persist throughout the growing season well past planting. Generally, drought is bearish to corn in April and May as Midwest growers can plant at a breakneck pace just in time for timely rains that pull yields higher and prices lower. As evidenced by last year, corn did not rally until late-May over weather concerns and in 2012, corn did not rally until mid-June. Both these years indicate that prices will likely stay mixed until real concern over crop condition emerges during the growing season.
The South American (Brazil + Argentina) soybean production is lower than expected, improving export demand for U.S. soybeans. Soybean harvest in Brazil is nearing completion, however final production estimates remain volatile. The same is true with South American corn production: a supply-side shock could support U.S. corn prices. Brazil has completed corn planting this last week of its large safrinha corn crop. Currently, much of the key corn growing regions are in a minor drought or have experiences greater than normal rainfall. More serious and persistent crop-damaging weather events could certainly be a boon to the U.S. market.
Recently, the Federal Reserve signaled that it will likely keep the Federal Funds rate higher for longer–increasing borrowing costs. If this holds true, investors may find themselves less attracted to debt and equity markets as companies may have a more difficult time generating earnings. Instead, investors may revert back to commodities–a market often seen as a hedge against inflation–as they did in 2022. As mentioned above, this may trigger a significant unwinding of short positions which could carry the market to higher prices. Unfortunately, this is likely the most unlikely scenario for increasing commodity prices as equities soar to all time highs in recent weeks.
So What Can We Do About It?
Marketing grain in 2024 will likely be challenging on all fronts. Put another way, given the current outlook, it is incredibly unlikely that selling grain in the fall at harvest prices will be a winning strategy. Similarly, it’s unlikely that an unhedged, unpriced JFM ‘25 sale will offer anything better as there are additional storage costs involved. That said, developing a preharvest marketing strategy may very well be a key to success this marketing season. Betting on the aforementioned weather stories is hardly a marketing plan.
Like every year the first step is knowing your cost of production inside and out. Marketing opportunities will present themselves, but it will take knowing what is and what is not a good price. With today’s relatively high input costs, “yielding your way out” of low prices is more challenging than previous years. Therefore it may be more crucial than ever to make judicious agronomic decisions.
Take advantage of seasonal market patterns. Generally speaking, we see 3-6% increase in corn and soybean prices between mid-March and late-May from their post-harvest lows in January. As old crop marketing wanes, and concerns over the current year’s crop emerges (like the weather), prices rise slowly during this time. It may be best to price some grain sooner rather than later to take advantage of this general trend. Put it more directly; from May 1st to October 1st, corn prices fall more than $0.30, 74% of the time. Would you bet on something weighted 75% against you?
Track local basis. Generally, basis tends to follow broader market conditions especially when it comes to spreads between nearby and more distant contracts. Seasonal trends in basis also exist with harvest often being the low point and spring generally higher.
Keep a watchful eye on the markets this season. It may be such that prices are favorable for a day or two before they fall back lower.
Please also consider attending a University of Maryland Extension grain marketing meeting. These meetings are filled with all the above strategies, general information, and more that could help you with your marketing decisions.
Best of luck to you all. Here’s to blue skies and high prices!
Shannon Dill, Principal Agriculture Agent | sdill@umd.edu University of Maryland Extension, Talbot County
The University of Maryland Extension has updated www.go.umd.edu/grainmarketing site with new input data and spray programs for the 2024 field crop budgets.
Crop Budgets
Cost of production is very important when making decisions related to your farm enterprise and grain marketing. Preliminary surveys from 2024 UME Winter Crop Production meetings report 66% of farmers believe input costs are the greatest challenges facing their farm operation. Enterprise budgets provide valuable information regarding individual enterprises on the farm. This tool enables farm managers to make decisions regarding enterprises and plan for the coming production year. An enterprise budget uses farm revenue, variable cost, fixed cost, and net income to provide a clear picture of the financial health of each farm enterprise.
The 2024 Maryland enterprise budgets were developed using average yields and estimated input costs based on producer and farm supplier data. Fertilizer prices, pesticide availability, and fuel expenses have fluctuated greatly. The figures presented are averages and vary greatly from one farm and region to the other. It is, therefore, crucial to input actual farm data when completing enterprise budgets for your farm.
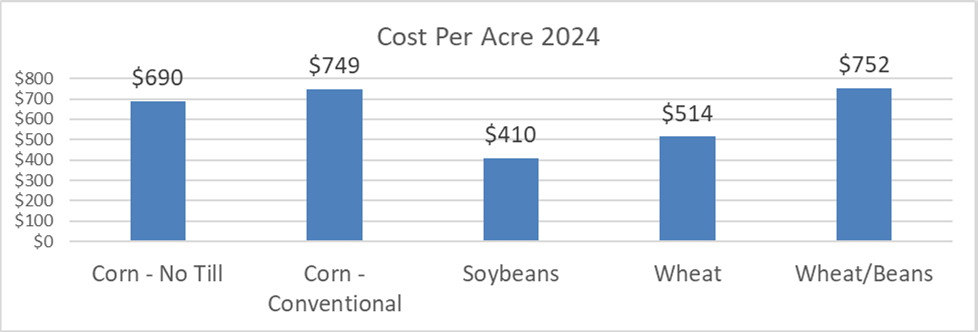
Cost Per Acre, 2024
Year
Corn
No Till
Corn
Conventional
Soybeans
Wheat
Wheat/Beans
2021
$540
$592
$346
$401
$608
2023
$736
$800
$423
$538
$800
2024
$690
$749
$410
$514
$752
Difference 23-24
-$46
-$51
-$13
-$24
-$48
Percent Change
-6%
-6%
-3%
-4%
-6%
How to Use University Enterprise Budgets
The enterprise budgets can be used as a baseline for your operation, and you can change these budgets to include your production techniques, inputs, and overall management. The budgets are available electronically in PDF or Excel. Use this document as a start or reference to create your crop budgets. Contact information is on the website if you have problems downloading any information.
2024 Crop Summary
Cost per acre expenses for 2024 have decreased a small amount from 2023 record highs. Based on estimates received cost of production includes: corn no-till costs $690 per acre, corn conventional $749 per acre, soybeans $410 per acre and wheat $514 per acre. While these are slightly (3-6%) lower than 2023 they are still 16%-22% higher than prices just 3 years ago (2021).