February 2022 Grain Market Report

Dale Johnson, Farm Management Specialist
University of Maryland

Information from USDA WASDE report

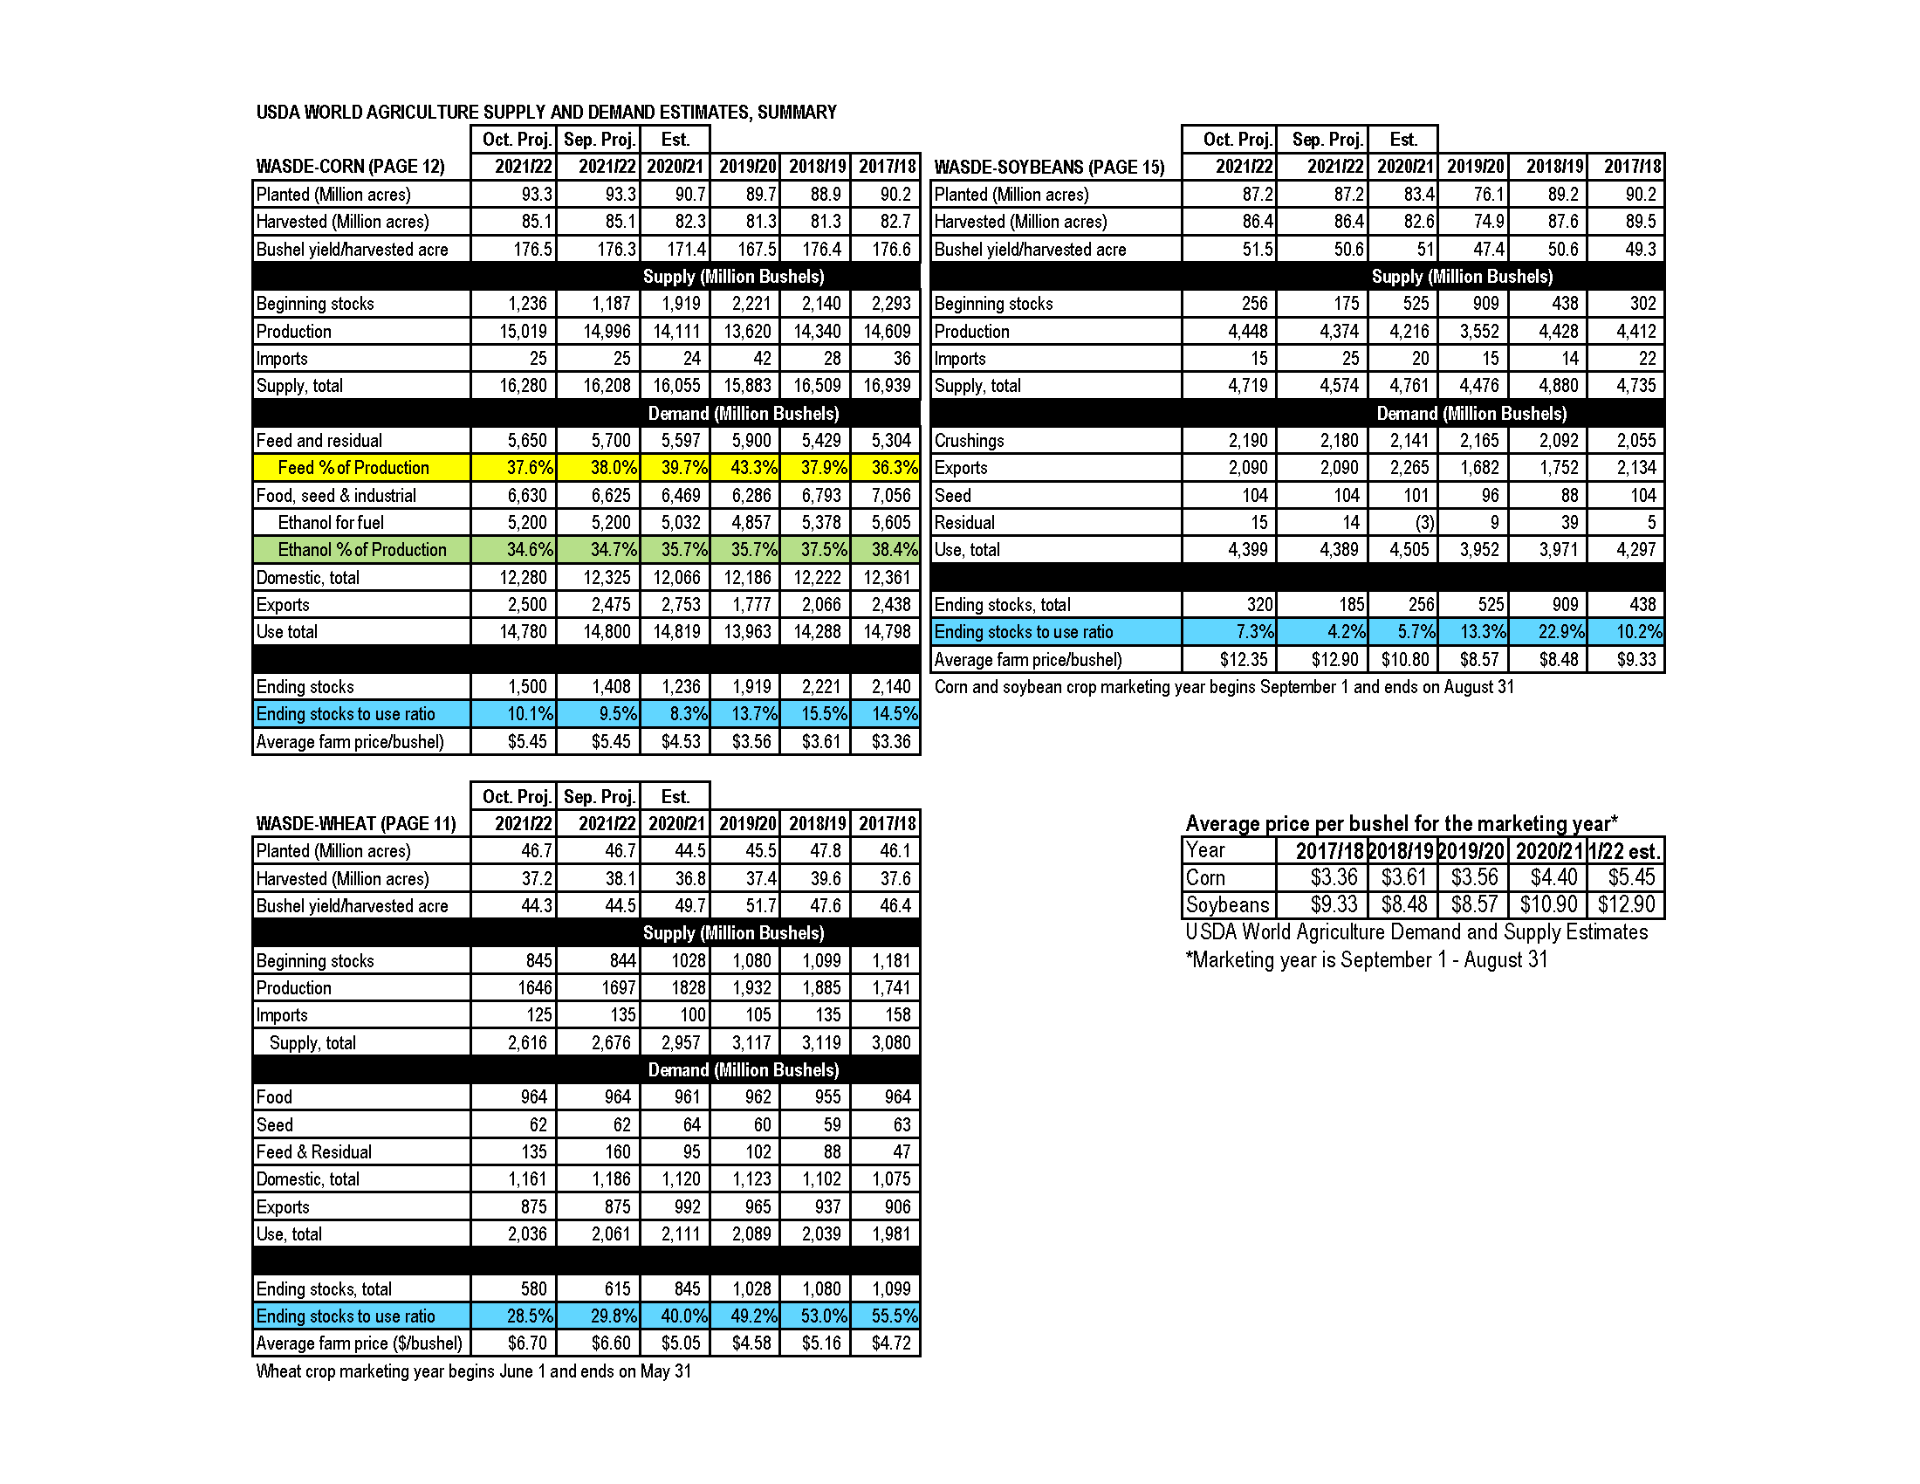
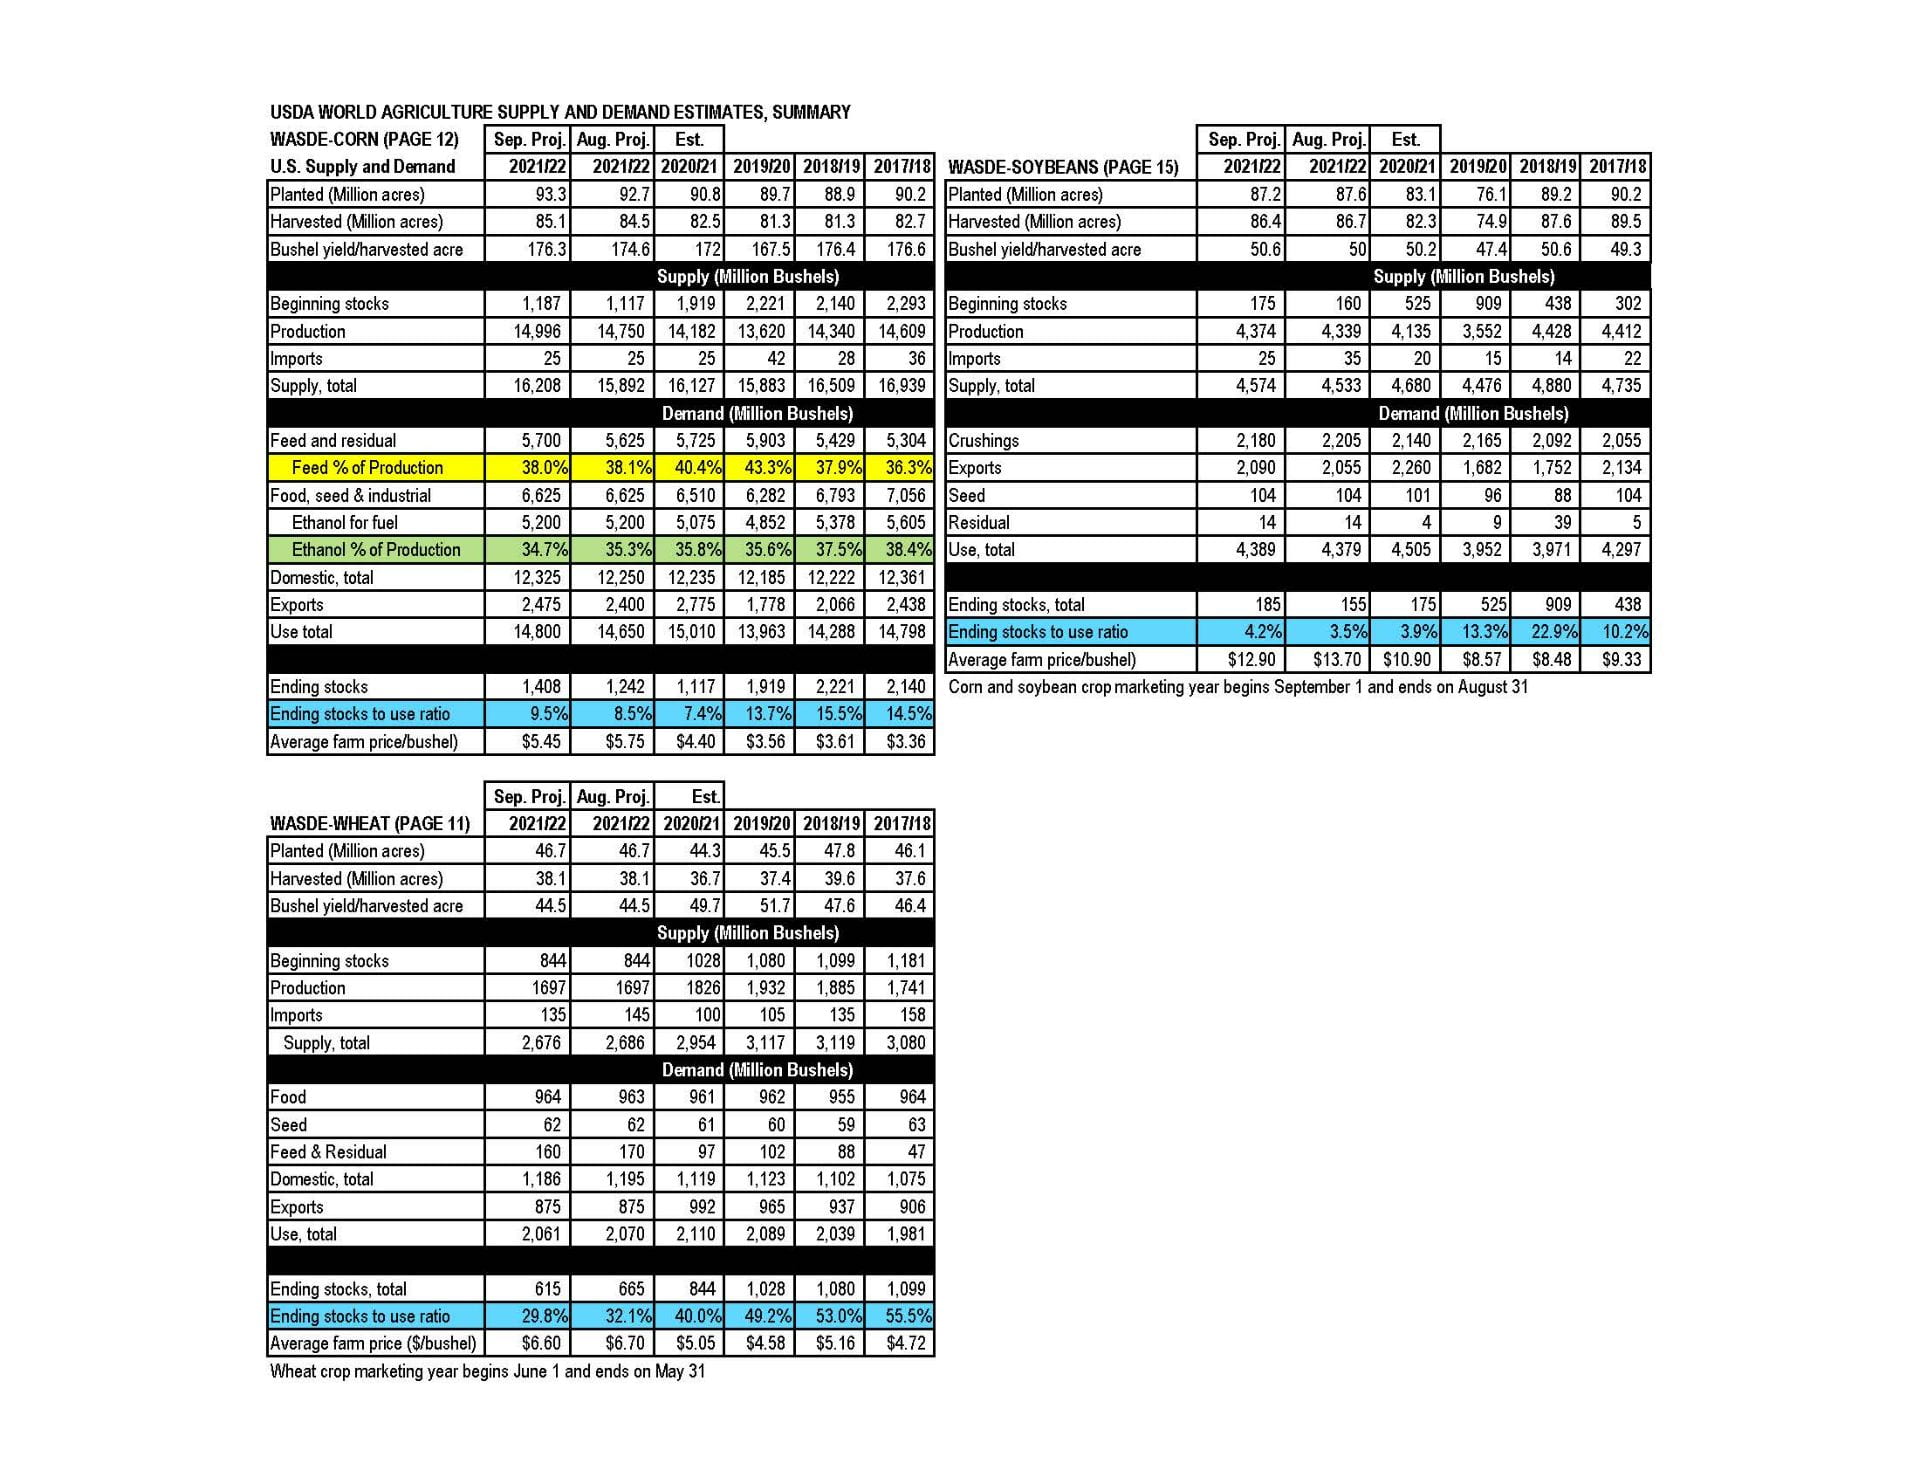
Attached is the summary for the February 2022 WASDE.

Corn

There were no changes in corn estimates from the January 12 WASDE report to the February 9 WASDE report. Ending stocks are estimated to be 1,540 million bushel with a stocks to use ratio of 10.4%. March 2022 Corn futures increased from $5.99 on January12 to peak at $6.45 on February 9 at the time of this report.

Soybeans

There were no changes in supply estimates. On the demand side, the estimate for crushings was increased by 215 million bushels. This resulted in a lower estimate of ending stocks at 325 million bushel and a decrease in the stocks-to-use ratio from 8.0% to 7.4%. March 2022 futures price increased dramatically from $13.99 on January 12 to peak at $15.97on February 9 at the time of this report- OH! so close to $16.00 beans!

Wheat

On the supply side, there were no changes in the estimates from January to February. On the demand side, Food estimate was decreased by 3 million bushel. Seed estimate was decreased by 2 million bushel. Export estimate was decreased by 15 million bushel. These changes increased the ending stocks by 20 million bushel to 648 million bushel and the stocks to use ratio increased from 32.0% to 33.4%. March futures increased from $7.58 on January 12 to peaked at 8.32 on January 25 but have since backed off to trade at a high of $7.88 pm February 9 at the time of this report.

January 2022 Grain Market Report

Dale Johnson, Farm Management Specialist
University of Maryland

Information from USDA WASDE report

Attached is the summary for the January 2022 WASDE.

Corn

2021/22 harvested acres estimate was increased by 300,000 acres which increased production and supply estimate by 52 million bushel. On the demand side there were minor adjustments with the net effect of a demand estimate increase of 5 million bushel. The result of these supply and demand estimates was an increase in ending stocks of 47 million bushels increasing the stocks-to-use ratio to 10.4% from 10.1 in December. March 2022 futures increased from $5.92 on December 9 to peaked at $6.18 on December 28 and close at $5.99 on January 12.

Soybeans

There were minor adjustments in soybean supply and demand estimates resulting in an increase of ending stocks estimate of 10 million bushels and an increase in the stocks-to-use ratio from 7.8% to 8.0 %. January 2022 futures price increased dramatically from $12.65 on December 9 to close at $13.91 on January 12.

Wheat

On the supply side, wheat import estimate was decreased by 10 million bushel. On the demand side, Feed and Residual estimate was decreased by 25 million bushel and export estimate was decreased by 15 million bushels. The net effect of supply and demand adjustments was an increase in ending stocks of 30 million bushel. The stocks-to-use ratio increased from 29.9% to 32%. December futures decreased from $7.77 on December 9 to $7.58 on January 12.

Register For The 2022 Virtual Agronomy Meeting

10 a.m. – 2:30 p.m.

This meeting will cover timely topics related to corn, soybean, and small grain production in Maryland. Hear from University of Maryland and other regional experts covering topics, such as:

  • Weed management with a limited toolbox
  • Hedging your bets to maximize profitability of fungicides on corn and soybeans
  • Agriculture leasing and agriculture law update
  • Corn nitrogen use following cover crops
  • Soil fertility and 4R

This meeting satisfies credits for pesticide applicator and nutrient management voucher renewals.

Register online: https://go.umd.edu/virtualagronomymeeting

October 2021 Grain Market Report

Dale Johnson, Farm Management Specialist
University of Maryland

Information from USDA WASDE report

Attached is the summary for the September 2021 WASDE.

Corn

2021/22 yield estimate was increased by 0.2 bushel per acre. The beginning supply estimate was adjusted up 49 million bushel. The net effect of these adjustments on estimated supply was an increase of 72 million bushel. On the demand side there were minor adjustments with the net effect of a decrease of 20 million bushel. The result of these supply and demand estimates was an increase in ending stocks of 92 million bushels and an increase in the stocks to use ratio from 9.5% to 10.1%. December futures peaked at $5.49 on September 30 but settled back at $5.22 on October 12.

Soybeans

2021/22 yield estimate was increased by 0.9 bushel per acre . The beginning supply estimate was adjusted up by 80 million bushel. Imports were adjusted down 10 million bushel. The net effect of these adjustments on estimated supply was an increase of 145 million bushel. Crushings were adjusted up 10 million bushels and residual was adjusted up 1 million bushel. The Net effect of all adjustments was an increase of 135 million bushels in ending stocks and increase in the stocks to use ratio from 4.2% to 7.3 %. November futures prices on June 10 closed at $14.59. November futures peaked at $13.08 on September 16 and  trended down to settle at $11.98 on October 12.

Wheat

There were small adjustments and demand and supply categories resulting in a net effect of a 35 million bushel decrease in ending stocks decreasing the ending stocks-to-use ratio from 29.8% to 28.5%. December futures peaked at $7.64 on October 4 then declined to settle at $7.34 on October 12.

September 2021 Grain Market Report

Dale Johnson, Farm Management Specialist
University of Maryland

Information from USDA WASDE report

Attached is the summary for the September 2021 WASDE.

Corn

2021/22 harvest acres projection was increased by 600,000 acres and yield estimate was increased by 1.7 bushel per acre. The beginning supply estimate was adjusted up 70 million bushel. The net effect of these adjustments on estimated supply was an increase of 316 million bushel. On the demand side, feed & residual estimate was increased by 75 million bushel and export estimate was increased by 75 million bushel. The result of these supply and demand estimates was an increase in ending stocks of 166 million bushels and an increase in the stocks to use ratio from 8.5% to 9.5%. December futures have declined from a high of $5.94 per bushel in August to close at $5.18 today.

Soybeans

2021/22 harvest acres projection was decreased 300,000 acres and yield estimate was increased by 0.6 bushel per acre . The beginning supply estimate was adjusted up 15 million bushel. Imports were adjusted down 10 million bushel. The net effect of these adjustments on estimated supply was an increase of 41 million bushel. Crushings were adjusted down 25 million bushels and exports were adjusted up 35 million bushel. The Net effect of all adjustments was an increase of 30 million bushels in ending stocks and increase in the stocks to use ratio from 3.5% to 4.2 %.   November futures prices on June 10 closed at $14.59. November futures trended down from a high of $13.80 in August to close at $12.86 today.

Wheat

There were small adjustments in and demand categories resulting in a net effect of a 50 million bushel decrease in ending stocks decreasing the ending stocks-to-use ratio from 32.1% in August to 29.8%. December futures have followed corn and soybean prices down from a high of $7.87 per bushel in August to close at $6.89 today.

August IPM Insect Scouting Tips

Emily Zobel, Senior Agriculture Agent Associate | ezobel@umd.edu
University of Maryland Extension, Dorchester County

Soybean: Continue to scout for stink bugs, dectes stem borer, and defoliators (bean leaf beetle, Japanese beetle, grasshoppers, and caterpillars). Control may be needed if there is 15% defoliation from bloom through pod fill. Chemical control is not recommended for dectes stem borer since it would require multiple applications to reduce larval infestations, which is not economical. If a high number of adults are found, harvesting that field as soon as it matures will reduce losses associated with lodged plants.

With the upcoming hot weather there is an increased chance of spider mite outbreak in vegetable and soybean fields (Fig 1). Scout by using a hand lens to examine mid to upper canopy leaflets on two plants in twenty locations along the edges of the field. Consider treating if 10 % of plants have heavy stippling feeding damage on ⅓ of their mid and lower leaves.

The next flight of corn earworm (CEW) will be taking place soon. Bean fields with open canopies (wide rows), are drought-stressed, or have recently had an insecticide applied are at higher risk for CEW. CEW larvae can feed on flowers without impacting yields. NC State has a good economic threshold calculator to assist with management decisions: https://www.ces.ncsu.edu/wp-content/uploads/2017/08/CEW-calculator-v0.006.html.

Field Corn: Check for stink bugs around the edges. The threshold is 1 stink bug per 2 plants from pollen shed to blister stage. Treatment is not recommended past the blister stage.

Sorghum: Sugarcane aphids typically show up in fields late July and August. Check underside of leaves for insects. Honeydew will turn leaves shiny and is an easy to see indicator that aphids are present. Sugarcane aphids are light yellow with black cornicles, antennae, and feet. Thresholds depend on plant growth stage; at boot to milk, thresholds are 50 aphids per leaf on 25 – 30% of plants. There is documented resistance to resistance to pyrethroids.

Be On Lookout for Tar Spot: A New Disease of Corn

Andrew Kness, Agriculture Agent | akness@umd.edu
University of Maryland Extension, Harford County

Before anyone panics, this disease has not been confirmed in Maryland; however, it is close by and could potentially spread to our state. As you’re scouting fields this summer, keep this one in the back of your mind.

Tar spot is a fungal disease of corn caused by Phyllachora maydis. It was first discovered in the United States in 2015. In Latin America where tar spot is more common, another fungal species, Monographella maydis, is known to occur in complex with P. maydis;  however, only P. maydis has been found in the United States.

The initial occurrence of tar spot in 2015 was limited to a couple of counties in Indiana, but by 2018 it had spread across much of the US corn belt and caused serious economic damage. In 2020, tar spot was confirmed in corn fields in Lancaster County Pennsylvania (Fig 1). We believe this large geographic jump was due to seed that had infected corn residue that was planted into variety trial plots.

Map of US showing distribution of Tar Spot
Figure 1. Map of tar spot in the United States after the 2020 growing season. Map generated from: https://corn.ipmpipe.org/tarspot/.

Symptoms of tar spot are primarily the presence of glossy black, raised lesions on the leaves (Fig 2). These lesions look like someone splattered paint or tar on the leaves, hence the name. These symptoms have been observed to occur from VT to maturity. Lesions are also visible on dried plant parts.

Black tar spot lesions on corn leaf
Figure 2. Tar spot symptoms on a corn leaf.

The fungus that causes tar spot overwinters in infected corn residue; however, it is unknown how well, or if, this pathogen will overwinter here in Maryland or if this disease will be of any economic importance in this region.

Currently there are no management recommendations for this disease for our area, because as stated, it is yet to be confirmed in Maryland and unknown if it will be a problem. For the 2021 corn crop, be on the lookout for this disease in your corn fields, especially if your have any corn hybrid trials planted in your field. If you suspect you found this disease, please contact Andrew Kness (410-638-3255, akness@umd.edu) and we will work with you to confirm identification.


July IPM Insect Scouting Tips

Emily Zobel, Senior Agriculture Agent Associate | ezobel@umd.edu
University of Maryland Extension, Dorchester County

Be sure to check all labels carefully before applying and combining insecticides and herbicides.

Soybean: Scout for the usual defoliators, including bean leaf beetle, Japanese beetle, and caterpillars. The treatment threshold is 15-20% defoliation for bloom to pod fill. Note that defoliation percentages should be based on the entire soybean plant or canopy, not just the top leaves or worst leaves. University of Nebraska Extension has a nice guide for defoliating insects in soybeans (https://croptechcafe.org/defoliating-insects-in-soybeans-thresholds-training-and-tools/).

Adult Dectes Stem Borer will be emerging over the next several weeks. Chemical control is not recommended since it would require multiple applications to reduce larval infestations, which is not economical. However, if a high number of adults are found, harvesting that field as soon as it matures will reduce losses associated with lodged plants.

Field Corn: At the start of silking, scout for Japanese beetles and stink bugs. For Japanese beetles, the treatment threshold is when there is less than ½ inch of silk and less than 50% pollination, and an average of 2 or more beetles per ear. For stink bugs, the threshold is 1 bug per 10 plants (V1 to V6), 1 bug per 8 plants (V14 to VT), and 1 bug per 4 plants (R1 to R2). Stink bugs and Japanese beetles are ‘edge’ pests, so treatment may only be needed around field edges and pivot tracks.

Alfalfa: Continue scouting for potato leafhoppers (PLH). Cutting will destroy many of the nymphs, and adults will often move elsewhere, but be sure to scout the regrowth. A rough threshold estimate is 20 PLH per 100 sweeps on alfalfa 3 inches or less in height, 50 PLH per 100 sweeps in 4-6 inch tall alfalfa, and 100 PLH per 100 sweeps in 7-11 inch tall alfalfa. A more precise threshold chart can be found on the Penn State Extension website https://extension.psu.edu/potato-leafhopper-on-alfalfa.


June 2021 Grain Market Report

Dale Johnson, Farm Management Specialist
University of Maryland

Information from USDA WASDE report

Attached is the summary for the June 2021 WASDE.

Corn

The only change in 21/22 corn estimates was a negative adjustment of 150 million additional bushels in the Ending 20/21/Beginning 21/22 stocks. This decreased the 21/22 ending stocks 150 million bushels and increased the estimated stocks to use ratio from 10.2% in May to 9.2% in June. December futures prices on May 12 closed at $5.93. Prices through May declined to a low of $5.23 on May 26 but have since rebounded and closed at $6.15 on June 10.

Soybeans

The only change in 21/22 soybean estimates was an adjustment of 15 million additional bushels in the Ending 20/21/Beginning 21/22 stocks. This increased the 21/22 ending stocks 15 million bushels and increased the estimated stocks to use ratio from 3.2% in May to 3.5% in June. November futures prices on May 12 closed at $14.44. Prices through May declined to a low of $13.26 on May 26 but have since rebounded and closed at $14.59 on June 10.

Wheat

21/22 Wheat yield estimates were increased 0.7 bushels per acre which resulted in a 26 million bushel increase in production estimates. There was a 20 million bushel decrease in the Ending 20/21/Beginning 21/22 stocks estimate. Import estimates decreased 2 million bushel. On the demand side Feed & residual estimate was increased 10 million bushel. The net effect of all these estimate changes was a decrease of 4 million bushels in ending stock and a decrease in the stocks-to-use ratio from 36.9% in May to 36.6% in June. Nearby (July) prices on May 12 closed at $7.30. Prices through May declined to a low of $6.40 on May 26 but have since rebounded and closed at $6.83 on June 10.