Weather Market Phenomena

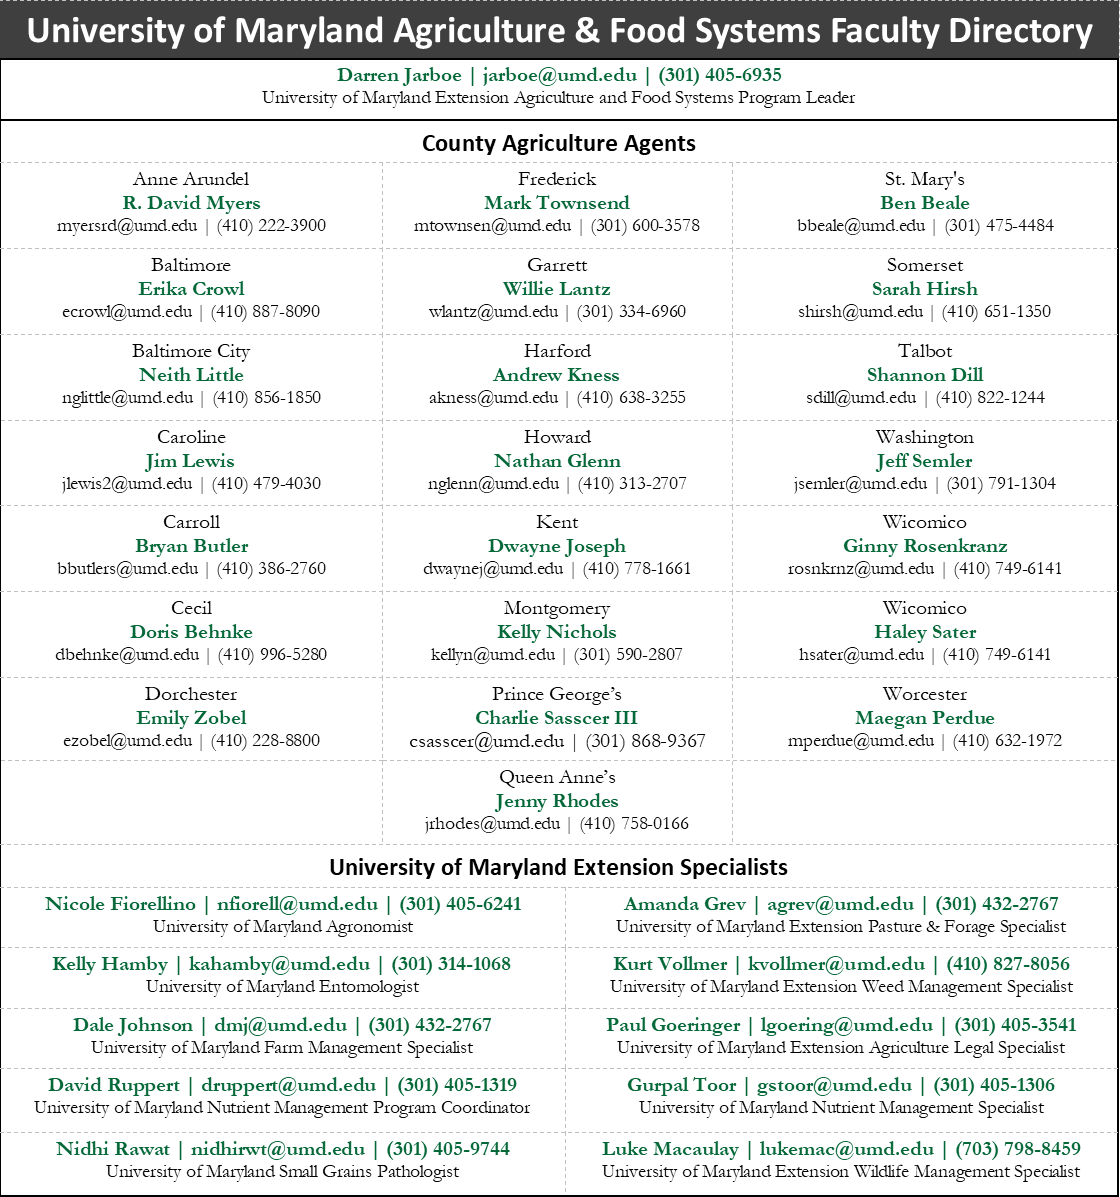
Nathaniel Bruce, Farm Business Specialist, University of Delaware and
Mark Townsend, Agriculture Agent Associate, University of Maryland Extension, Frederick County

June proved volatile for grain markets. To recap, the December 2023 contract rallied off its $4.90 lows from late-May, peaking at $6.29 on June 21st and has precipitously fallen back below $5.00 at the time of writing this article. As it does, the soft red winter wheat market followed suit in the September contract with a big swing from the $5.87 lows on June 1st to a high on June 26th at $7.70 only to plummet back to earth reaching $6.51 currently. No less, the November soybean market followed a similar pattern rising from $11.30 on June 1st to peaking at $13.77 on June 21st, and then tumbling back some in the last week of June only to find levity on the last day of the month.

It’s not difficult to convey the gravity of these swings: In one singular month, we saw a $1.39 gain and decline in the corn market, a $1.87 upswing and $1.19 downfall in the wheat market, and a $2.07 upswing with a $1.13 retracement followed by an $0.76 movement higher on the last trading day of the month in the soybean market.

The summary begs the questions: how can we explain the volatility of these markets and what can we do as producers to limit our risk to any further price loss?

Firstly, the phenomena we have encountered this last month can be described as the result of a “weather market”—a period of time in which traders make decisions based on current and prospective weather conditions that affect the production (supply) of a particular commodity in hopes of capturing a premium related to production risk. Put another way, this is a “supply-side” market driver as there is a risk to the volume of production.

The weather in question is that of the central United States as the region is under varying degrees of drought. The most recent USDA Drought Monitor (6/29/2023) report indicates that 53% of the contiguous United States is experiencing some level of drought. On a per crop basis the monitor indicates that 70% of corn growing regions and 63% of soybean growing regions are in some degree of drought. Reports in June indicated progressively higher levels of moisture stress in large swaths of the corn belt. As we well know, corn demands roughly an inch of rain each week when in the rapid growth stages and entering pollination. With this, traders bet on a reduction in yield for this year’s corn crop, thus raising the price through market actions.

Traders not only looked at retrospective reports like the drought monitor, but also analyzed weather forecasts for these regions. For much of the month, neither the GFS (U.S. based) nor the ECMWF (European based) weather models predicted any significant rainfall for these regions. In some instances, the models added further uncertainty as the GFS forecasted sporadic precipitation events while the ECMWF left the radar screen blank. On the ground, drought regions experienced high winds and high temperatures further drying out soils and inducing greater rates of transpiration from an already moisture-stressed crop.

With these factors at play, market participants found reason to purchase grain futures contracts or options in hopes of realizing some future increases in commodity prices. The Commodity Futures Trading Commission (CFTC) reports the commitment of traders market positions in which the non-commercial speculative entities (aka “the funds”–referring to money managers like hedge funds or mutual funds) with significant market power were in a net short position by about 60-70k contracts of corn entering the month of June. As the month progressed, the most recent report indicates that these market participants held a 100-115k net long position (As of 6/27/2023). Effectively, this means that these market participants were betting on a decline in the corn futures market at the end of May, only to quickly reverse course and bet a far larger position on an increase in the corn futures market price. There is a significant delay in the release of these reports, so it is difficult to ascertain where the funds stand after the last week in June ending in a Friday sell-off in corn and wheat. Though current estimates place fund positions back to near neutral (equal quantity of long and short positions) in corn. Traders in the wheat futures market followed a similar path to corn, while traders in the soybean futures market are currently estimated to be in a significantly long position.

The weather trading continued later into the month; price action in the last week of June saw falling prices as regions of the Midwest realized modest precipitation accumulations. No less, the GFS and ECMWF weather models agreed on additional future precipitation events thus indicating a potential for salvage of the current crop.

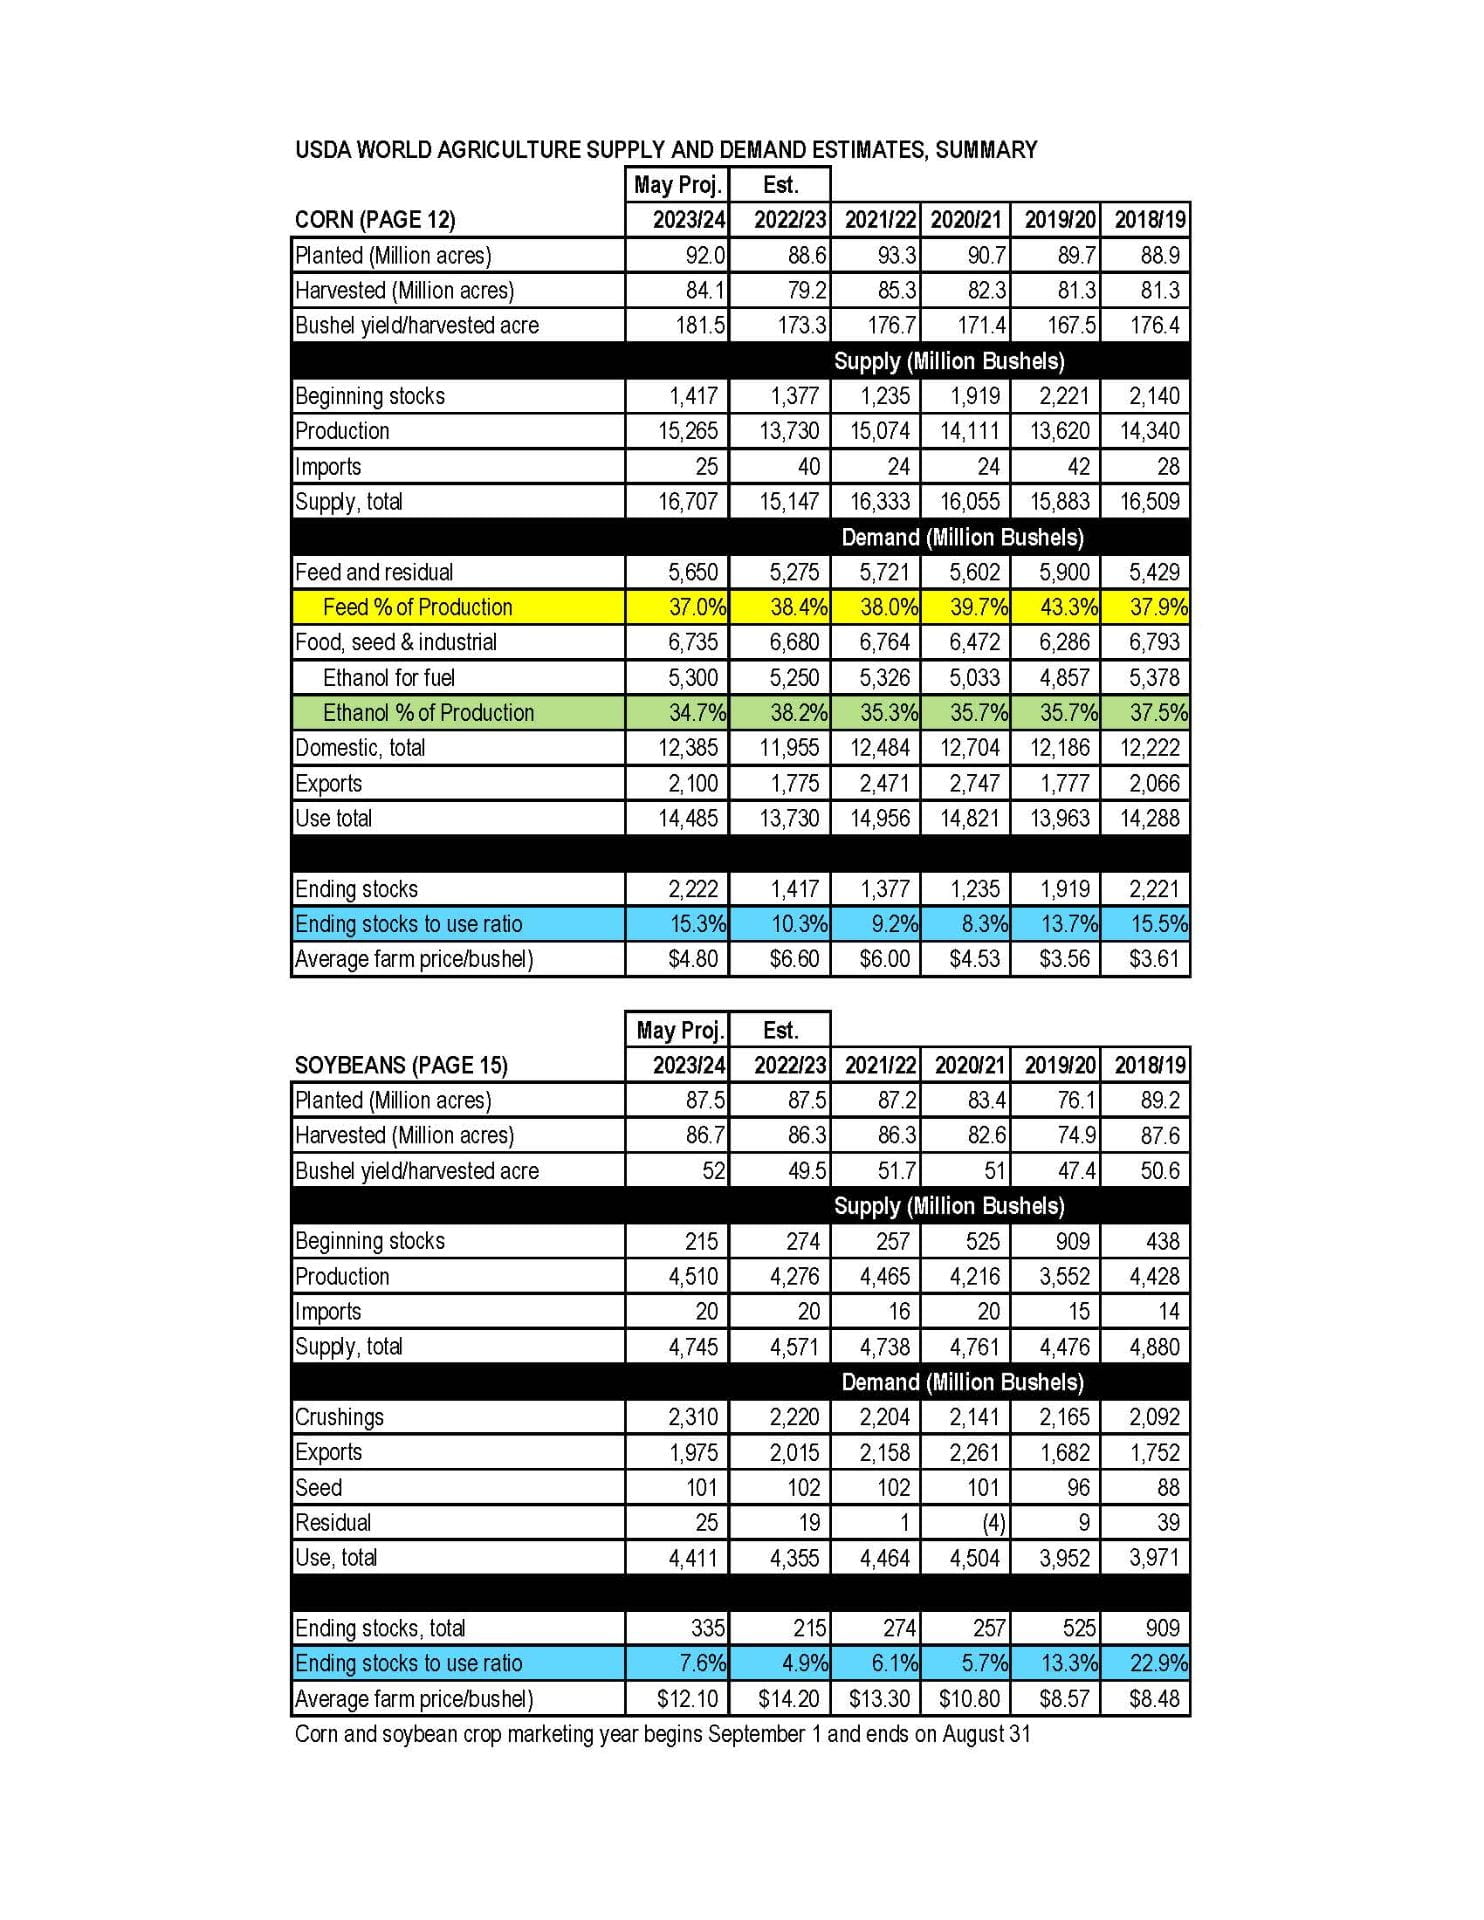
To cap off an already topsy-turvy last week in June and generally volatile month, the USDA released Quarterly Grain Stocks and Planted Acreage reports on Friday, June 30th. The grain stocks report followed analysts estimates, however the planted acreage report unexpectedly and significantly deviated from the market sentiments. Reported planted corn acreage rose roughly 2 million acres from a previous prediction report, and an increase of about 5% from last year.  Soybean acreage fell by about 5% compared to last year, which is about 4.2 million acres lower than the average trade estimate. Markets traded this supply-side news as corn fell back to prices not seen since December of 2020. On the other hand, the soybean market is trading back to levels from mid-June.

The volatility of these markets is unmistakably high. Not only is the current implied volatility of these markets (based on options prices) higher than 60-80% of all trading days in the previous year, but trading strategies involving options require larger investments.

Figure 1. Corn 2012 vs 2023.

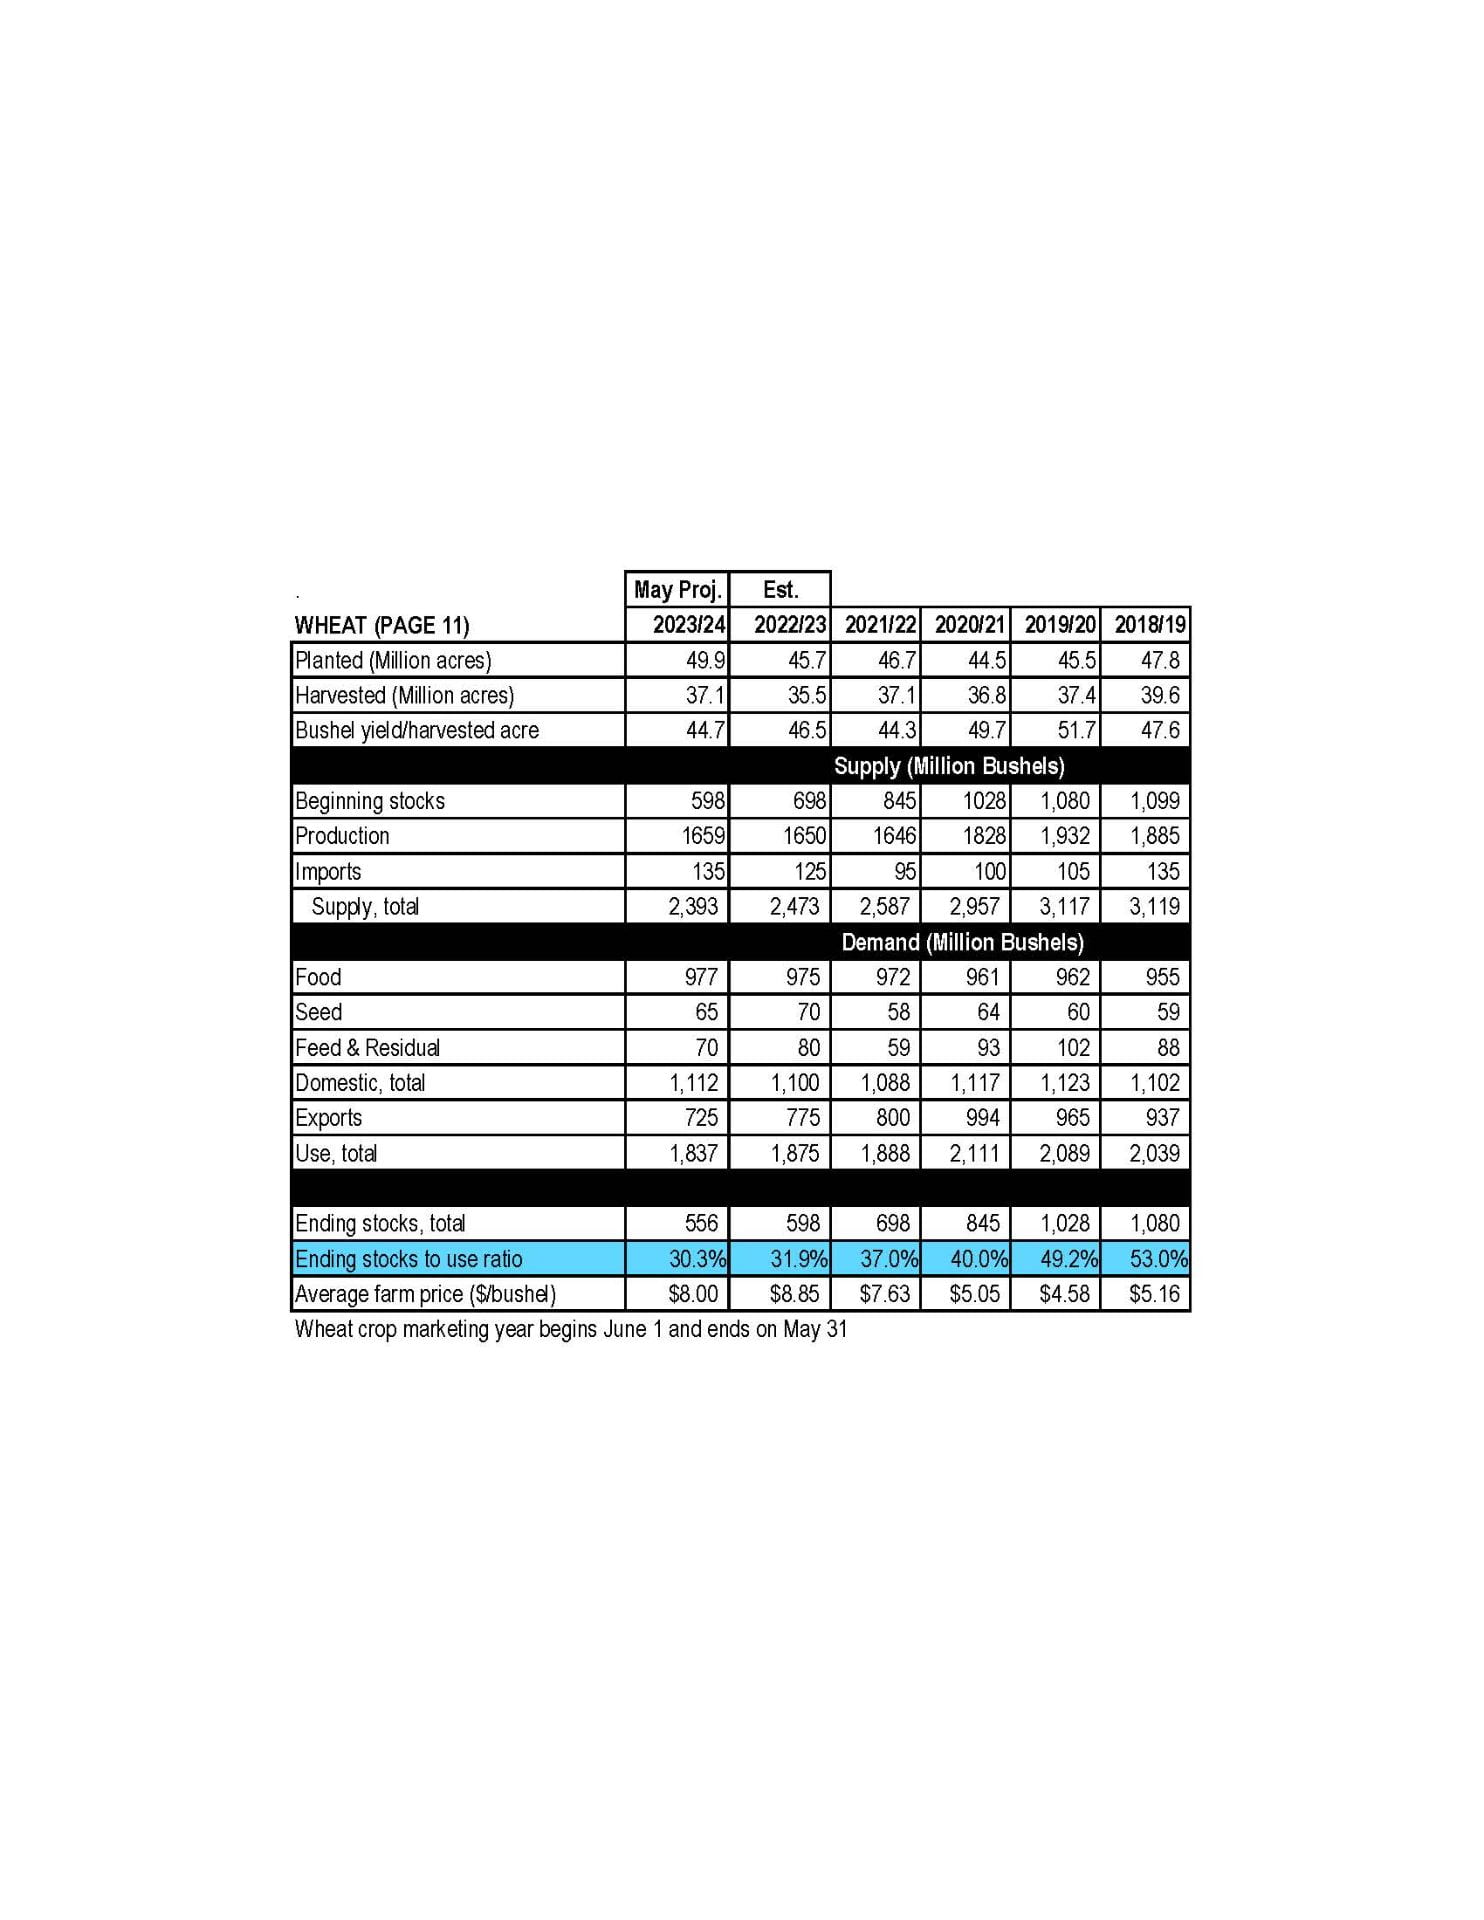
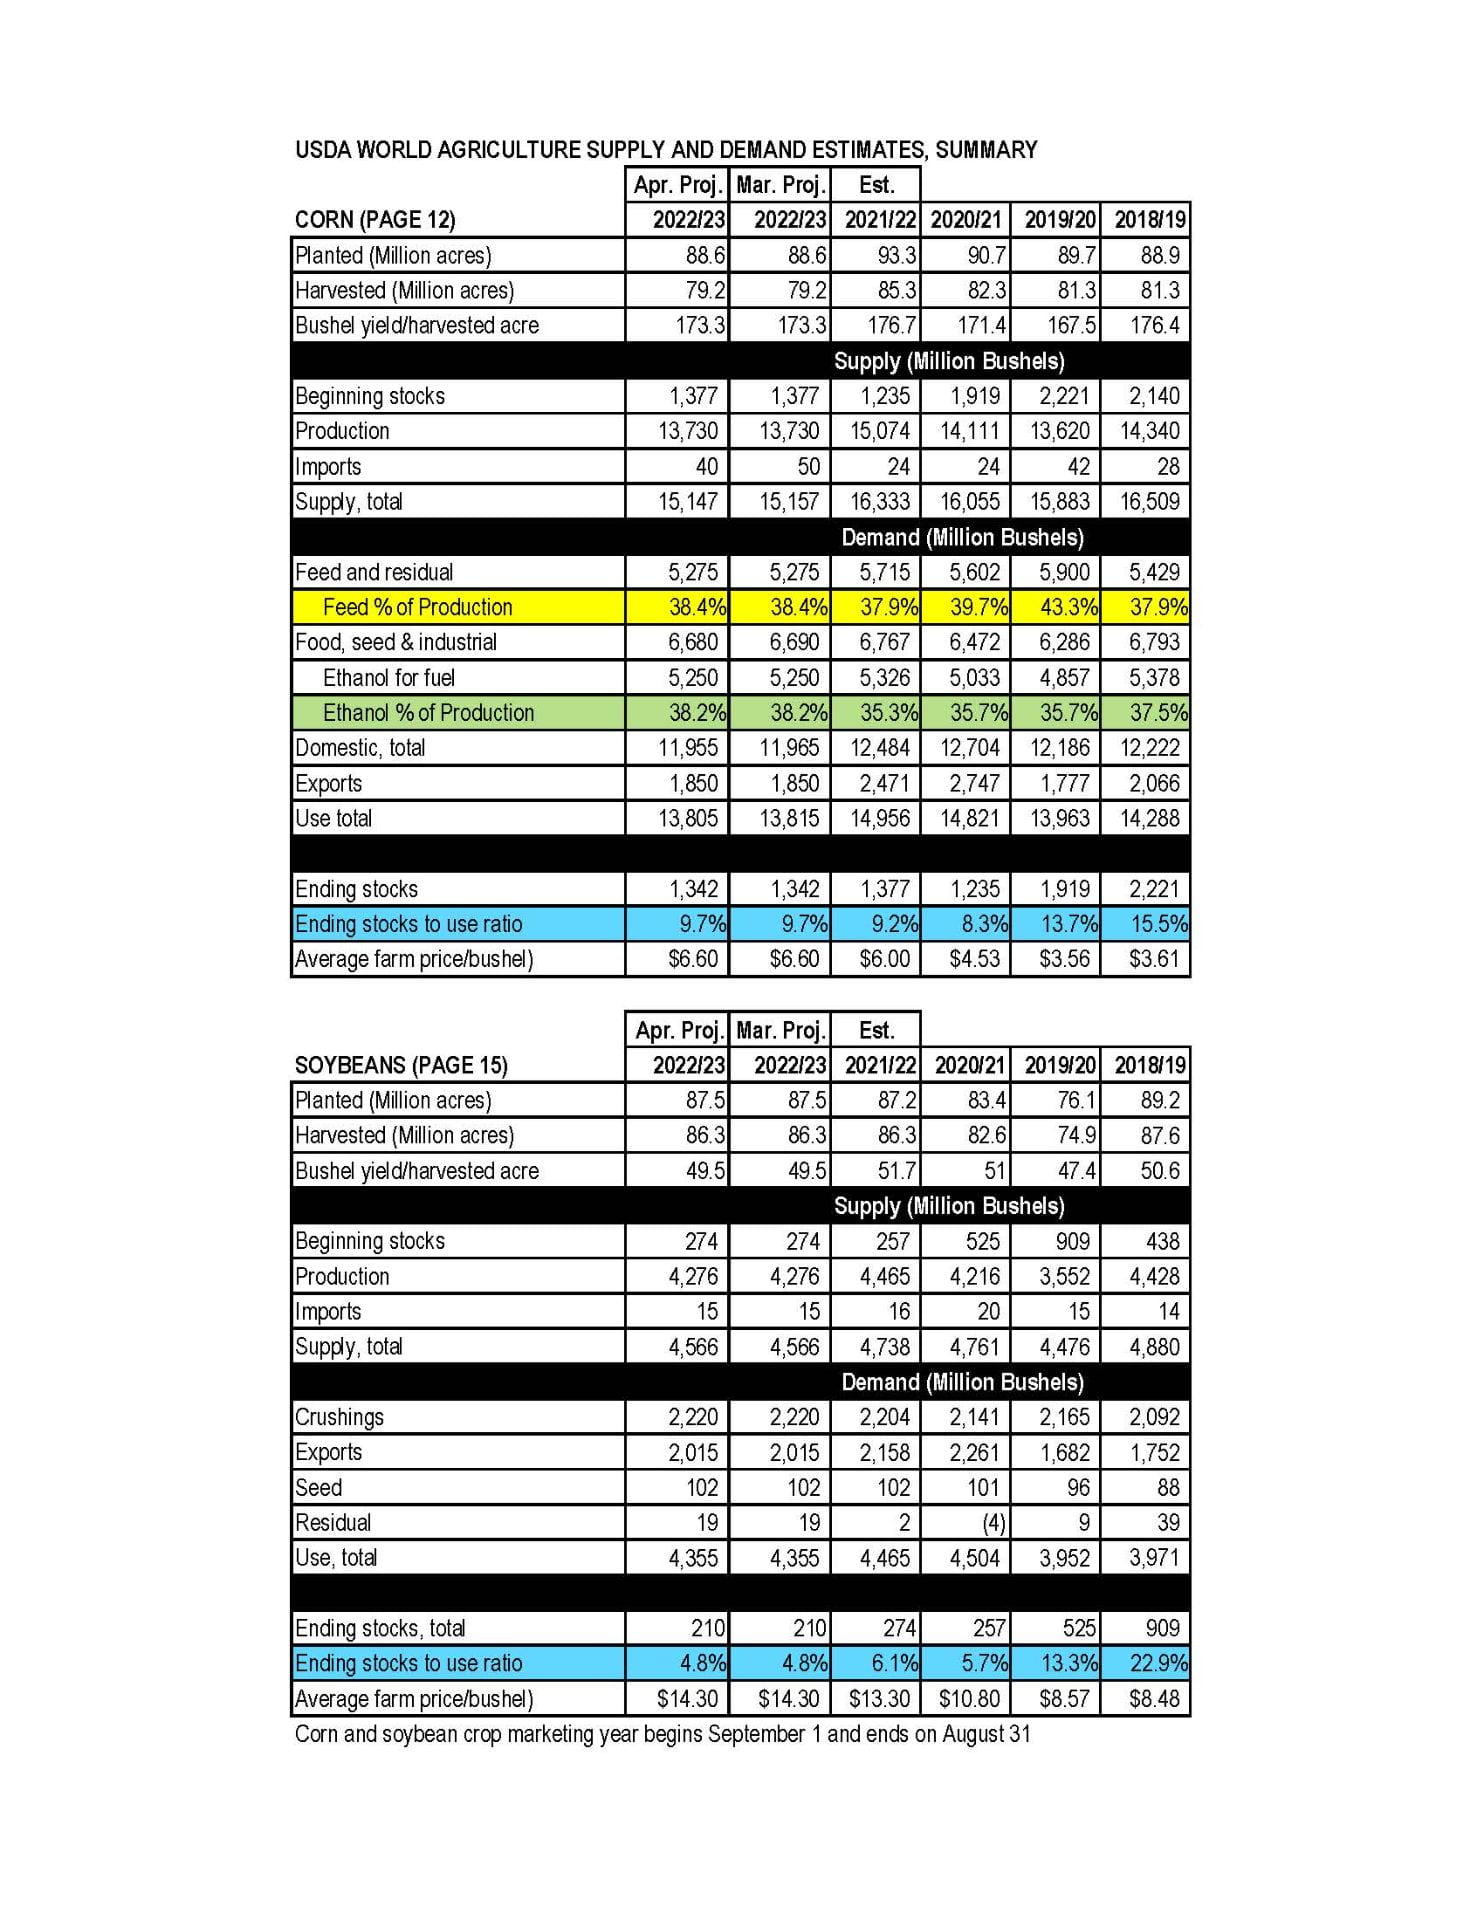
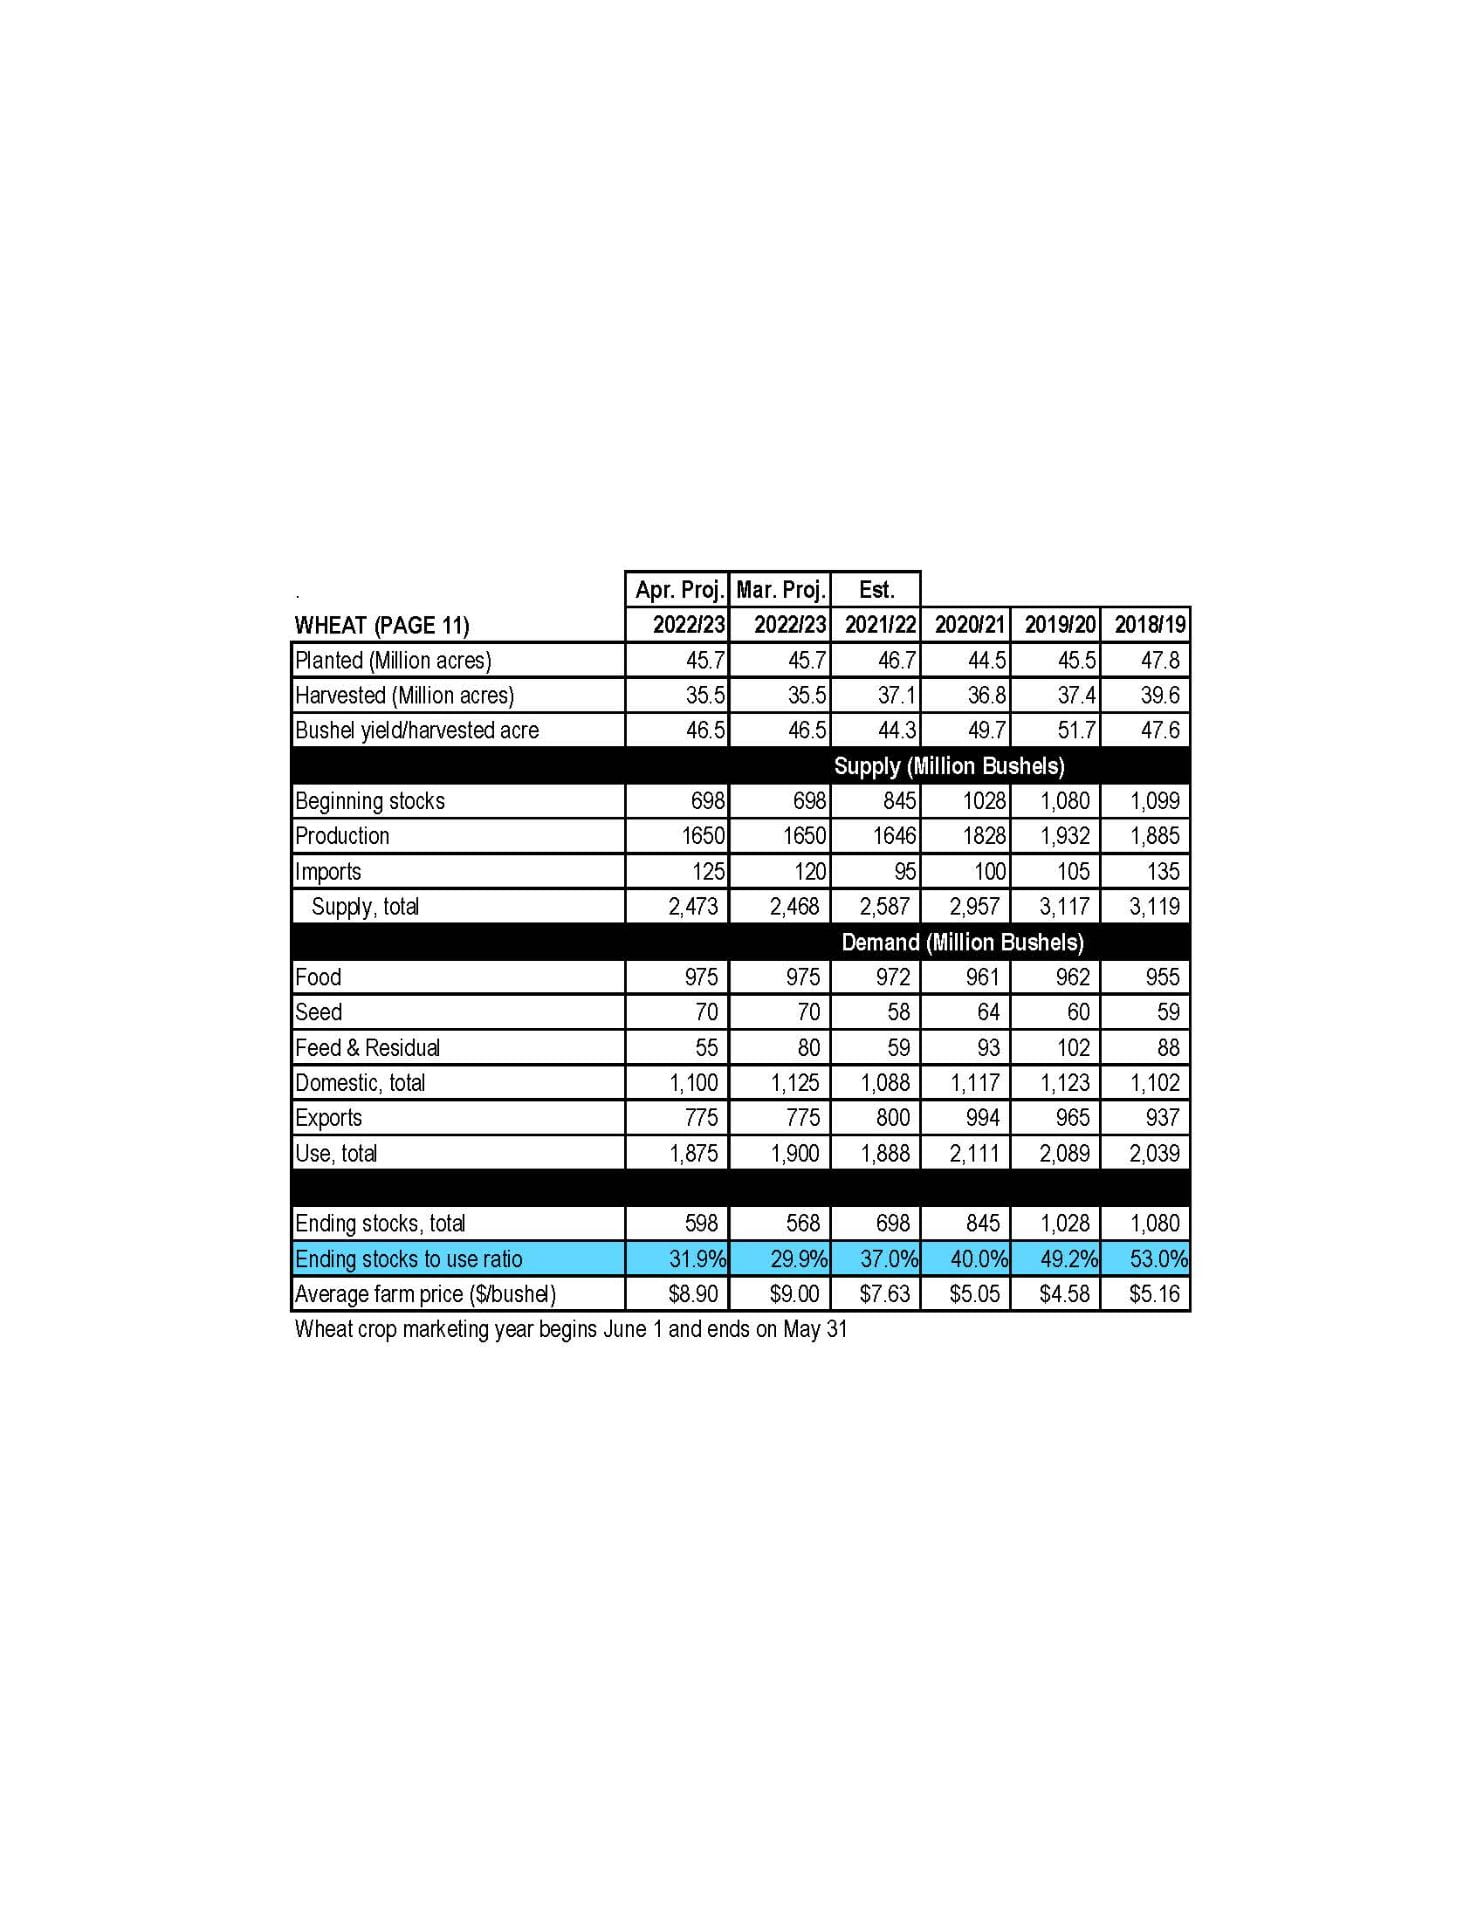
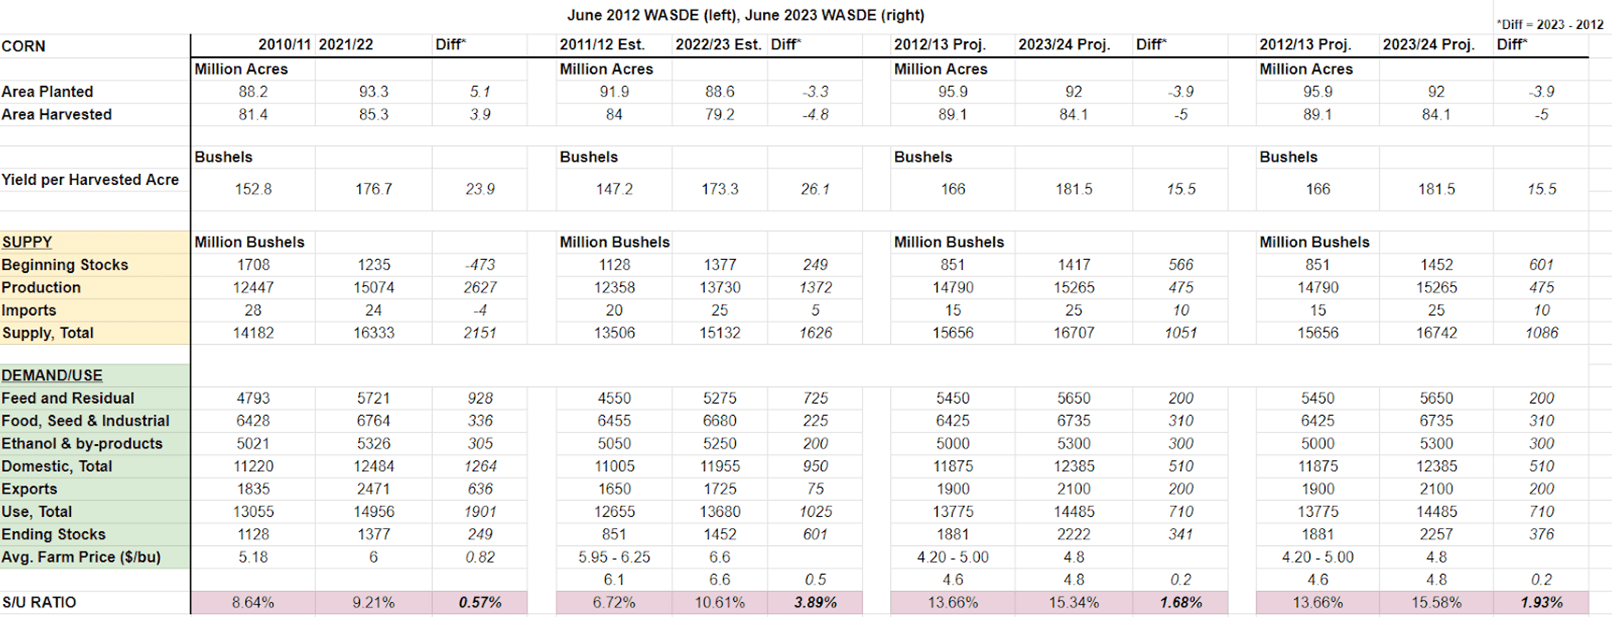
Marketing a crop in these conditions is undoubtedly challenging. We may look to previous years for guidance, though even this is uncertain. Analysts have likened the run-up in the grain markets to those in 2012 when a similar drought induced crop failures across the Midwest. Currently, there exists a 0.56 correlation coefficient between the 2012 December contract and the 2023 December contract (Figure 1). In truth, this exact discussion is nothing new; many marketing professionals and memorious farmers recall the drought of 2012 that spurred a dramatic run-up in the corn price reaching a peak of $8.49 on August 10th, 2012 and will refer to this observation whenever a drought emerges in the Midwest. Although, there is a correlation in prices between Dec’12 Corn and Dec’23 corn, the fundamental supply and demand picture is vastly different between 2012 and 2023 as there is nearly 4% larger Stocks-to-Use ratio in 2023 than 2012 given the current lack-luster export, feed, and ethanol demand we have experienced for the current marketing year.

Figure 2. USDA WASDE June 2012 vs. June 2023.

Other more bearish investors have noted that the current price trend is more similar to 1992 in which an early season drought induced volatility and rising prices. Contrary to 2012, the 1992 corn market saw a dramatic price decline after timely and significant rains busted the drought and produced a near trend-line crop yield.

So how does one effectively market a crop this year? The first step as always is to know the cost of production taking into actual input price figures to uncover an operation’s breakeven price and yield. Yield does play a critical role in determining these figures, though as we know yield is not the sole driver of profitability. Please refer to the University of Maryland Extension website for enterprise budget templates here: https://extension.umd.edu/programs/agriculture-food-systems/program-areas/farm-and-agribusiness-management/grain-marketing.

Certainly a next step would be to look for ways to offset future price risk. Depending on the level of familiarity, options strategies could offer additional downside protection. However, this is most commonly accomplished by forward contracting some of the new crop. At the time of writing, the soybean market continues to rise modestly above estimated cost of production figures for Central Maryland. Producers may find these prices profitable and would be well advised to limit potential downside risk.

Marketing professionals offer that producers may find shelter in short-run run-ups to sell new crop corn and stored wheat. Some analysts predict that the USDA may have to revise yield estimates lower given the potential damage done to the corn crop of the Midwest. The market may react to this revision lower, whereby the watchful marketer could capitalize on a small upward price movement. Yes it is tempting to wait for the next larger rally in the market, but waiting to find the top of the curve may prove far more risky than taking smaller profits. A wise farmer once said that he stayed in business for many years because, “I always took my profits too early.”

Wheat Quality Concern—Falling Numbers are Falling

Nicole Fiorellino, Extension Agronomist | nfiorell@umd.edu
University of Maryland, College Park

Figure 1. Extreme example of pre-harvest sprout in wheat. Image: Ohio State University.

2023 was shaping up to be a decent wheat season, with mild winter and minimal disease impacts this spring. Although some areas of the state were dry, there were some timely rains at the end of April to get the crop through the rest of the season. We sometimes forget that wheat thrives in much drier climates than the Northeast, and what seems dry to us was probably ideal for wheat.

As wheat harvest is currently underway in some areas of the state, the hopes of high yields and disease-free grain may now be riddled with an unseen quality blemish – falling falling numbers. Growers producing wheat for use in milling or baking are paying attention to quality measures such as falling numbers, or the activity of the alpha amylase enzyme in the grain stemming from pre-harvest sprouting. As grain begins sprouting within the head, prior to harvest, alpha amylase builds up and degrades starch, which decreases flour quality. To measure falling numbers, a slurry of grain meal and water is mixed and a plunger is dropped into the slurry, with the time measured for the plunger to drop through the slurry. High alpha amylase results in low starch, which thins the slurry and the plunger falls quicker, resulting in lower falling number measures. In short, low falling numbers equals bad quality wheat that is not suitable for milling or baking.

Causes of low falling numbers, similar to disease pressure, are somewhat out of a grower’s control and not very well understood. Some areas of the state received a respite from the dry conditions, in the form of a few days with a small amount of precipitation towards the end of June. While our corn crop happily received the moisture, this was enough rain in some areas to not only delay the beginning of wheat harvest but signal the wheat grain to break dormancy and begin to sprout. Low falling numbers may also be observed in grain that did not sprout due to a defect known as late maturity alpha amylase (LMA). This is the buildup of alpha amylase in the wheat grain triggered by cold stress during maturation. It is still unclear how to specifically define “cold stress” that causes LMA but it is yet another process that increases alpha amylase in the wheat grain, decreasing flour quality. In any given season, low falling numbers can be a result of either pre-harvest sprouting or LMA or even both conditions. Susceptibility to pre-harvest sprouting and LMA are genetically linked, but even with genetic resistance, the interaction between genetics and environmental conditions can still result in decreased falling numbers.

For the 2023 wheat crop, it is important to get wheat harvested as soon as possible. There is no way to correct for falling numbers now, but growers can make every effort to get wheat out of the field as quickly as possible to avoid exposure to additional precipitation events. While all hope is not lost and wheat with low quality can still be sold for feed, any potential premiums for producing high quality wheat will be lost. For future seasons, Maryland growers can make an effort to select early maturing wheat varieties, to hopefully expedite harvest in the spring. We know the down-season benefits of early wheat harvest, such as earlier planting and higher yields of double crop soybeans, and we are also aware of the potential risk of frost damage to early maturing wheat. However, early maturing wheat varieties may be a the best option to mitigate quality issues. While your premium for 2023 may be lost, you should begin discussing your 2024 wheat crop with your crop insurance agent now, especially if you are planning to grow high quality wheat for milling or baking. There may be coverage options available to protect you from lost premiums due to poor falling numbers, for example, so now is the time to plan accordingly for 2024.

Maryland Regional Crop Reports: June 2023

Reports are for crop conditions up to June 1, 2023.

Western Maryland

To say we are dry would be an understatement. Corn planting is winding down and the last of the full-season beans will soon be finished up too. Barley and wheat are in full head a bit ahead of normal, whatever that is. The dry weather is a good thing for cereals as the conditions are poor for fungal growth. It will be interesting to see what effect the dry weather will have on test weight and yield. First cutting alfalfa and most of the grass hay is in the barn or silo. Rain will be important very soon for forage regrowth and corn and bean growth. The cool evenings and overnights have been the only blessing but heat is on the way.—Jeff Semler, Washington Co.

Central Maryland 

Frederick County has finished planting corn. There may be the occasional field that remains, but this is the exception. Early corn is at the V4-5 stage while later planted fields are approaching V2. Seedling diseases have been nearly non-existent in scouted fields, though wireworm pressure has been observed in both corn and soybean fields. Soybeans are 90% planted; early beans are around V2 while most are VC-V1.  The majority of the hay crop is made and in the barn. Annual weeds have emerged and are approaching a foot tall in some fields, though weed pressure has remained limited given the dry weather and resulting effective burndown applications. Second cutting alfalfa is underway, some weevil pressure had been observed in the occasional field though generally there has been relatively limited pressure. Most barley is at or near soft-dough stage, while the wheat crop has finished flowering and is moving into grain fill. Both small grain crops appear in good to great condition given the limited disease pressure.—Mark Townsend, Frederick Co.

Northern Maryland

We got through the entire month of May without any measurable precipitation. Such weather has made for great conditions for making hay, and this is one of the few times in recent memory where pretty much all of the first cutting hay crop was put up before June 1; although yields did appear to suffer in some fields due to the dry weather. 99% of the corn crop is planted and emerged, with earliest planted corn around V5-6. Almost all full-season soybeans have been planted and are anywhere from just planted to V3-4. Both corn and soybeans have yet to show wilting, but they are both growing very slowly due to the lack of rain. Fortunately we are running well below with temperatures in the 70s most of the month. Wheat is just starting to turn and appears to have very little disease pressure; we will see how the dry spring affects yield and test weight. We are hoping for a bit of rain in the coming weeks.—Andy Kness, Harford Co.

Upper and Mid Shore

Early planted corn greened up, but definitely has reduced yield potential. Later planted corn looks great- good color and uniform. Early beans are finally outgrowing slug feeding. Like corn, later beans look great. Barley harvest will begin 1st week of June. Wheat is starting to turn. There was great hay made last week. Soil conditions across the region are getting dry.—Jim Lewis, Caroline Co.

Lower Shore

Wheat and barley are drying down. Corn has been planted, and is generally around V1 to V5 stage. Most soybean has been planted and early soybean plantings have emerged. Herbicide-resistant weeds, such as common ragweed, marestail, and palmer amaranth, are starting to emerge. Scout and spray early to stay ahead on control. Some farmers have utilized late-terminated cover crops to help manage weed pressure through providing a mulch on the soil surface. Deer are prevalent in fields and causing damage on corn and soybean seedlings.—Sarah Hirsh, Somerset Co.

Southern Maryland

Temperatures finally touched the 80°F mark this week. Cooler temperatures and lack of rainfall has slowed crop progress in May. Most corn fields are a kaleidoscope of yellow shades and uneven stands. Black cutworms, slugs, wireworms and seed corn maggot are active across the region. We received scattered showers last weekend that helped crop conditions improve in most areas. Soybeans follow much of the same story. Early planted beans look decent. Barley is drying down with harvest expected any day. Wheat will not be far behind. Ryegrass continues to be a challenge for producers in both burndown situations in corn and beans, as well as small grains. My thought is the cooler weather is affecting the performance of glyphosate, especially on larger plants. The pockets of glyphosate resistant ryegrass are expanding in our area as well. The drier weather has been good for making hay- we saw a lot of balers in the field last week.—Ben Beale, St. Mary’s Co.

*Regions (counties):

Western: Garrett, Allegany, Washington. Central: Frederick, Montgomery, Howard. Northern: Harford, Baltimore, Carroll. Upper & Mid Shore: Cecil, Kent, Caroline, Queen Anne, Talbot. Lower Shore: Dorchester, Somerset, Wicomico. Southern: St. Mary’s, Anne Arundel, Charles, Calvert, Prince George’s

2023 Small Grain Field Day

wheat field

Date: May 23, 2023
Time: 3pm
Location: Wye Research and Education Center
211 Farm Lane, Queenstown, MD 21658

Registration link: http://bit.ly/smallgrain23

The program will start at the seed building and proceed to the fields. We will hear an update on the Agronomy degree program within the Department of Plant Science and Landscape Architecture, including highlights from the first semester teaching AGST401: Tractor and Equipment Operation, Safety and Maintenance. We will showcase a commercial variety strip trial organized by the Maryland Crop Improvement Association (MCIA) and industry reps will be on hand to discuss their entries in the trials. Dr. Vijay Tiwari will discuss the small grain variety trials and his wheat breeding program, Dr. Nidhi Rawat will discuss her pathology work in barley and wheat, and Dr. Kurt Vollmer will update us on weed control in wheat.

Dinner will be served at 5pm, sponsored by Maryland Crop Improvement Association and others.For additional program information, contact Dr. Nicole Fiorellino at nfiorell@umd.edu or 443-446-4275.

May 2023 Grain Market Update

Dale Johnson, Farm Management Specialist
University of Maryland

Information from USDA WASDE report

Attached is the summary for the May 2023 WASDE.

Corn

The 2023/24 U.S. corn outlook is for larger production, greater domestic use and exports, and higher ending stocks. The corn crop is projected at a record 15.3 billion bushels, up more than 10 percent from last year on increases to both area and yield. The yield projection of 181.5 bushels per acre is based on a weather-adjusted trend assuming normal planting progress and summer growing season weather, estimated using the 1988-2022 time period. With beginning stocks up slightly, total corn supplies are forecast at 16.7 billion bushels, the highest since 2017/18. Total U.S. corn use for 2023/24 is forecast to rise about 5 percent relative to a year ago on higher domestic use and exports. Food, seed, and industrial use is projected to rise 55 million bushels to 6.7 billion. Corn used for ethanol is projected to increase 1 percent, based on expectations of modest growth in motor gasoline consumption and ethanol’s inclusion rate into gasoline. Feed and residual use is projected higher on a larger crop and lower expected prices. U.S. corn exports for 2023/24 are forecast to rise 325 million bushels to 2.1 billion, as lower prices support a sharp increase in global trade following the decline seen during 2022/23. U.S. market share is expected to increase slightly albeit remain below the average of the past 5 years. Exports are higher for Argentina and Brazil, with the former reflecting a return to normal weather conditions after a drought during 2022/23. Despite a rebound in U.S. exports, Brazil is forecast to be the world’s largest exporter of corn for the second consecutive year. Exports for Ukraine are projected to decline based on lower production prospects. With total U.S. corn supply rising more than use, 2023/24 ending stocks are up 805 million bushels from last year and if realized would be the highest in absolute terms since 2016/17. Stocks would represent 15.3 percent of use, the highest since 2018/19. The season-average farm price is projected at $4.80 per bushel, down $1.80 from 2022/23.

Soybean

The 2023/24 outlook for U.S. soybeans is for higher supplies, crush, and ending stocks, and lower exports compared with 2022/23. The soybean crop is projected at 4.51 billion bushels, up 5 percent from last year’s crop mainly on higher yields. With lower beginning stocks partly offsetting increased production, soybean supplies are forecast at 4.75 billion bushels, up 4 percent from 2022/23. Total U.S. oilseed production for 2023/24 is projected at 132.8 million tons, up 6.9 million from 2022/23 mainly on higher soybean production. Production forecasts are also higher for canola, peanuts, and cottonseed. The U.S. soybean crush for 2023/24 is projected at 2.31 billion bushels, up 90 million from the 2022/23 forecast on favorable crush margins and strong demand for soybean oil as a biofuel feedstock, which is projected to increase 900 million pounds to 12.5 billion. Domestic soybean meal disappearance is forecast to increase 2 percent from 2022/23 on lower soybean meal prices and modest growth primarily in poultry production. U.S. soybean meal exports are forecast at 14.8 million short tons, leaving the U.S share of global trade slightly above the prior 5-year average. U.S. soybean exports are forecast at 1.98 billion bushels, down 40 million from 2022/23 with strong competition from increasing South American production and limited gains in global import demand. U.S. ending stocks for 2023/24 are projected at 335 million bushels, up 120 million from the revised 2022/23 forecast. Soybean and product prices are all forecast lower for 2023/24. The 2023/24 U.S. season-average soybean price is forecast at $12.10 per bushel compared with $14.20 per bushel in 2022/23.

Wheat

The 2023/24 outlook for U.S. wheat is for reduced supplies and exports, increased domestic use, and smaller stocks compared with 2022/23. U.S. wheat supplies are forecast lower than last year with smaller beginning stocks and only slightly larger production. All wheat production is projected at 1,659 million bushels, up modestly from last year on increased harvested area. However, the harvest-to-plant ratio is down from last year with above-average abandonment in Texas, Oklahoma, and Kansas. The all wheat yield, projected at 44.7 bushels per acre, is 1.8 bushels lower than last year. The first survey-based production forecast for 2023/24 winter wheat is up 2 percent from last year as higher Soft Red Winter production more than offsets a decline in Hard Red Winter and White wheat. Total 2023/24 domestic use is projected at 1,112 million bushels, up 1 percent from last year, primarily on increased feed and residual use. Exports are projected at 725 million bushels, 50 million lower than last year. Ending stocks are projected 11 percent lower than last year and the lowest in 16 years. The projected 2023/24 season-average farm price is $8.00 per bushel, down $0.85 from last year’s record.

Managing and Scouting Fields for Fusarium Head Blight

Alyssa Koehler, Extension Field Crop Pathologist | akoehler@udel.edu
University of Delaware

Wheat anthesis (flowering) is underway and will be continuing for the next 1-2 weeks across the region. Up until the rains this past weekend, we have been at low FHB risk. We are currently tracking as medium-high risk for very susceptible varieties and low-medium risk for varieties with some level of resistance (Figure 1). If you are planning for wheat fungicide application, scout frequently, looking for yellow anthers in the center of the wheat head (Figure 2) to signal that flowering has begun (Feekes 10.5.1). Depending on the weather, we can usually expect flowers to start showing up on wheat heads 3-5 days after full head emergence, with cool weather this can stretch this process out to 7-10 days. Anthers can remain attached after flowering, but become a pale white. For best mycotoxin (DON) control, it is better to be at flowering or a few days beyond than to spray too early when heads are not out yet (especially those secondary tillers). Fungicide products should be applied at the manufacturers recommended rate with nozzles angled 30-45° from horizontal (30 degrees is better than 45). Nozzles angled both forward and backward or twinjet nozzles that spray in two directions give better contact with the head and increase fungicide efficacy. For ground sprays, fungicides should be applied in at least 10-15 gallons of water per acre; aerial applications are recommended at 5 gallons per acre.

Figure 1. FHB Risk Model for very susceptible (top) and susceptible varieties (bottom) May 3, 2023 (wheatscab.psu.edu).
Figure 2. Wheat at flowering (Feekes 10.5.1) with yellow anthers visible 3-4 days after heads emerge.

Once wheat has flowered, symptoms of FHB are usually visible in 18-24 days, but cool weather can slow symptom development. Heads with FHB will have bleached florets or bleached sections of the head and may have pink growth on spikelets. Glume blotch may also be present, but typically has more of a grey appearance. You can follow these steps to assess the severity of FHB present in your field.

  1. For every 10 acres of field, randomly select one spot to survey.
  2. Keeping your line of sight above the wheat heads, walk 40-50 yards and randomly pick 10-20 heads to look at on the plant or detach and place into a bag. (Looking down may bias the heads you select).
  3. Once you have randomly collected the heads, rate the percent of each head with symptoms of FHB (bleaching or pink growth on spikelets). You can use the scale below to help calibrate your eye (next page).
  4. After you have recorded values for each head, determine the average percent FHB severity by dividing the sum of disease severities by the total number of heads collected. (Ex. You rate 10 heads with severity values: 0%, 10%, 30%, 0%, 0%, 20%, 10%, 0%, 0%, 0%. These add up to 70. 70/10 heads = 7% overall FHB severity). Higher levels of FHB are typically associated with elevated levels of DON and possible issues with yield and test weight. It is possible to have delayed or lower levels of symptoms and still have DON.
  5. Repeat this assessment as needed to get an overall rating for the field. Fields with greater than 10% FHB severity are at higher risk for yield losses or elevated DON. Fields with elevated DON should be harvested as early as possible and you may want to consider increasing combine fan speeds and shutter openings to reduce the amount of scabby kernels harvested. 

April 2023 Grain Markey Update

Dale Johnson, Farm Management Specialist
University of Maryland

Information from USDA WASDE report

Attached is the summary for the April 2023 WASDE.

Corn

This month’s ‘22/23 U.S. corn outlook is for reductions to imports and food, seed, and industrial (FSI) use, with unchanged ending stocks. Corn imports are lowered 10 million bushels based on observed trade to date. Feed and residual use is unchanged at 5.275 billion based on indicated disappearance during the December-February quarter. FSI is lowered 10 million bushels reflecting cuts to corn used for glucose and dextrose and starch. With supply and use falling by the same amount, ending stocks are unchanged at 1.342 billion bu. The season-average price is unchanged at $6.60 per bu.

Soybeans

U.S. soybean supply and use forecasts for ‘22/23 are unchanged relative to last month. Soybean and soybean meal prices are also unchanged. The soybean oil price is projected at 64.0 cents per pound, down 2 cents. Global ‘22/23 soybean supply and demand forecasts include lower production, crush, and exports. Global soybean production is reduced 5.5 million tons to 369.6 million. Lower crops for Argentina and Uruguay are partly offset by higher production for Brazil. Soybean production for Argentina is lowered 6.0 million tons to 27.0 million on hot and dry weather conditions through March. Uruguay production is lowered 0.9 million tons to 1.2 million on a lower harvested area and yield. Partly offsetting is higher production for Brazil,  increased 1.0 million tons to 154.0 million on higher area. Soybean crush is lowered on reduced supplies and slow pace to date for Argentina, China, Bangladesh, Pakistan, and Egypt. Crush for Argentina is reduced 3.3 million tons to 32.0 million leading to lower product exports. Partly offsetting is higher crush and higher soybean oil and meal exports for Brazil. Soybean exports are lowered 0.4 million tons to 168.0 million on lower exports for Uruguay. Imports are lowered for Bangladesh, Egypt, and Pakistan and raised for Argentina. Soybean ending stocks are raised fractionally with higher stocks for China and Brazil that are mostly offset by lower stocks for Argentina.

Wheat

The outlook for ‘22/23 U.S. wheat this month is for slightly higher supplies, reduced domestic use, unchanged exports, and increased ending stocks. Supplies are raised 5 million bushels on higher imports, based on the pace of Census imports reported to date. Domestic use is lowered 25 million bushels on reduced feed and residual use, which is decreased to 55 million. The downward revision is based on the implied disappearance for the second and third quarters indicated in the NASS Grain Stocks report. Wheat exports remain at 775 million bushels but there are offsetting by-class changes for White and Hard Red Spring exports. Projected ‘22/23 ending stocks are raised 30 million bushels to 598 million but are still 14% below last year. The ‘22/23 season-average farm price is forecast $0.10 per bushel lower at $8.90, based on NASS prices reported to date and expectations for cash prices for the remainder of ‘22/23. The global wheat outlook for ‘22/23 is for increased supplies, higher consumption, and reduced trade and stocks. Supplies are raised 0.7 million tons to 1,061.1 million, primarily on higher beginning stocks for Syria and increased production for Ethiopia. Global consumption is increased 2.9 million tons to 796.1 million, mainly on higher food, seed, and industrial use for India, and increased feed and residual use for China and the EU. World trade is lowered 1.2 million tons to 212.7 million on reduced exports by the EU, Argentina, and Brazil more than offsetting increases for Russia and Ukraine. China’s wheat imports are raised 2.0 million tons to 12.0 million, which would be the highest imports for China since 1995/96. China’s imports are raised on strong imports to date, particularly from Australia; China is now the leading 2022/23 global wheat importer. Projected 2022/23 world ending stocks are lowered 2.1 million tons to 265.1 million, the lowest since 2015/16. This month, India, the Philippines, and Ukraine are projected to have lower stocks, more than offsetting increases for Syria, the EU, and the United States.

Managing Fusarium Head Blight in Small Grains: Symptoms, Favorable Environments, and Disease Management Strategies

Seyedali Hosseinrad, Nidhi Rawat, Nicole Fiorellino, and Vijay K. Tiwari
Department of Plant Science and Landscape Architecture, University of Maryland, College Park

Fusarium Head Blight of wheat and barley

Fusarium head blight (FHB) is a severe fungal disease that affects small grains, wheat and barley. It is particularly problematic in regions with wet and warm springs, such as the Mid-Atlantic region. FHB is caused by several species of Fusarium, F.  graminearum being the most common in the USA.

Symptoms and signs: The disease primarily attacks the wheat and barley heads, or spikes, at flowering. Early symptoms of FHB include the appearance of small, water-soaked lesions on the glumes and awns of the heads. As the infection progresses, these lesions become larger, and the spikelets (sections of the heads) become brown and dry progressively (Figure 1a, b). In particularly conducive weather conditions, the spikelets may take on a pink or reddish color due to a mass production of fungal spores called sporodochia on the glumes. The disease causes the kernels to shrink or abort, leading to reduced yield, poor-quality grain, and in severe cases, crop failure (Fig. 1 c). In addition, the fungus also produces mycotoxins, such as Deoxynivalenol (DON), which is toxic for human and animal consumption. The epidemiology of FHB is complex and multifaceted and can be influenced by various factors, including weather conditions, crop management practices, and genetic susceptibility.

Figure 1. FHB symptoms on wheat and barley. A.) Wheat heads showing brown and bleached spikelets indicated by yellow arrows. B.) A malting barley spike showing bleached spikelets. C.) Fusarium damaged kernels.

Factors affecting FHB

Weather conditions play a major role in determining the severity of FHB in field conditions. The disease thrives in warm, wet environments and is severe in areas with high humidity and frequent rainfall. Wet weather conditions during the flowering stage of wheat development provide an ideal environment for the fungus to infect and proliferate on the developing grain heads. In particular, warm and humid weather between heading and anthesis (flowering) is highly conducive to FHB infection. Warm temperatures between 70 and 80°F are favorable for fungal growth and production of mycotoxins.

Crop management practices can also contribute to the development and spread of FHB in winter wheat. Practices such as reduced tillage and corn-wheat rotation can increase the risk of FHB infection. Reduced or no-tillage can leave plant debris on the soil surface, providing a potential source of inoculum for the fungus. At the same time, corn acts as a secondary host of the pathogen, allowing the fungal inoculum to build up in the soil over time.

Management of FHB

Effective management of FHB in winter wheat typically involves using an integrated disease management approach that incorporates a combination of cultural, chemical, and biological control measures.

Use of FHB-resistant varieties: One of the most important cultural practices for reducing FHB infections in wheat is the selection of resistant cultivars. Several wheat varieties have been developed with genetic resistance to FHB. In fact, the UMD small grain pathology program, in collaboration with the small grain breeding program, tests upward of 60 regional commercial varieties in their misted nursery in replicated trials every year to provide growers with a robust assessment of the levels of the genetic resistance of these varieties to FHB (https://psla.umd.edu/extension/md-crops). It is highly advisable for regional farmers to refer to these ratings for making their planting decisions to reduce the severity of infections in their crops.

Due to the importance of FHB in the Mid-Atlantic region, developing FHB-resistant varieties is one of the primary goals of the MD small grain breeding program, in addition to their yield and quality. Resistance to FHB is a complex genetic trait and is influenced by a range of genetic factors. So, any breeding program targeting to incorporate a high level of genetic resistance in their varieties has to pyramid several genes toward that goal. However, a high level of genetic resistance in barley is difficult to achieve on account of the lack of resistance genes available in it.

Chemical control: The use of fungicides is a key component of FHB management in wheat and barley. Fungicides can effectively reduce the severity of infections and minimize the production of mycotoxins. Fungicides with Group 3 and 7 FRAC code ingredients have been successful in controlling FHB. FRAC group 11 fungicides should not be applied for FHB, as there are reports of them increasing DON content in the grains. Several effective chemistries with a mix of active ingredients against FHB have recently been released by manufacturers, such as Prosaro-Pro and Prosaro by Bayer, Miravis-Ace by Syngenta, and Sphaerex by BASF. All these fungicides have been tested by the UMD Small grain pathology program and are found to be equally effective when sprayed at anthesis.

In addition to the chemistry of the fungicide, the timing of spraying is very critical in managing FHB. Spraying fungicides at anthesis (when yellow anthers pop out of the wheat heads) in wheat and heading in barley is important. As weather plays a major effect in determining the severity of FHB infection, the risk of FHB can be predicted with a significant correlation with conducive weather conditions. In conjunction with the US Wheat and Barley Scab Initiative, the MD small grain program releases FHB risk commentaries for growers registered with the FHB risk prediction website (https://www.wheatscab.psu.edu/). The growers are advised to register on this website to receive the alerts on their cell phones as text messages with advice on spraying decisions for FHB.

Biological control: Some biological control agents, such as bacterial and fungal species antagonistic to FHB, are available with the claims of reducing disease severity and mycotoxin production. However, the efficacy of these biological control agents is not high yet. Researchers at UMD are testing some new promising biological products currently under development, especially for the organic growers of the region.

Crop Rotation and Tillage: Other important cultural practices include crop rotation and tillage. Planting non-host crops such as soybeans in rotation with wheat can help reduce the amount of FHB inoculum in the soil, as corn is a secondary host of the pathogen and can increase inoculum build-up in the soil for the wheat crop. Reduced tillage practices that manage crop residue on the soil surface with minimal disturbance to the soil are helpful in reducing the amount of infected crop residue on the soil surface while minimizing soil erosion and loss.

Post-harvest management: Post-harvest management practices, such as grain cleaning and drying, can help to screen the Fusarium damaged kernels that are expected to have high levels of mycotoxin contamination in the harvested grain. Cleaning equipment such as air screen cleaners or gravity tables can remove lightweight and damaged kernels. Drying grain to a moisture content of 14% or lower as soon as possible after harvest can also help minimize mycotoxin contamination. The fungus may continue mycotoxin production at high moisture conditions in storage. Proper storage conditions, such as cool and dry storage facilities, can also help to prevent mycotoxin contamination during storage.

Fusarium head blight (FHB) is a significant fungal disease affecting wheat and barley crops in the Mid-Atlantic region, causing yield and quality losses. Small grain pathology and breeding programs are working on multipronged approaches to reduce FHB impact, such as using fungicides, developing resistant cultivars, and adopting cultural practices such as crop rotation and tillage management. Also, research and innovation are crucial to ensure the region’s long-term sustainability of wheat production.

For more information:

Gillum, M., & Van Sanford, D. (2023). Understanding the Effect of Fusarium Head Blight Resistance on Agronomic Characteristics of Soft Red Winter Wheat.

Singh, L., Wight, J.P., Crank, J., Thorne, L., Erwin, J.E., Dong, Y., Rawat, N. (2021). Evaluation of application timing of Miravis-Ace for control of Fusarium head blight and DON content in wheat. Plant Health Progress. 22: 94-100.

Singh, L., Wight, J.P., Crank, J., Thorne, L., Dong, Y., Rawat, N. (2020). Efficacy assessment of a new fungicide, Miravis Ace, for control of

October 2022 Grain Market Report

Dale Johnson, Farm Management Specialist
University of Maryland

Information from USDA WASDE report
Attached is the summary for the October 2022 WASDE.


Corn

This month’s 2022/23 U.S. corn outlook is for reduced supplies, greater feed and residual use, lower exports and corn used for ethanol, and smaller ending stocks. Corn production is forecast at 13.895 billion bushels, down 49 million on a reduction in yield to 171.9 bushels per acre. Corn supplies are forecast at 15.322 billion bushels, a decline of 172 million bushels from last month, as lower production and beginning stocks are partially offset by higher imports. Exports are lowered 125 million bushels reflecting smaller supplies and slow early-season demand. Projected feed and residual use is raised 50 million bushels based on indicated disappearance during 2021/22. Corn used for ethanol is lowered 50 million bushels. With supply falling more than use, corn ending stocks for 2022/23 are cut 47 million bushels. The season-average corn price received by producers is raised 5 cents to $6.80 per bushel. 

Soybeans

Soybean production is forecast at 4.3 billion bushels, down 65 million on lower yields. Harvested area is unchanged at 86.6 million acres. The soybean yield is projected at 49.8 bushels per acre, down 0.7 bushels from the September forecast. With lower production partly offset by higher beginning stocks,
supplies are reduced 31 million bushels. Soybean exports are reduced 40 million bushels to 2.05 billion with increased competition from South America. With lower exports partly offset by increased crush, ending stocks are unchanged from last month at 200 million bushels. The U.S. season-average soybean price for 2022/23 is forecast at $14.00 per bushel, down 35 cents.

Wheat

The outlook for 2022/23 U.S. wheat this month is for lower supplies, domestic use, exports, and stocks. Supplies are reduced on lower 2022/23 production based on the NASS Small Grains Summary that indicated reductions in both harvested area and yield. This lowered production by 133 million bushels to 1,650 million, leaving production only minimally higher than last year. Partially offsetting the production decline are higher projected imports, raised 10 million bushels to 120 million, all for Hard Red Spring. Annual feed and residual use is lowered 30 million bushels to 50 million, based on first quarter disappearance, as indicated in the NASS Grain Stocks report. This is the lowest first quarter total disappearance since 1983/84. Wheat exports are lowered 50 million bushels to 775 million on reduced supplies, slow pace of export sales, and continued uncompetitive U.S. export prices. This would be the lowest U.S. wheat exports since 1971/72. Projected ending stocks are lowered 34 million bushels to 576 million, which would be the lowest since 2007/08. The season-average farm price is raised $0.20 per bushel to $9.20 on reported NASS prices to date and expectations for futures and cash prices for the remainder of 2022/23.

September 2022 Grain Market Summary

Dale Johnson, Farm Management Specialist
University of Maryland

Information from USDA WASDE report
Attached is the summary for the September 2022 WASDE.


Corn

This month’s 2022/23 U.S. corn outlook is for lower supplies, smaller feed and residual use, reduced exports and corn used for ethanol, and tighter ending stocks. Projected beginning stocks for 2022/23 are 5 million bushels lower based on essentially offsetting export and corn used for ethanol changes for 2021/22. Corn production for 2022/23 is forecast at 13.9 billion bushels, down 415 million from last month on reductions to harvested area and yield. The national average yield is forecast at 172.5 bushels per acre, down 2.9 bushels. Harvested area for grain is forecast at 80.8 million acres, down 1.0 million. Total U.S. corn use is cut 250 million bushels to 14.3 billion. Feed and residual use is lowered 100 million bushels based on a smaller crop and higher expected prices. Exports are cut 100 million bushels to 2.3 billion while corn used for ethanol is lowered 50 million to 5.3 billion. With supply falling more than use, ending stocks are down 169 million bushels to 1.2 billion. The season-average corn price received by producers is raised 10 cents to $6.75 per bushel.

Soybeans

U.S. soybean supply and use changes for 2022/23 include higher beginning stocks and lower production, crush, exports, and ending stocks. Higher beginning stocks reflect a lower export forecast for 2021/22. Soybean production is projected at 4.4 billion bushels, down 152 million with lower harvested area and yield. Harvested area is down 0.6 million from the August forecast. The soybean yield forecast of 50.5 bushels per acre is down 1.4 bushels from last month. The crush forecast is reduced 20 million bushels and the soybean export forecast is reduced 70 million bushels on lower supplies. Ending stocks are projected at 200 million bushels, down 45 million from last month. The U.S. season-average soybean price is forecast at $14.35 per bushel, unchanged from last month. Soybean meal and oil prices are also unchanged at $390 per short ton and 69.0 cents per pound, respectively. Other changes this month include lower peanut and higher cottonseed production.

Wheat

The 2022/23 U.S. wheat outlook for supply and use is unchanged this month. The projected 2022/23 season-average farm price (SAFP) is lowered $0.25 per bushel to $9.00 on reported NASS prices to date and expectations for cash and futures prices the remainder of 2022/23. Despite the decline, $9.00 per bushel would remain a record SAFP.