This blog post is coauthored with Kevin Ankney (Georgetown University), Benjamin Leard (University of Tennessee), and Virginia McConnell (Resources for the Future).
Last month, the National Highway Traffic Safety Administration (NHTSA) and the US Environmental Protection Agency (EPA) released new fuel economy and greenhouse gas (GHG) emissions standards, respectively, for passenger cars and light trucks. These standards, which we discuss in the first article of a new blog series on the standards, aim to replace the Trump administration’s fuel economy rules, which rolled back the Obama standards for 2021–2025.
EPA and NHTSA have found that the proposed standards are expected to improve social welfare, as measured by the difference between benefits and costs associated with the policy change. These government agencies each performed an independent regulatory impact analysis of the respective proposed rules, for which they calculated the expected costs and benefits based on computations from simulation models. Table 1 summarizes the costs and benefits of the GHG standards under different assumptions made in EPA’s analysis about the discount rate. The discount rate is important here, given that the agencies measure costs and benefits through 2050.
Table 1. Costs, Benefits, and Net Benefits of the Proposed Greenhouse Gas Emissions Standards from the US Environmental Protection Agency (2018$ billions)
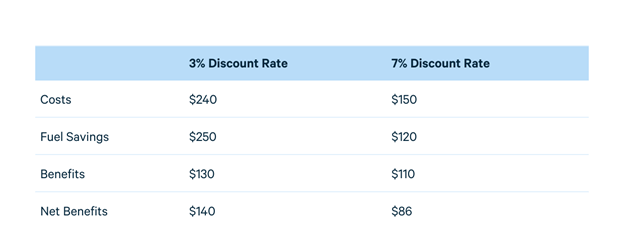
Note: These values are based on Table 4 of EPA (2021): “Revised 2023 and Later Model Year Light-Duty Vehicle Greenhouse Gas Emissions Standards” regulatory impact analysis.
With a 3 percent discount rate, the standards pay for themselves, as the associated fuel cost savings ($250 billion) exceed the costs of installing fuel-saving technology ($240 billion) (Table 1). This outcome raises a question: If the standards pay for themselves, then why does the vehicle market fail to adopt the technologies on its own, without regulation? This phenomenon, coined “the energy efficiency gap” or “the energy paradox,” has been a subject of debate by policymakers and economists for more than a decade, and plenty of research aims to understand consumer decisions about energy-saving technologies.
The analysis of the costs and benefits of President Joe Biden’s proposed standards draws on the research that models consumer and vehicle manufacturer behavior regarding energy savings. EPA and NHTSA assume that consumers, when purchasing a vehicle, value only the first 30 months (or 2.5 years) of fuel cost savings that come from the adoption of fuel-saving technology, such as the addition of a turbocharger to a vehicle’s engine. The agencies refer to the 30 months of fuel savings as the “payback period.”
The agencies functionally assume that consumers do not value fuel cost savings beyond 30 months when making purchase decisions, even though fuel-saving technologies yield savings in fuel costs over the entire lifetime of a vehicle. This may seem odd, given that the first 30 months of savings correspond to only about 25 percent of lifetime fuel costs. Thus, the agencies are assuming an energy efficiency gap.
The agencies assume that manufacturers will adopt fuel-saving technologies that are cost-effective for the assumed payback period, even in the absence of fuel economy regulations. But stricter regulations mean that additional technologies will be needed, and those technologies may not pay for themselves over 30 months. As manufacturers install new technologies to meet new regulations, fuel savings will apply to the entire lifetime of vehicles, which can stay on the road for up to two decades—and not just the 30-month payback period. So, when new standards require an increase in fuel economy (or an equivalent reduction in GHG emissions), the associated savings in lifetime fuel costs are likely to exceed the costs of installing new technology. The estimated difference between the savings in lifetime fuel costs and the costs of installing new technology represents gains in private welfare (i.e., changes in welfare that are independent of external costs and benefits like air pollution) (Tables 1 and 2).
The extent of these private welfare gains is influenced by assumptions about the length of the payback period. For example, suppose a manufacturer is considering the addition of a fuel-saving technology such as advanced transmission in one of its vehicles. The present value of savings in lifetime fuel costs associated with advanced transmission is $2,500. The cost of adding the technology, which includes manufacturing and installation costs, is $1,000. This technology thus “pays for itself” over the vehicle’s lifetime because the savings in fuel costs exceed the costs of installation. Similarly, if the standards force the manufacturer to adopt the advanced transmission, then the standards will lead to $1,500 of net benefits, which are equal to the difference between the lifetime fuel cost savings ($2,500) and the installation costs ($1,000).
However, assuming a payback period of 30 months, the savings in fuel costs amount to only $750. Therefore, in the absence of regulation, a manufacturer will not adopt the technology if consumers value only the first 30 months of fuel costs (amounting to $750 of savings in this case), given that the $1,000 cost of manufacturing and installation exceeds the consumer demand for the technology.
Assuming instead a longer payback period of 60 months yields expected savings in fuel costs ($1,250) that exceed the cost of adding the technology ($1,000), and the advanced transmission would be adopted by manufacturers even in the absence of regulation. The associated welfare benefits in this case could not be counted as part of the benefits of the fuel economy or GHG standards, as the technology would be adopted in the market regardless of regulations.
The regulatory impact analysis performed by NHTSA for the proposed fuel economy standards reaches this very conclusion. Table 2 displays the costs, benefits, and net benefits of the standards, depending on the length of the payback period. The first row is a baseline “reference case,” which assumes a 30-month payback period—consistent with the current methods employed by EPA and NHTSA. The second row assumes a 60-month payback period.
Table 2. Costs, Benefits, and Net Benefits of the Proposed Fuel Economy Standards from the National Highway Traffic Safety Administration, Model Year 2039 (2018$ billions)
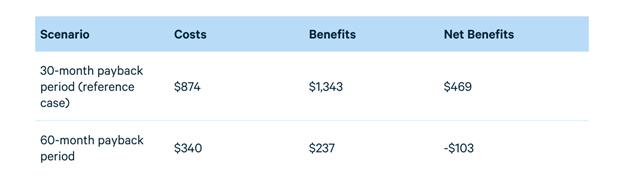
Notes: These values are based on Table 6-9 of NHTSA (2021): “Preliminary Regulatory Impact Analysis: Proposed Rulemaking for Model Years 2024-2026 Light-Duty Vehicle Corporate Average Fuel Economy Standards.” Data show the private welfare gains (changes in welfare that are independent of external costs and benefits) under selected scenarios, relative to the no-action alternative, at a 3 percent discount rate. Benefits and costs are lower if a longer payback period is applied, because a profit-maximizing manufacturer is assumed to have already adopted fuel-saving technologies even in the absence of regulations.
With a 60-month payback period, costs and benefits are lower, as the difference between business-as-usual fuel-saving technology adoption and the proposed standards is smaller (Table 2). Moreover, the net benefits are generally smaller, even negative, when we assume a 60-month payback period.
The results might sound counterintuitive, but here’s why: Modeling assumes that, in the absence of regulation, manufacturers will only invest in technology that pays for itself in 30 months. In this case, the standards have high costs and high benefits because lots of additional fuel-saving technologies are added that would not have been in the absence of standards. However, if the payback period is assumed to be 60 months, then a profit-maximizing manufacturer would adopt fuel-saving technologies even if no regulations existed. So, any standards that assume a 60-month payback period will have lower benefits and lower costs relative to standards that assume a shorter payback period. Thus, in this case for model year 2039, net benefits flip from positive to negative with a 30-month payback period and a 60-month payback period, respectively (Table 2).
NHTSA justifies the assumption of a 30-month payback period in its regulatory impact analysis of the proposed standards:
Our use of the 30-month payback assumption is based on statements manufacturers have made to us and to [committees related to fuel economy at the National Academies of Sciences, Engineering, and Medicine]. It is also based on the fact that repeated assessments of the potential for technology to improve fuel economy have consistently found a substantial potential to cost-effectively increase fuel economy. But it is also partly based on the fact that the substantial literature that has endeavored to infer consumers’ [willingness to pay] for fuel economy is approximately evenly divided between studies that support severe undervaluation and those that support valuation at approximately full lifetime discounted present value … The most recent studies based on detailed data and advanced methods of statistical inference have not resolved the issue.
Over the past decade, economic research has made substantial progress in identifying payback periods implied from vehicle purchases. Table 3 includes recent estimates from research studies that use highly detailed transaction price or sales data to infer consumer demand for vehicle fuel economy, fuel cost savings, and implied payback periods.
Table 3. Recent US-Based Estimates for Willingness to Pay for Vehicle Fuel Cost Savings
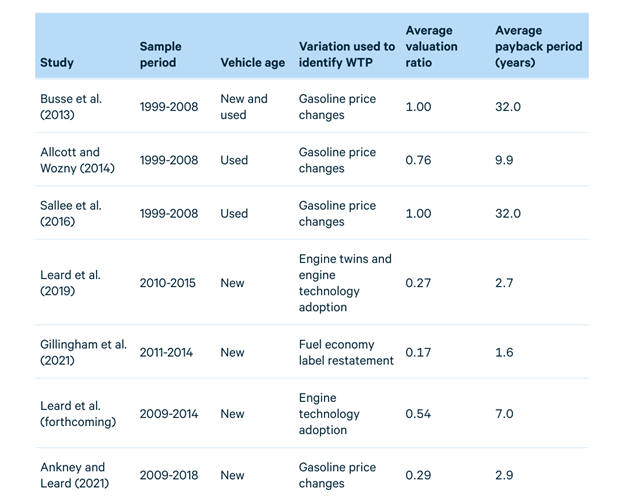
Note: The average payback period is based on the valuation ratio, assumed vehicle lifetime, vehicle miles traveled, and the discount rate. We assume a vehicle lifetime of 32 years.
The first three studies consider variation in gasoline prices during a period of rapidly increasing gas prices. Those three studies find nearly full valuation of fuel costs, as represented by a valuation ratio close to one. The remaining four studies, however, find substantial undervaluation of fuel costs, with average valuation ratios equal to 0.54 or less and implied payback periods ranging from 1.6 to 7 years. NHTSA’s assertion that existing research on payback periods is “approximately evenly divided between studies that support severe undervaluation and those that support [full] valuation” rings true when looking at these recent studies.
Nevertheless, uncertainty about consumer demand does not justify the adoption of a payback period on the lower end of the range. Earlier studies strongly suggest that a much longer payback period should be adopted, while more recent studies tend to support a payback period in the range of 2–5 years (24–60 months). If anything, these studies suggest that a slightly longer payback period might be more appropriate.
The choice of payback period length clearly has an impact on the benefit-cost analysis of regulations, including the recent proposals for strengthening fuel economy and GHG standards. The use of an appropriate payback period is critical in determining whether and to what extent proposed regulations improve consumer welfare.
This post also appears on Resources for the Future’s Common Resources blog.