Ag Commodity Markets: Review and Outlook

Mark Townsend, Agriculture Agent Associate | mtownsen@umd.edu
University of Maryland Extension, Frederick County

Grain markets have slid significantly from the highs posted last summer that followed the perceived drought in the Midwest.
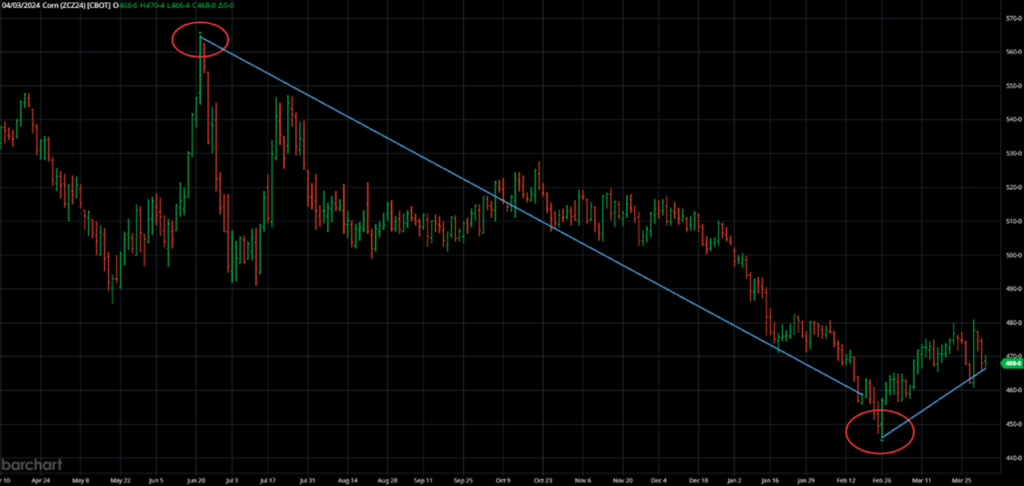
Image Credit: Barchart: December ‘24 Corn Contract from June 2023 to April 3, 2024.

Unfortunately, these drought concerns were generally unfounded as key growing areas received timely rains to keep yields from suffering in the corn belt. In fact, the U.S. set a new corn production record at 15.234 billion bushels topping the previous record set in 2016 at 15.148 billion bushels. The trifecta of a record large U.S. crop, a large Brazilian corn crop, as well as underwhelming domestic and export demand sent prices spiraling lower from August 2023 to February 2024. The March ‘24 Corn contract traded at three-year lows on February 26th dipping below $4 following 11 consecutive week-over-week price declines.

Soybeans were unfortunately no better, falling $2.90 from their summer high ($14.18) to their low ($11.28) in the March ‘24 contract. Much of the same stories plagued this market including an unrealized weather rally and outstandingly large South American production that punished U.S. export demand.

To add insult to injury, “the Funds”—traders in the market who manage money for clients as either hedges or other investment strategies hit a record 340,732 net short position in the corn market on February 20th. Simply stated, these traders placed the largest-ever bet on corn prices continuing to decline, which has placed a metaphorical wet-blanket on any hopes of a rally.

Today

Grains have rallied from the end of February and throughout March. The inflection point was the last day of notice for March hedge-to-arrive (HTA) contracts. To that point, sellers (farmers, dealers, etc.) had the choice of pricing corn at current prices or “rolling” the contract to the May contract. The bleak outlook forced many hands and stimulated selling which pulled prices lower until the selling pressure was over.

Since then, both the corn and soybean markets have rallied off the lows and recovered to price levels previously seen in early February. The upward momentum has been driven by a phenomenon known as “short covering” that creates a positive feedback loop–the more it happens, the more it happens. As prices rise, “The Funds” in their net short position lose money as their bet has turned against them. To stop this, they must exit their position by buying a contract to offset the one they previously sold1. The buying stimulates further price increases that induce another fund manager having to offset their short position. At its extreme, this feedback loop can throw prices to astronomical levels2. In this case, the bump is a welcomed change but is unlikely to send us much higher for now.

More recently, the USDA released its Prospective Plantings Report compiled from surveys asking farmers their planting intentions this season. The report suggests growers will plant 90 million acres of corn and 86 million acres of soybeans, indicating that growers are shifting acres away from corn to soybeans. This was unsurprising, however traders found this as good news as the nearby contracts in both markets traded higher the day of the report. However, traders are generally wary of this recent report given the low farmer response rate and the tendency for acreage figures to climb with subsequent USDA planting reports.
Season Outlook:

The saying, “all models are wrong, but some are useful” may hold true for commodity market predictions as well; there is a significant degree of uncertainty in any market that can render any forecast absolutely incorrect. As such, this is not meant to be a forecast but more of an observation of trends and conditions that may prove useful.

Supply and Demand Fundamentals
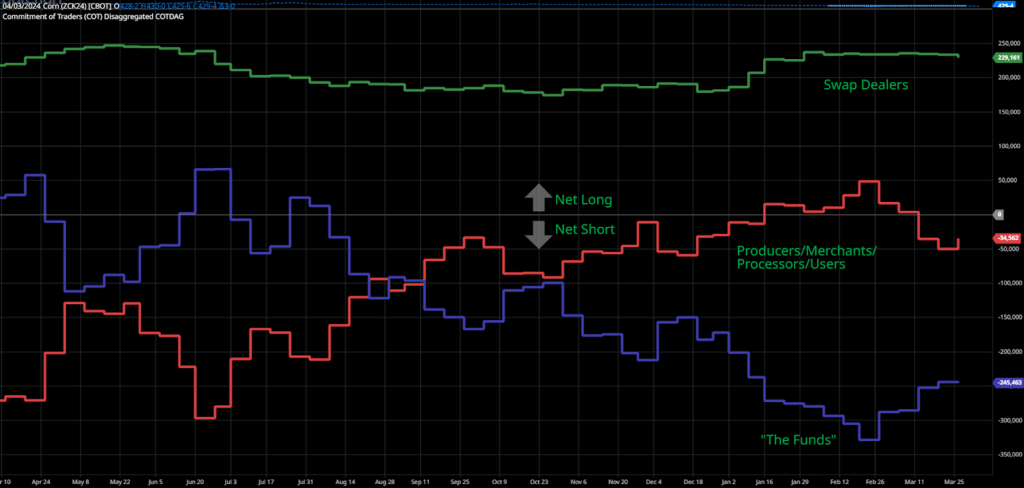
Image Credit: Barchart. CFTC Commitment of Traders in the Corn Market (all contracts).

Every market most fundamentally relies on the interplay between supply and demand. Currently in the grains, supply has outstripped demand. Following last year’s record crop, U.S. corn supply is almost burdensome.

A common metric that evaluates how efficiently we use the crop we grow is the Ending Stocks-to-Use (S/U) ratio derived from the USDA World Agricultural Supply and Demand Estimate (WASDE) each month. Currently, the USDA projects the 2024/25 ending stocks (that which we will not use from the crop we’re about to plant) at 2.53 billion bushels and an S/U ratio of 17.2%–a level we have not seen since the 2006 when corn traded at an average price of $2.62/bu. This current 2023/24 marketing year (ending Sept. 1, 2024) is currently pegged at 14.9% S/U ratio–well higher than the 7-10% range of the last three years and the 12.6% historical average.

The soybean side of things is only marginally better and certainly not rosy by any stretch. The current S/U ratio projection for this year’s crop is 9.9% with the current marketing year sitting at 7.6%. Both these figures are a far cry from the burdensome supplies we accrued during the 2018-2019 trade war with China (22.9% S/U) yet they signal a surplus of soybeans.

Market Movers

With the current fundamentals dreary at best, it’s pleasant to think of those things that could actually help prices higher.

  1. Midwestern drought conditions continue to worsen throughout the growing season. US weather conditions are a significant driver of price action in the growing season–as exemplified by last year. Currently, some of the Midwest is experiencing a moderate drought, with some agronomists questioning the subsoil moisture levels before planting. Importantly, drought conditions would have to persist throughout the growing season well past planting. Generally, drought is bearish to corn in April and May as Midwest growers can plant at a breakneck pace just in time for timely rains that pull yields higher and prices lower. As evidenced by last year, corn did not rally until late-May over weather concerns and in 2012, corn did not rally until mid-June. Both these years indicate that prices will likely stay mixed until real concern over crop condition emerges during the growing season.
  2. The South American (Brazil + Argentina) soybean production is lower than expected, improving export demand for U.S. soybeans. Soybean harvest in Brazil is nearing completion, however final production estimates remain volatile. The same is true with South American corn production: a supply-side shock could support U.S. corn prices. Brazil has completed corn planting this last week of its large safrinha corn crop. Currently, much of the key corn growing regions are in a minor drought or have experiences greater than normal rainfall. More serious and persistent crop-damaging weather events could certainly be a boon to the U.S. market.
  3. Recently, the Federal Reserve signaled that it will likely keep the Federal Funds rate higher for longer–increasing borrowing costs. If this holds true, investors may find themselves less attracted to debt and equity markets as companies may have a more difficult time generating earnings. Instead, investors may revert back to commodities–a market often seen as a hedge against inflation–as they did in 2022. As mentioned above, this may trigger a significant unwinding of short positions which could carry the market to higher prices. Unfortunately, this is likely the most unlikely scenario for increasing commodity prices as equities soar to all time highs in recent weeks.

So What Can We Do About It? 

Marketing grain in 2024 will likely be challenging on all fronts. Put another way, given the current outlook, it is incredibly unlikely that selling grain in the fall at harvest prices will be a winning strategy. Similarly, it’s unlikely that an unhedged, unpriced JFM ‘25 sale will offer anything better as there are additional storage costs involved. That said, developing a preharvest marketing strategy may very well be a key to success this marketing season. Betting on the aforementioned weather stories is hardly a marketing plan.

Like every year the first step is knowing your cost of production inside and out. Marketing opportunities will present themselves, but it will take knowing what is and what is not a good price. With today’s relatively high input costs, “yielding your way out” of low prices is more challenging than previous years. Therefore it may be more crucial than ever to make judicious agronomic decisions.

Take advantage of seasonal market patterns. Generally speaking, we see 3-6% increase in corn and soybean prices between mid-March and late-May from their post-harvest lows in January. As old crop marketing wanes, and concerns over the current year’s crop emerges (like the weather), prices rise slowly during this time. It may be best to price some grain sooner rather than later to take advantage of this general trend. Put it more directly; from May 1st to October 1st, corn prices fall more than $0.30, 74% of the time. Would you bet on something weighted 75% against you?

Track local basis. Generally, basis tends to follow broader market conditions especially when it comes to spreads between nearby and more distant contracts. Seasonal trends in basis also exist with harvest often being the low point and spring generally higher.

Keep a watchful eye on the markets this season. It may be such that prices are favorable for a day or two before they fall back lower.

Please also consider attending a University of Maryland Extension grain marketing meeting. These meetings are filled with all the above strategies, general information, and more that could help you with your marketing decisions.

Best of luck to you all. Here’s to blue skies and high prices!

Footnotes & References:

1 This may seem counter-intuitive. For a review on futures contracts please visit CME’s Self Study Guide to Hedging with Grain and Oilseed Futures and Options.

2 https://en.wikipedia.org/wiki/GameStop_short_squeeze

October 2023 Grain Market Update

Information from USDA WASDE report

Attached is the summary for the October 2023 WASDE.

Corn

This month’s 2023/24 U.S. corn outlook is for reduced supplies, lower feed and residual use and exports, and smaller ending stocks. Corn production is forecast at 15.064 billion bushels, down 70 million on a cut in yield to 173.0 bushels per acre. Corn supplies are forecast at 16.451 billion bushels, a decline of 160 million bushels from last month, with lower production and beginning stocks. Exports are reduced by 25 million bushels reflecting smaller supplies and slow early-season demand. Feed and residual use is down 25 million bushels based on lower supply. With supply falling more than use, corn ending stocks for 2023/24 are lowered 110 million bushels. The season-average corn price received by producers is raised 5 cents to $4.95 per bushel.

Soybean

Soybean production is forecast at 4.1 billion bushels, down 42 million on lower yields. Harvested area is unchanged at 82.8 million acres. The soybean yield is projected at 49.6 bushels per acre, down 0.5 bushels from the September forecast. The largest production changes are for Kansas, Michigan, and Nebraska. With lower production partly offset by higher beginning stocks, supplies are reduced 24 million bushels. Soybean exports are reduced 35 million bushels to 1.76 billion with increased competition from South America. Soybean crush is projected at 2.3 billion bushels, up 10 million, driven by higher soybean meal exports and soybean oil domestic demand. Soybean oil domestic use is raised in line with an increase for 2022/23. With lower exports partly offset by increased crush, ending stocks are unchanged from last month at 220 million bushels. 

Wheat

The outlook for 2023/24 U.S. wheat this month is for higher supplies, increased domestic use, unchanged exports, and higher ending stocks. Supplies are raised 85 million bushels, primarily on higher production as reported in the NASS Small Grains Annual Summary, released September 29. Domestic use is raised 30 million bushels, all on higher feed and residual use. The NASS Grain Stocks report released September 29 indicated a higher year-to-year increase for first quarter (June-August) domestic disappearance than previously expected. Exports remain at 700 million bushels with several offsetting by-class changes. Projected ending stocks are raised by 55 million bushels to 670 million, up 15 percent from last year. The season average farm price is reduced $0.20 per bushel to $7.30 on higher projected stocks and expectations for futures and cash prices for the remainder of the marketing year.

September 2023 Grain Market Update

Dale Johnson, Farm Management Specialist
University of Maryland

Information from USDA WASDE report

Attached is the summary for the September 2023 WASDE.

Corn

This month’s 2023/24 U.S. corn outlook is for slightly larger supplies and ending stocks. Projected beginning stocks for 2023/24 are 5 million bushels lower based on mostly offsetting trade and corn used for ethanol changes for 2022/23. Corn production for 2023/24 is forecast at 15.1 billion bushels, up 23 million from last month as greater harvested area more than offsets a reduction in yield. The national average yield is forecast at 173.8 bushels per acre, down 1.3 bushels. Harvested area for grain is forecast at 87.1 million acres, up 0.8 million. Total U.S. corn use is unchanged at 14.4 billion. With supply rising slightly and use unchanged, ending stocks are up 19 million bushels to 2.2 billion. The season-average corn price received by producers is unchanged at $4.90 per bushel.

Soybeans

U.S. soybean supply and use changes for 2023/24 include lower beginning stocks, production, crush, exports, and ending stocks. Lower beginning stocks reflect an increase for exports in 2022/23. Soybean production is projected at 4.1 billion bushels, down 59 million with higher harvested area offset by a lower yield. Harvested area is raised 0.1 million acres from the August forecast. The soybean yield of 50.1 bushels per acre is down 0.8 bushels from last month. The soybean crush forecast is reduced 10 million bushels and the export forecast is reduced 35 million bushels on lower supplies. Ending stocks are projected at 220 million bushels, down 25 million from last month. The U.S. season-average soybean price is forecast at $12.90 per bushel, up $0.20 from last month. The soybean meal price is unchanged at $380 per short ton and the soybean oil price is raised 1.0 cent to 63.0 cents per pound. Other changes this month include higher peanut and lower cottonseed production.

Wheat

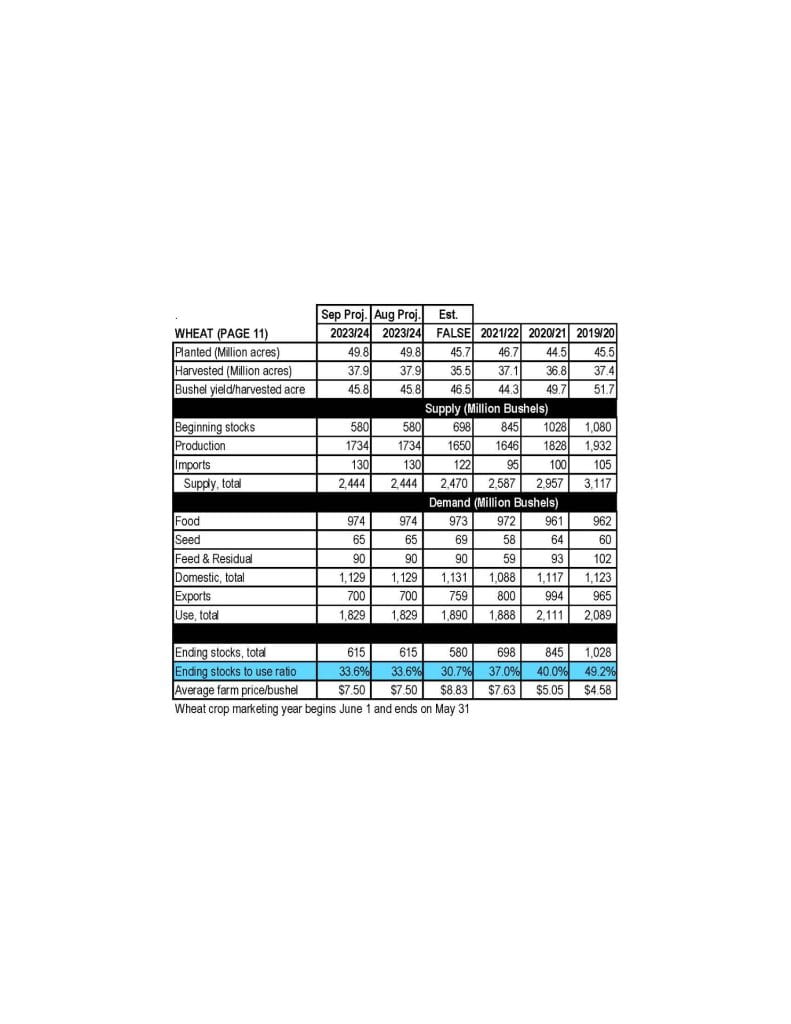
The 2023/24 U.S. all wheat outlook for supply and use is unchanged this month with offsetting by-class changes on exports. The projected 2023/24 season-average farm price is also unchanged at $7.50 per bushel.

Grain Feeding Cattle in Southern Maryland

6-9 pm | Dinner provided

Agenda:
Southern Maryland Grain Update 
Ben Beale, Univeristy of Maryland Extension

Becoming a cooperator herd with Roseda Beef
Dean Bryant, Roseda Beef

Current opportunities in feeding cattle and the basics of cattle diets
Charlie Sasscer III, University of Maryland Extension

Locations:
September 6, 2023 | Calvert County
901 Dares Beach Rd., Prince Frederick, MD 20678

September 13, 2023 | The Barns at New Market
29133 Thompson Corner Rd., Charlotte Hall, MD 20659

RSVP at https://forms.gle/s4hpojx69TSnhTPW8

When Does Corn Rally in August?

Mark Townsend, Agriculture Agent Associate | mtownsen@umd.edu
University of Maryland Extension, Frederick County

All eyes have been on news headlines coming from the Black Sea for the last two to three weeks since the termination of the previous agreement between Russia and Ukraine. The escalation in the war between these two nations has seen drone strikes, missile engagements, and major destruction of Black Sea ports like Odessa in Ukraine. Traders have watched these headlines and acted accordingly in the market place as the price of corn and wheat retraced previous months losses.

However, a bull market needs a continuous stream of bullish news to continue the price momentum. Traders have since lost some interest in these headlines as there appeared to be a break in the action in the middle of last week. No less, the slow in headlines corresponded with a wetter weather outlook for many areas of the Midwest. The December corn market has fallen back to the low $5.00 mark; a price level seen in Mid-July following the rather bearish USDA planted acreage report.

With much of the US corn crop “made”, the trade may be moving beyond the volatile weather market observed these last two months. However the future is not so rosy either; August is typically a rather turbid month for the December Corn contract with traders seeking headlines of yield prospects, South American harvest updates, and South American planting intentions. With this, the goal of this excerpt is to help answer the question, “when does the corn market rally in August?”

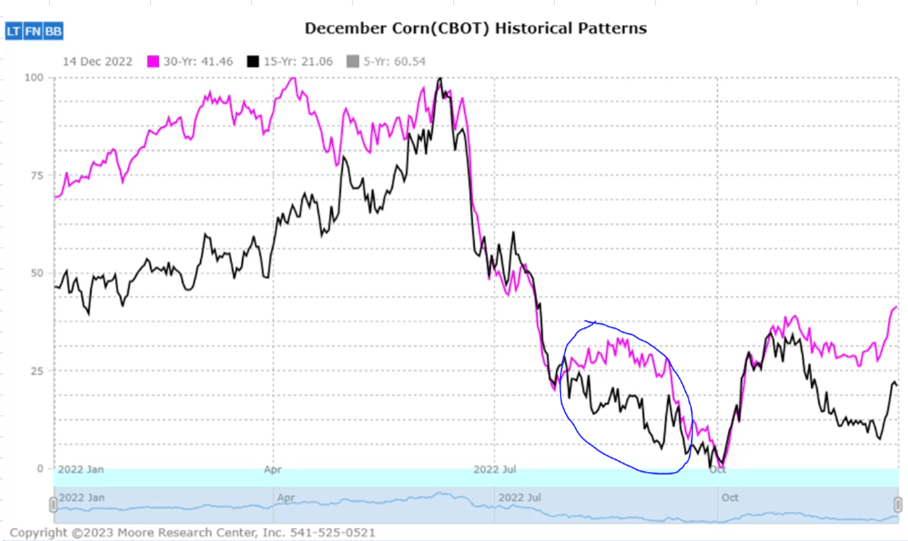
Figure 1. Illustrating the general historical pattern of the December Corn contract. Credit: Moore Research Center, Inc.

As circled in blue, August tends to be rather choppy with rapid price movements throughout the month. Additionally, one can also observe a slight downward trend during this time period.

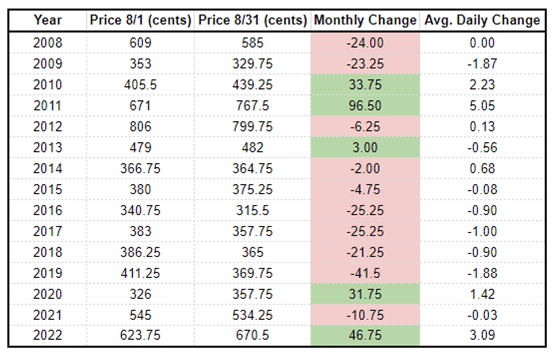
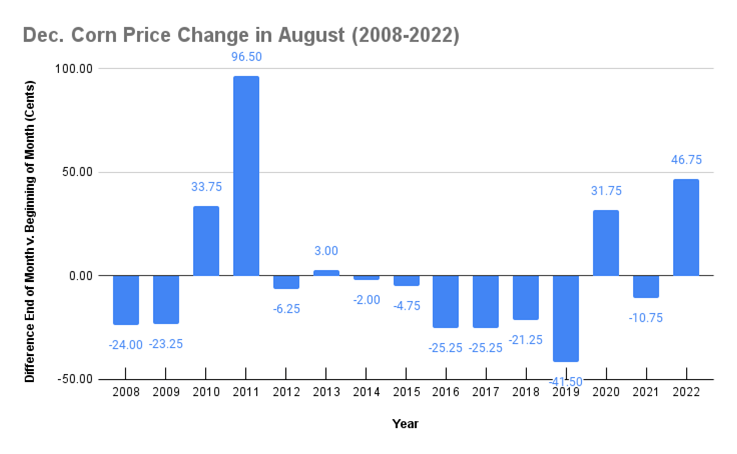
In evaluating December Corn historical price data, 10 of the last 15 years saw a decline in the corn price from the beginning of the month to the end of the month. On average, these years saw an average decline of $0.18 during this period, as well as a daily price change of about -$0.005/day.

Of the five years when corn did rise in August, three of which appear to be induced by the same phenomenon. The years 2011, 2013, and 2022 saw an August WASDE report indicating a lower corn yield than the July report of the same year. The August reports lowered the yield estimates by 5.7, 2.1, and 1.6 bu/ac respectively for 2010, 2013, and 2022.

The other year’s increase was the result of a catastrophic drought in Russia (2010) and a dramatic increase in export sales to China (2020).

With this being said, historically the USDA often changes the corn yield number in its August WASDE report. Last month’s report reduced the corn yield estimate by 4 bu/ac–an infrequent occurrence for the USDA to revise downward in July. In this, there may exist reason to believe that the August 2023 WASDE corn yield estimate will revise downward once more.

So to answer the question at hand, August rallies appear to come on the heels of pretty significant news: extreme crop failures, unprecedented demand, and lower than expected yields. Given our currently lackluster export demand and relatively high prices, a run on US corn appears rather unlikely. And though the Ukraine/Russia War appears to have disturbed the global supply chain for commodities, traders do not appear to trade these headlines for much longer. Currently, the US Corn crop ratings are the second worst observed since 2012 given the widespread drought across the corn belt. With this, pay close attention to the Aug 11, 2023 report as there could be a price movement with a potential yield revision.

Frederick County Grain Marketing Meeting

New Extension Program: Frederick County Grain Marketing Meeting The University of Maryland Extension Frederick County will now host a bi-weeky (every-other) meeting to discuss current topics in commodity grain markets for producers looking to improve their grain marketing strategy and stay informed about current market conditions. The meeting is intended to be an open, informal discussion rather than a lecture or presentation. In this, any and all members of the agricultural community/those interested in learning more about commodity grain markets are invited to attend.

Currently, meetings will be held at the Cracker Barrel in Frederick located just off Rt. 85 at 7408 Shockley Drive, Frederick, MD 21704 on Friday mornings from 7:30 am – 8:30 am. The meetings will be held over a delicious breakfast, however attendees will be responsible for purchasing their own meals. The next meeting will be held on Friday, Jul 28, 2023. Meeting location and times may be subject to change to better suit the needs of the attending group and will be announced.

For additional clarity, the current meeting schedule for the next five meetings is as follows:

  1. July 28, 2023
  2. August 11, 2023
  3. August 25, 2023
  4. September 8, 2023
  5. September 22, 2023

Attendees or interested parties are encouraged to complete the online form at the Frederick County Extension, Agriculture and Food Systems webpage or at https://go.umd.edu/FrederickGrain. Completion of the form is not required for attendance, however those who complete the form and provide an email address will receive additional information and timely updates of grain marketing topics, news, and market conditions between meetings.

Depending on group interest, expert speakers may be invited to attend and offer additional perspectives on marketing or market conditions at future meetings. For more information, comments, or questions please contact Mark Townsend, Agriculture Agent Associate, at mtownsen@umd.edu or (301) 600-3578. The UME-Frederick Ag&FS team looks forward to your attendance!

###

This institution is an equal opportunity provider.

July 2023 Grain Market Update

Dale Johnson, Farm Management Specialist
University of Maryland

Information from USDA WASDE report

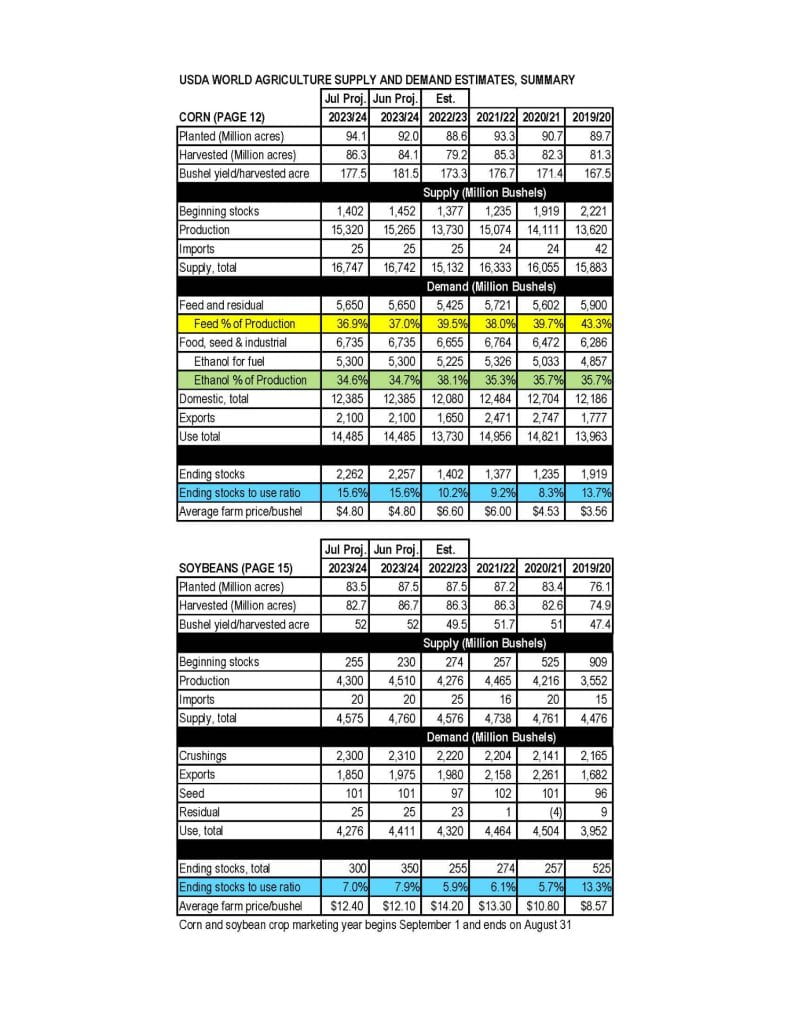
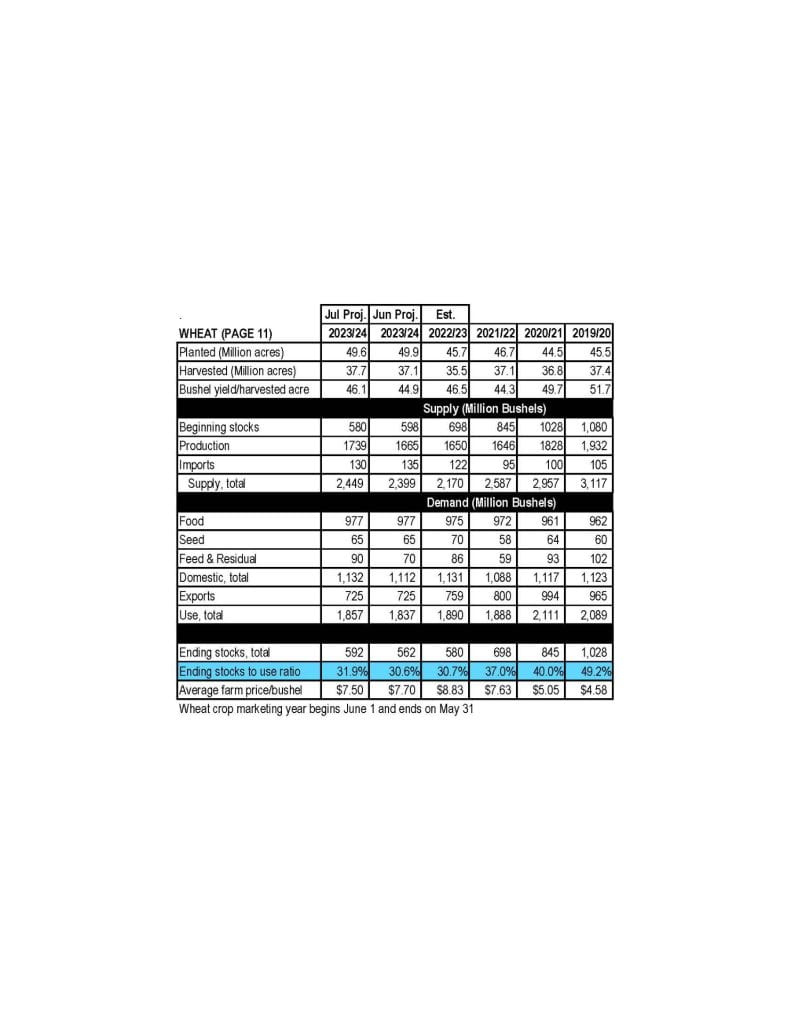
Attached is the summary for the July 2023 WASDE.

Corn

This month’s 2023/24 U.S. corn outlook is for fractionally higher supplies and ending stocks. Corn beginning stocks are lowered 50 million bushels, as greater feed and residual use for 2022/23 more than offsets reductions in corn used for ethanol and exports. Corn production for 2023/24 is forecast up 55 million bushels as greater planted and harvested area from the June 30 Acreage report is partially offset by a 4.0-bushel reduction in yield to 177.5 bushels per acre. According to data from the National Centers for Environmental Information, harvested-area-weighted June precipitation data for the major Corn Belt states represented an extreme downward deviation from average. However, timely rainfall and cooler than normal temperatures for some of the driest parts of the Corn Belt during early July is expected to moderate the impact of June weather. For much of the crop the critical pollination period will be in the coming weeks. With supply rising fractionally and use unchanged, ending stocks are up 5 million bushels. The season-average farm price received by producers is unchanged at $4.80 per bushel.

Soybean

Soybean production is projected at 4.3 billion bushels, down 210 million on lower harvested area. Harvested area, forecast at 83.5 million acres in the June 30 Acreage report, is down 4.0 million from last month. The soybean yield forecast is unchanged at 52.0 bushels per acre. With lower production partly offset by higher beginning stocks, 2023/24 soybean supplies are reduced 185 million bushels. Soybean crush is reduced 10 million bushels reflecting a lower soybean meal domestic disappearance forecast. Soybean exports are reduced 125 million bushels to 1.85 billion on lower U.S. supplies and lower global imports. With lower supplies only partly offset by reduced use, ending stocks for 2023/24 are projected at 300 million bushels, down 50 million from last month. The U.S. season-average soybean price for 2023/24 is forecast at $12.40 per bushel, up $0.30 from last month.

Wheat

Changes this month to the 2023/24 U.S. wheat outlook increase supplies and domestic use, leave exports unchanged, and increase ending stocks. Supplies are raised on larger production, which is up 74 million bushels to 1,739 million, on higher harvested area and yields. The first 2023/24 survey-based production forecast for other spring and Durum indicates a decrease from last year. Conversely, winter wheat production is forecast higher on larger harvested area and higher yields. Gains for all wheat production are partly offset by smaller beginning stocks, which are lowered 18 million bushels to 580 million as indicated in the Grain Stocks report, issued June 30. The 2023/24 ending stocks are forecast at 592 million bushels, 30 million higher than last month. The projected season-average farm price is forecast at $7.50 per bushel, down $0.20 from last month.

May 2023 Grain Market Update

Dale Johnson, Farm Management Specialist
University of Maryland

Information from USDA WASDE report

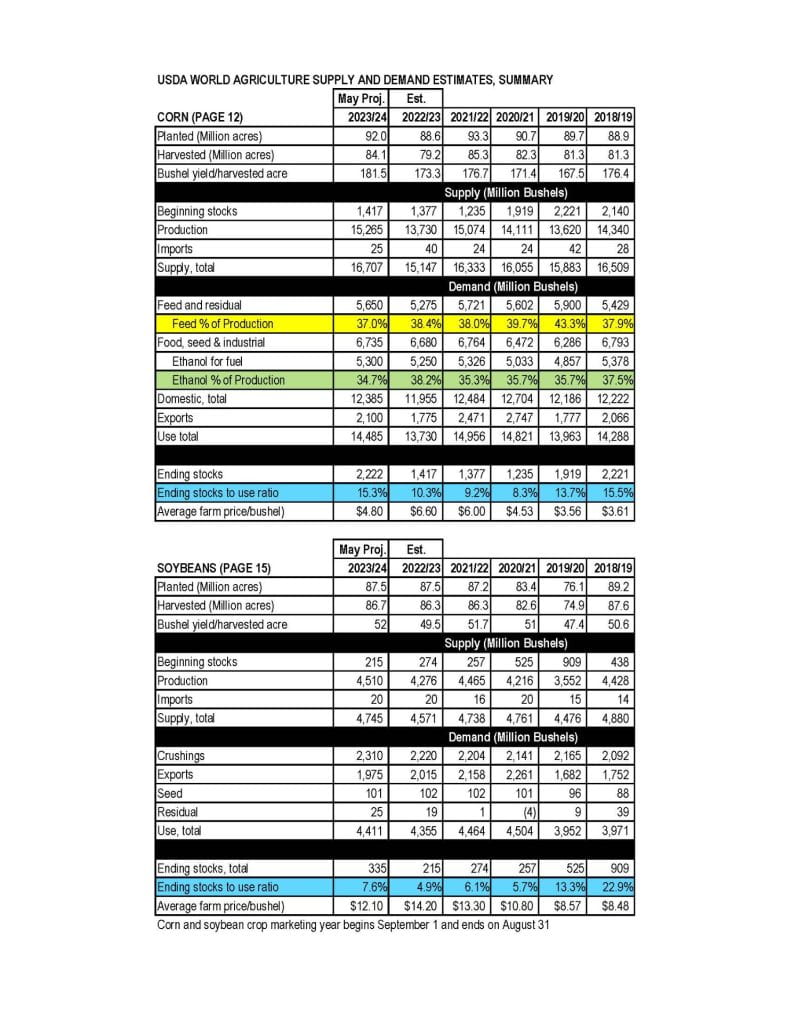
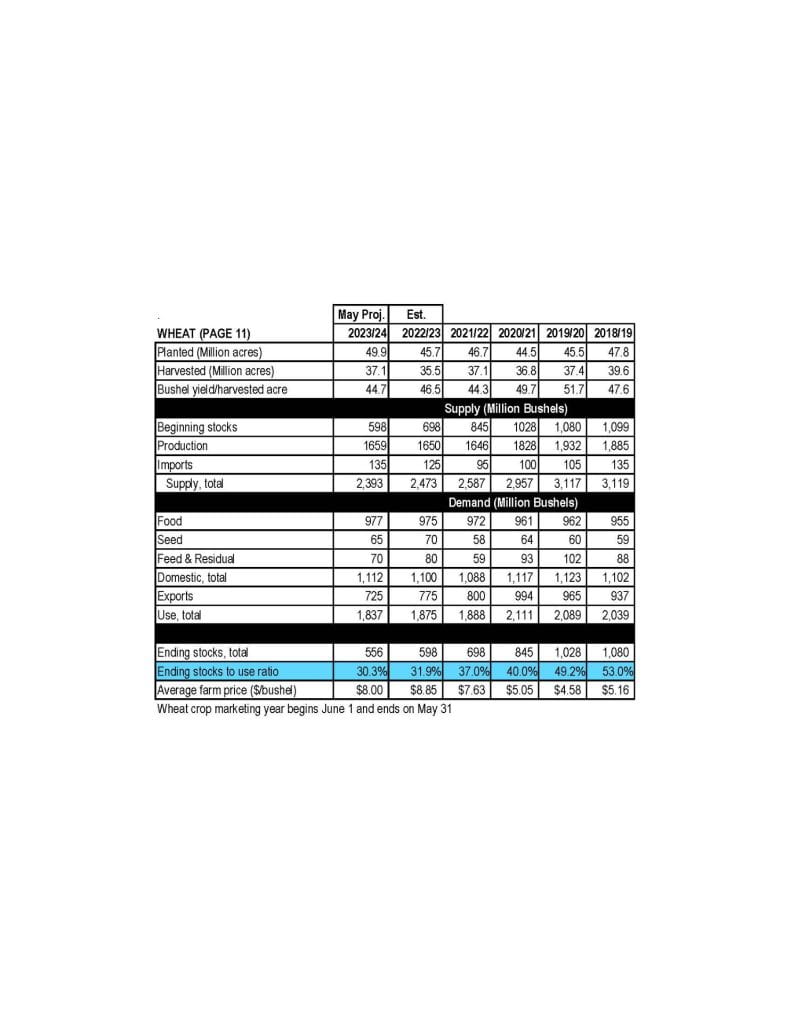
Attached is the summary for the May 2023 WASDE.

Corn

The 2023/24 U.S. corn outlook is for larger production, greater domestic use and exports, and higher ending stocks. The corn crop is projected at a record 15.3 billion bushels, up more than 10 percent from last year on increases to both area and yield. The yield projection of 181.5 bushels per acre is based on a weather-adjusted trend assuming normal planting progress and summer growing season weather, estimated using the 1988-2022 time period. With beginning stocks up slightly, total corn supplies are forecast at 16.7 billion bushels, the highest since 2017/18. Total U.S. corn use for 2023/24 is forecast to rise about 5 percent relative to a year ago on higher domestic use and exports. Food, seed, and industrial use is projected to rise 55 million bushels to 6.7 billion. Corn used for ethanol is projected to increase 1 percent, based on expectations of modest growth in motor gasoline consumption and ethanol’s inclusion rate into gasoline. Feed and residual use is projected higher on a larger crop and lower expected prices. U.S. corn exports for 2023/24 are forecast to rise 325 million bushels to 2.1 billion, as lower prices support a sharp increase in global trade following the decline seen during 2022/23. U.S. market share is expected to increase slightly albeit remain below the average of the past 5 years. Exports are higher for Argentina and Brazil, with the former reflecting a return to normal weather conditions after a drought during 2022/23. Despite a rebound in U.S. exports, Brazil is forecast to be the world’s largest exporter of corn for the second consecutive year. Exports for Ukraine are projected to decline based on lower production prospects. With total U.S. corn supply rising more than use, 2023/24 ending stocks are up 805 million bushels from last year and if realized would be the highest in absolute terms since 2016/17. Stocks would represent 15.3 percent of use, the highest since 2018/19. The season-average farm price is projected at $4.80 per bushel, down $1.80 from 2022/23.

Soybean

The 2023/24 outlook for U.S. soybeans is for higher supplies, crush, and ending stocks, and lower exports compared with 2022/23. The soybean crop is projected at 4.51 billion bushels, up 5 percent from last year’s crop mainly on higher yields. With lower beginning stocks partly offsetting increased production, soybean supplies are forecast at 4.75 billion bushels, up 4 percent from 2022/23. Total U.S. oilseed production for 2023/24 is projected at 132.8 million tons, up 6.9 million from 2022/23 mainly on higher soybean production. Production forecasts are also higher for canola, peanuts, and cottonseed. The U.S. soybean crush for 2023/24 is projected at 2.31 billion bushels, up 90 million from the 2022/23 forecast on favorable crush margins and strong demand for soybean oil as a biofuel feedstock, which is projected to increase 900 million pounds to 12.5 billion. Domestic soybean meal disappearance is forecast to increase 2 percent from 2022/23 on lower soybean meal prices and modest growth primarily in poultry production. U.S. soybean meal exports are forecast at 14.8 million short tons, leaving the U.S share of global trade slightly above the prior 5-year average. U.S. soybean exports are forecast at 1.98 billion bushels, down 40 million from 2022/23 with strong competition from increasing South American production and limited gains in global import demand. U.S. ending stocks for 2023/24 are projected at 335 million bushels, up 120 million from the revised 2022/23 forecast. Soybean and product prices are all forecast lower for 2023/24. The 2023/24 U.S. season-average soybean price is forecast at $12.10 per bushel compared with $14.20 per bushel in 2022/23.

Wheat

The 2023/24 outlook for U.S. wheat is for reduced supplies and exports, increased domestic use, and smaller stocks compared with 2022/23. U.S. wheat supplies are forecast lower than last year with smaller beginning stocks and only slightly larger production. All wheat production is projected at 1,659 million bushels, up modestly from last year on increased harvested area. However, the harvest-to-plant ratio is down from last year with above-average abandonment in Texas, Oklahoma, and Kansas. The all wheat yield, projected at 44.7 bushels per acre, is 1.8 bushels lower than last year. The first survey-based production forecast for 2023/24 winter wheat is up 2 percent from last year as higher Soft Red Winter production more than offsets a decline in Hard Red Winter and White wheat. Total 2023/24 domestic use is projected at 1,112 million bushels, up 1 percent from last year, primarily on increased feed and residual use. Exports are projected at 725 million bushels, 50 million lower than last year. Ending stocks are projected 11 percent lower than last year and the lowest in 16 years. The projected 2023/24 season-average farm price is $8.00 per bushel, down $0.85 from last year’s record.

April 2023 Grain Markey Update

Dale Johnson, Farm Management Specialist
University of Maryland

Information from USDA WASDE report

Attached is the summary for the April 2023 WASDE.

Corn

This month’s ‘22/23 U.S. corn outlook is for reductions to imports and food, seed, and industrial (FSI) use, with unchanged ending stocks. Corn imports are lowered 10 million bushels based on observed trade to date. Feed and residual use is unchanged at 5.275 billion based on indicated disappearance during the December-February quarter. FSI is lowered 10 million bushels reflecting cuts to corn used for glucose and dextrose and starch. With supply and use falling by the same amount, ending stocks are unchanged at 1.342 billion bu. The season-average price is unchanged at $6.60 per bu.

Soybeans

U.S. soybean supply and use forecasts for ‘22/23 are unchanged relative to last month. Soybean and soybean meal prices are also unchanged. The soybean oil price is projected at 64.0 cents per pound, down 2 cents. Global ‘22/23 soybean supply and demand forecasts include lower production, crush, and exports. Global soybean production is reduced 5.5 million tons to 369.6 million. Lower crops for Argentina and Uruguay are partly offset by higher production for Brazil. Soybean production for Argentina is lowered 6.0 million tons to 27.0 million on hot and dry weather conditions through March. Uruguay production is lowered 0.9 million tons to 1.2 million on a lower harvested area and yield. Partly offsetting is higher production for Brazil,  increased 1.0 million tons to 154.0 million on higher area. Soybean crush is lowered on reduced supplies and slow pace to date for Argentina, China, Bangladesh, Pakistan, and Egypt. Crush for Argentina is reduced 3.3 million tons to 32.0 million leading to lower product exports. Partly offsetting is higher crush and higher soybean oil and meal exports for Brazil. Soybean exports are lowered 0.4 million tons to 168.0 million on lower exports for Uruguay. Imports are lowered for Bangladesh, Egypt, and Pakistan and raised for Argentina. Soybean ending stocks are raised fractionally with higher stocks for China and Brazil that are mostly offset by lower stocks for Argentina.

Wheat

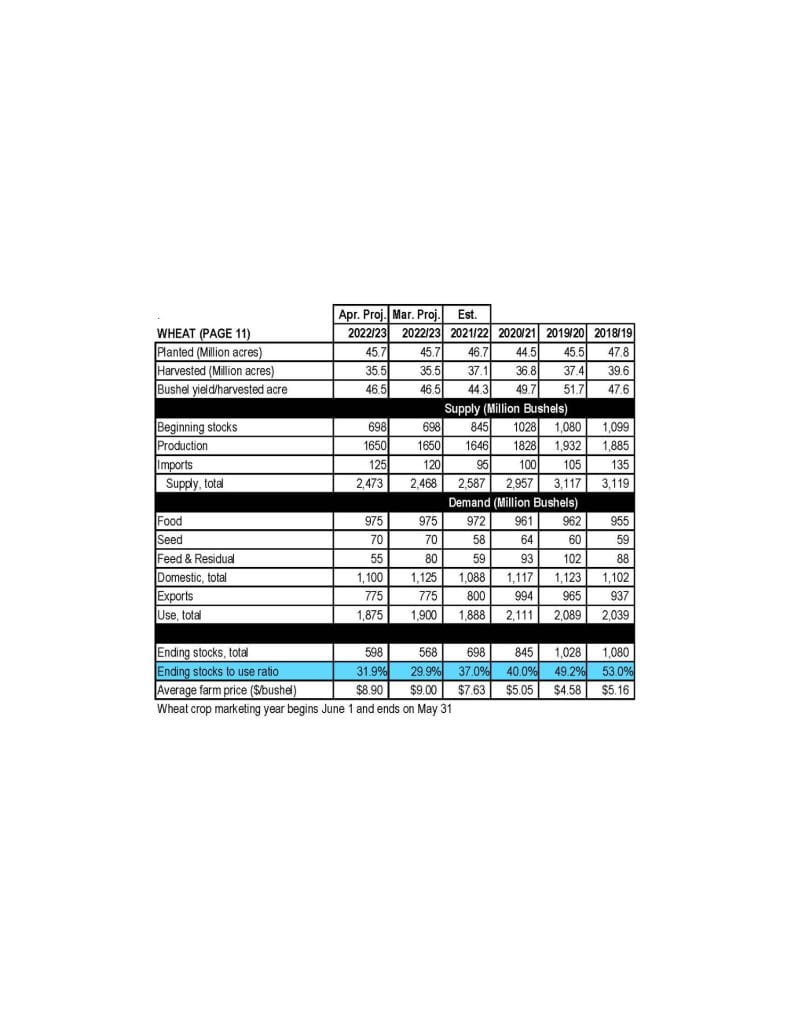
The outlook for ‘22/23 U.S. wheat this month is for slightly higher supplies, reduced domestic use, unchanged exports, and increased ending stocks. Supplies are raised 5 million bushels on higher imports, based on the pace of Census imports reported to date. Domestic use is lowered 25 million bushels on reduced feed and residual use, which is decreased to 55 million. The downward revision is based on the implied disappearance for the second and third quarters indicated in the NASS Grain Stocks report. Wheat exports remain at 775 million bushels but there are offsetting by-class changes for White and Hard Red Spring exports. Projected ‘22/23 ending stocks are raised 30 million bushels to 598 million but are still 14% below last year. The ‘22/23 season-average farm price is forecast $0.10 per bushel lower at $8.90, based on NASS prices reported to date and expectations for cash prices for the remainder of ‘22/23. The global wheat outlook for ‘22/23 is for increased supplies, higher consumption, and reduced trade and stocks. Supplies are raised 0.7 million tons to 1,061.1 million, primarily on higher beginning stocks for Syria and increased production for Ethiopia. Global consumption is increased 2.9 million tons to 796.1 million, mainly on higher food, seed, and industrial use for India, and increased feed and residual use for China and the EU. World trade is lowered 1.2 million tons to 212.7 million on reduced exports by the EU, Argentina, and Brazil more than offsetting increases for Russia and Ukraine. China’s wheat imports are raised 2.0 million tons to 12.0 million, which would be the highest imports for China since 1995/96. China’s imports are raised on strong imports to date, particularly from Australia; China is now the leading 2022/23 global wheat importer. Projected 2022/23 world ending stocks are lowered 2.1 million tons to 265.1 million, the lowest since 2015/16. This month, India, the Philippines, and Ukraine are projected to have lower stocks, more than offsetting increases for Syria, the EU, and the United States.

October 2022 Grain Market Report

Dale Johnson, Farm Management Specialist
University of Maryland

Information from USDA WASDE report
Attached is the summary for the October 2022 WASDE.


Corn

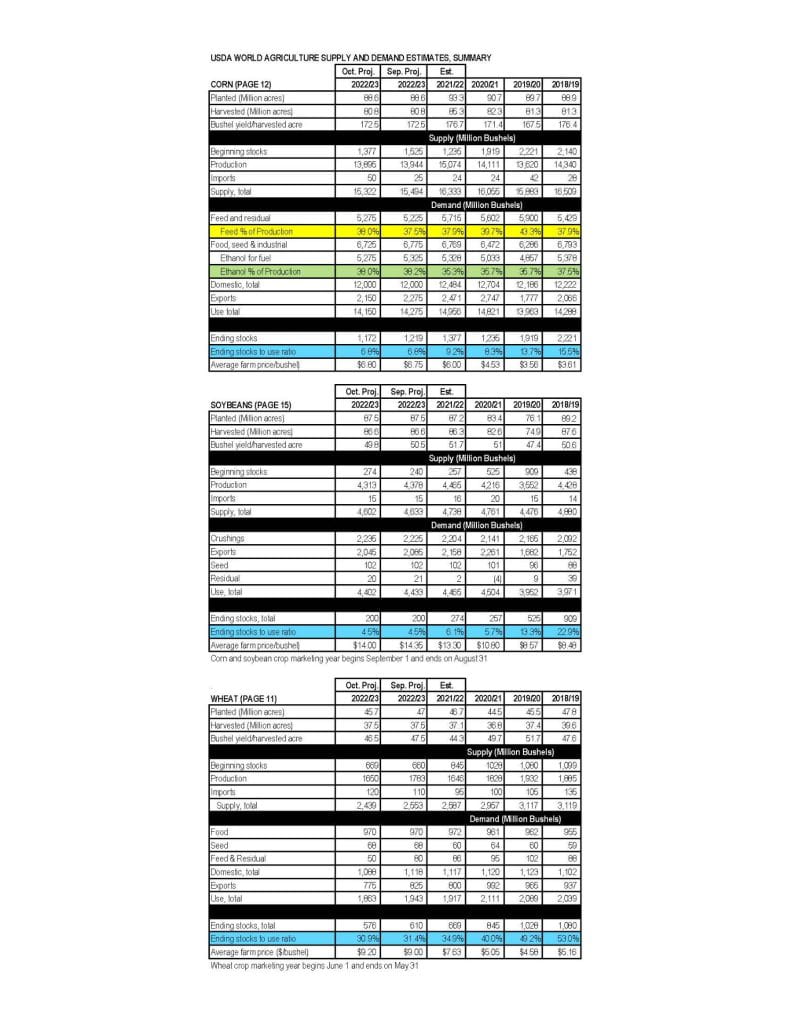
This month’s 2022/23 U.S. corn outlook is for reduced supplies, greater feed and residual use, lower exports and corn used for ethanol, and smaller ending stocks. Corn production is forecast at 13.895 billion bushels, down 49 million on a reduction in yield to 171.9 bushels per acre. Corn supplies are forecast at 15.322 billion bushels, a decline of 172 million bushels from last month, as lower production and beginning stocks are partially offset by higher imports. Exports are lowered 125 million bushels reflecting smaller supplies and slow early-season demand. Projected feed and residual use is raised 50 million bushels based on indicated disappearance during 2021/22. Corn used for ethanol is lowered 50 million bushels. With supply falling more than use, corn ending stocks for 2022/23 are cut 47 million bushels. The season-average corn price received by producers is raised 5 cents to $6.80 per bushel. 

Soybeans

Soybean production is forecast at 4.3 billion bushels, down 65 million on lower yields. Harvested area is unchanged at 86.6 million acres. The soybean yield is projected at 49.8 bushels per acre, down 0.7 bushels from the September forecast. With lower production partly offset by higher beginning stocks,
supplies are reduced 31 million bushels. Soybean exports are reduced 40 million bushels to 2.05 billion with increased competition from South America. With lower exports partly offset by increased crush, ending stocks are unchanged from last month at 200 million bushels. The U.S. season-average soybean price for 2022/23 is forecast at $14.00 per bushel, down 35 cents.

Wheat

The outlook for 2022/23 U.S. wheat this month is for lower supplies, domestic use, exports, and stocks. Supplies are reduced on lower 2022/23 production based on the NASS Small Grains Summary that indicated reductions in both harvested area and yield. This lowered production by 133 million bushels to 1,650 million, leaving production only minimally higher than last year. Partially offsetting the production decline are higher projected imports, raised 10 million bushels to 120 million, all for Hard Red Spring. Annual feed and residual use is lowered 30 million bushels to 50 million, based on first quarter disappearance, as indicated in the NASS Grain Stocks report. This is the lowest first quarter total disappearance since 1983/84. Wheat exports are lowered 50 million bushels to 775 million on reduced supplies, slow pace of export sales, and continued uncompetitive U.S. export prices. This would be the lowest U.S. wheat exports since 1971/72. Projected ending stocks are lowered 34 million bushels to 576 million, which would be the lowest since 2007/08. The season-average farm price is raised $0.20 per bushel to $9.20 on reported NASS prices to date and expectations for futures and cash prices for the remainder of 2022/23.