September 2022 Grain Market Summary

Dale Johnson, Farm Management Specialist
University of Maryland

Information from USDA WASDE report
Attached is the summary for the September 2022 WASDE.


Corn

This month’s 2022/23 U.S. corn outlook is for lower supplies, smaller feed and residual use, reduced exports and corn used for ethanol, and tighter ending stocks. Projected beginning stocks for 2022/23 are 5 million bushels lower based on essentially offsetting export and corn used for ethanol changes for 2021/22. Corn production for 2022/23 is forecast at 13.9 billion bushels, down 415 million from last month on reductions to harvested area and yield. The national average yield is forecast at 172.5 bushels per acre, down 2.9 bushels. Harvested area for grain is forecast at 80.8 million acres, down 1.0 million. Total U.S. corn use is cut 250 million bushels to 14.3 billion. Feed and residual use is lowered 100 million bushels based on a smaller crop and higher expected prices. Exports are cut 100 million bushels to 2.3 billion while corn used for ethanol is lowered 50 million to 5.3 billion. With supply falling more than use, ending stocks are down 169 million bushels to 1.2 billion. The season-average corn price received by producers is raised 10 cents to $6.75 per bushel.

Soybeans

U.S. soybean supply and use changes for 2022/23 include higher beginning stocks and lower production, crush, exports, and ending stocks. Higher beginning stocks reflect a lower export forecast for 2021/22. Soybean production is projected at 4.4 billion bushels, down 152 million with lower harvested area and yield. Harvested area is down 0.6 million from the August forecast. The soybean yield forecast of 50.5 bushels per acre is down 1.4 bushels from last month. The crush forecast is reduced 20 million bushels and the soybean export forecast is reduced 70 million bushels on lower supplies. Ending stocks are projected at 200 million bushels, down 45 million from last month. The U.S. season-average soybean price is forecast at $14.35 per bushel, unchanged from last month. Soybean meal and oil prices are also unchanged at $390 per short ton and 69.0 cents per pound, respectively. Other changes this month include lower peanut and higher cottonseed production.

Wheat

The 2022/23 U.S. wheat outlook for supply and use is unchanged this month. The projected 2022/23 season-average farm price (SAFP) is lowered $0.25 per bushel to $9.00 on reported NASS prices to date and expectations for cash and futures prices the remainder of 2022/23. Despite the decline, $9.00 per bushel would remain a record SAFP.

May 2022 Grain Market Report

Dale Johnson, Farm Management Specialist
University of Maryland

Information from USDA WASDE report

Attached is the summary for the May 2022 WASDE.
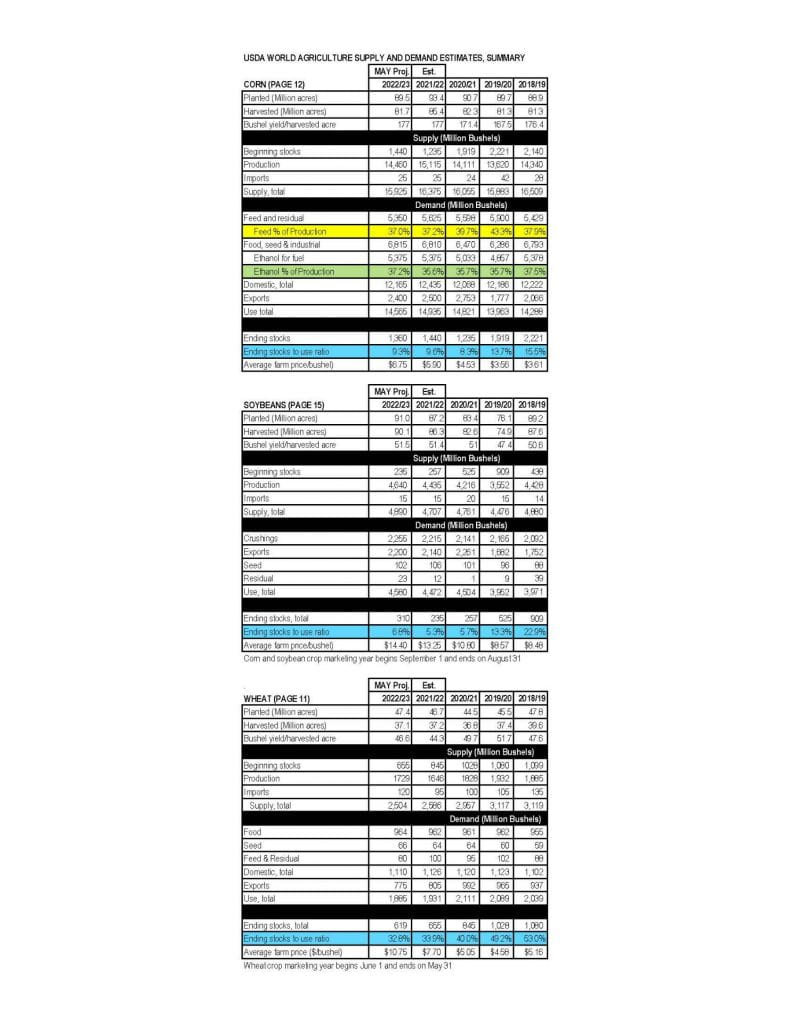
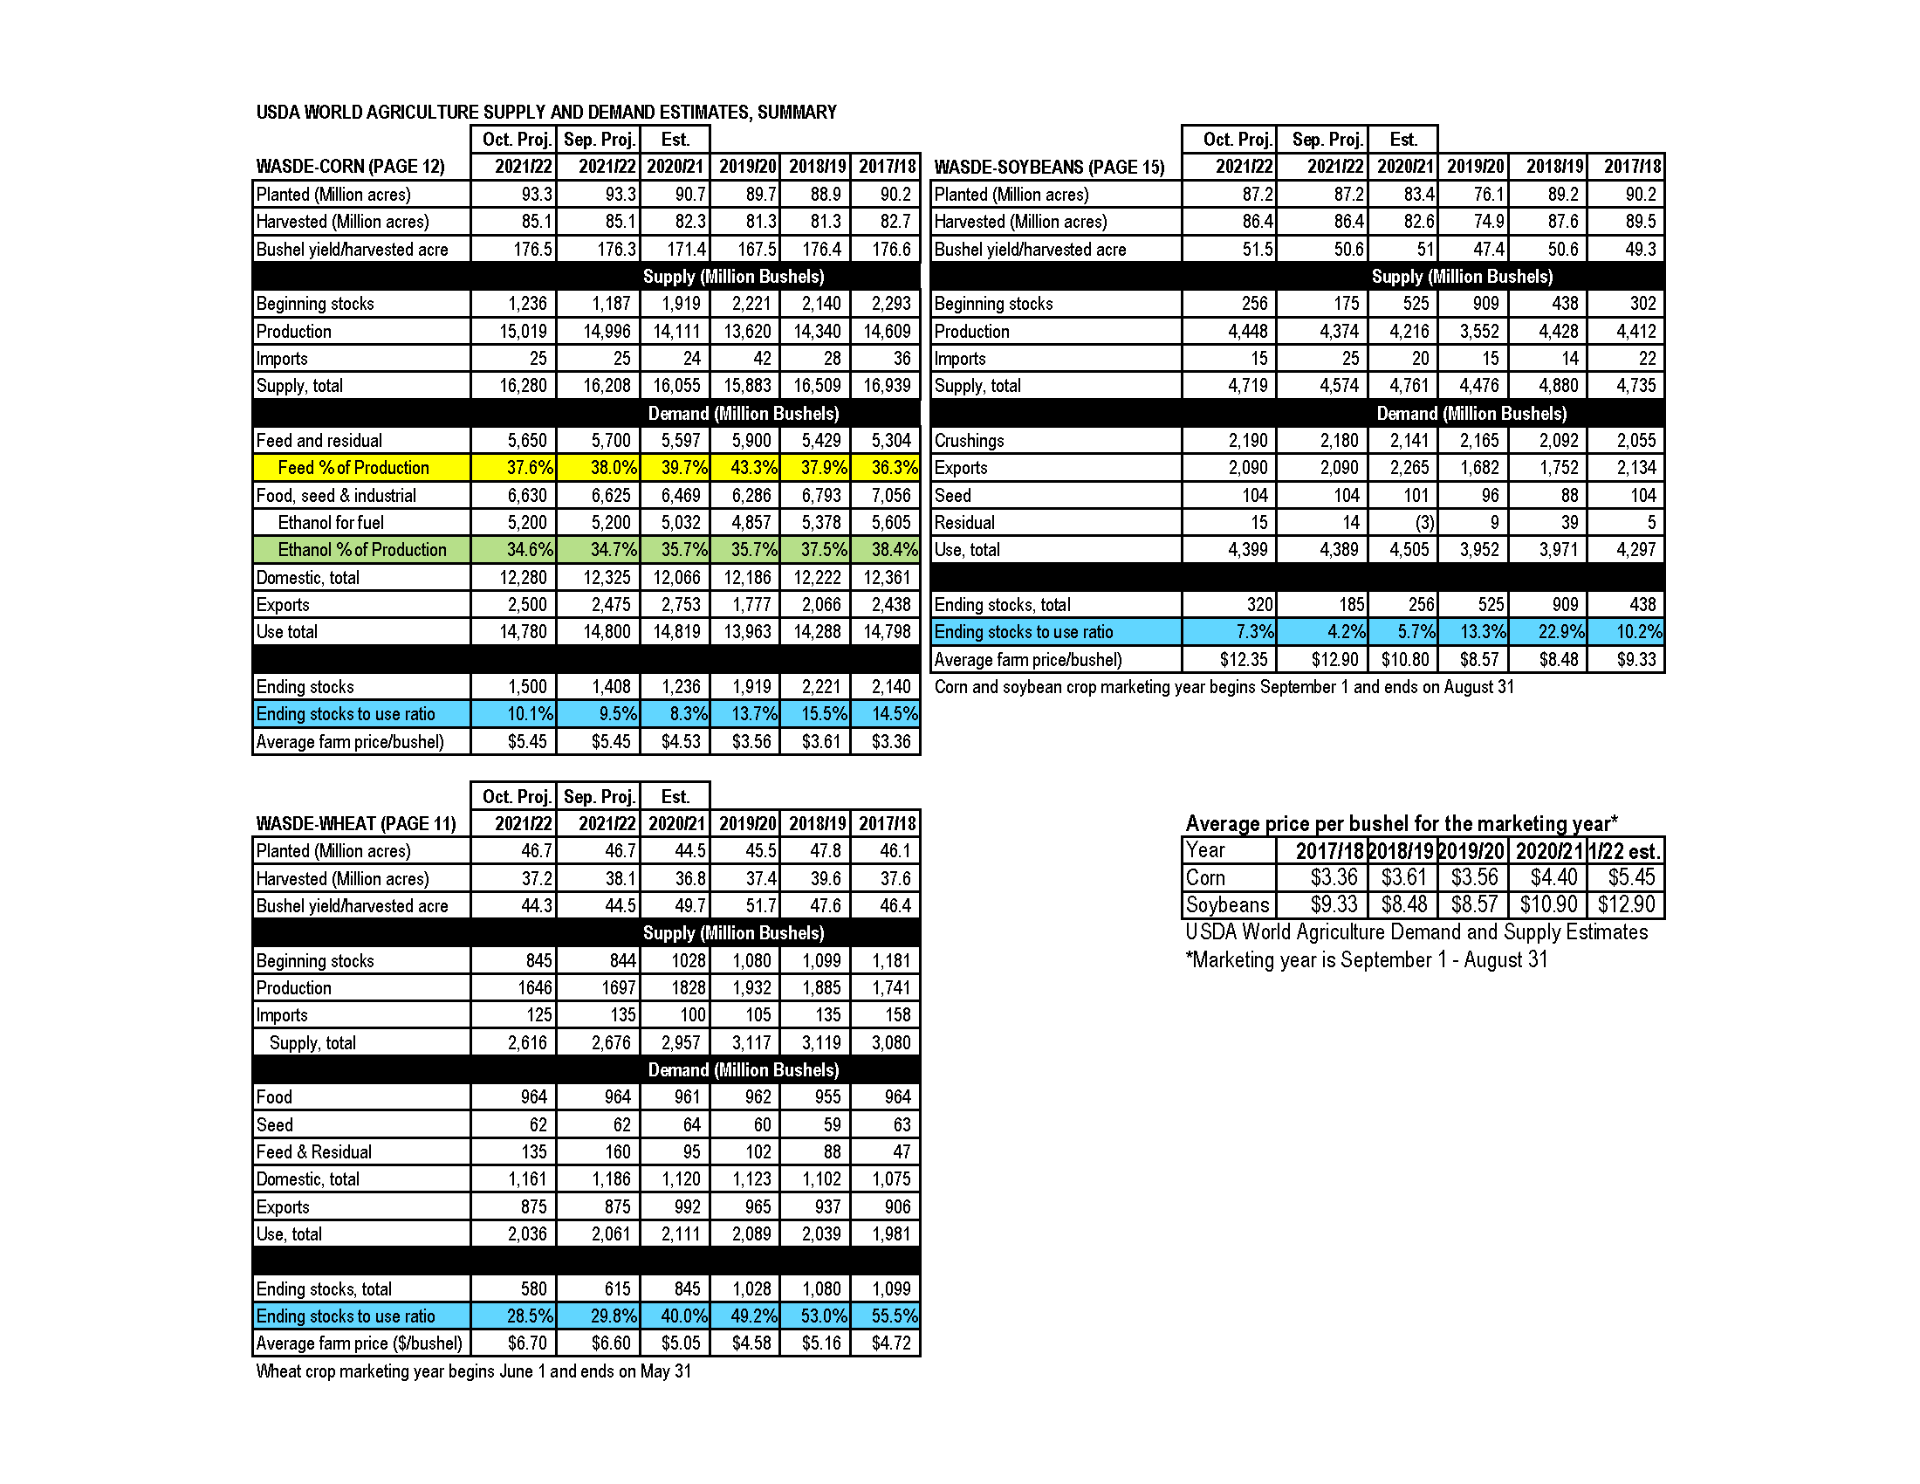
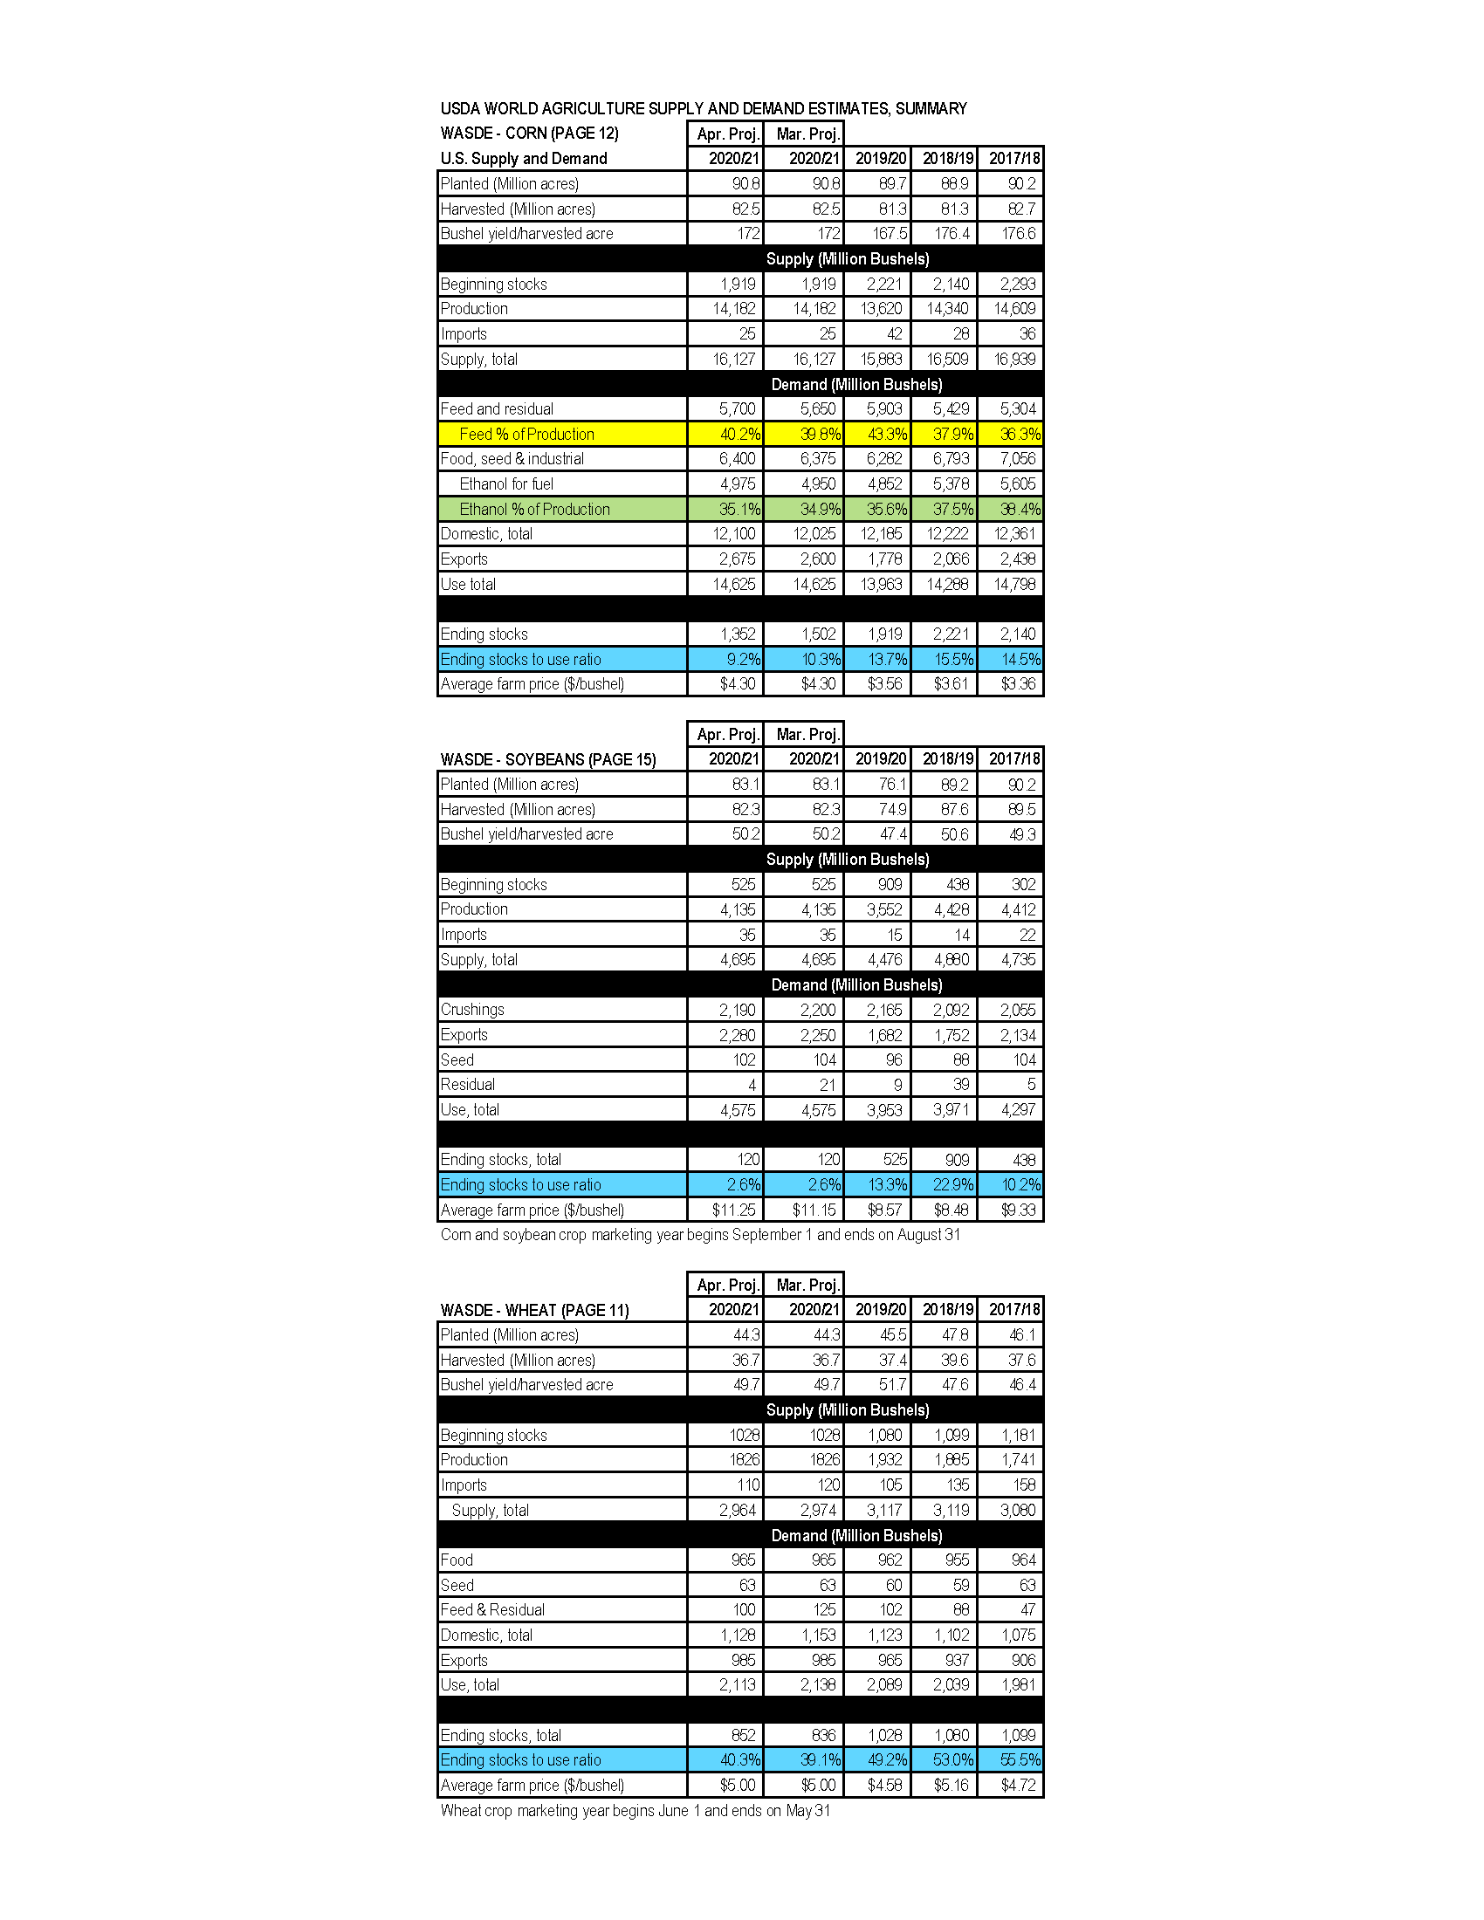
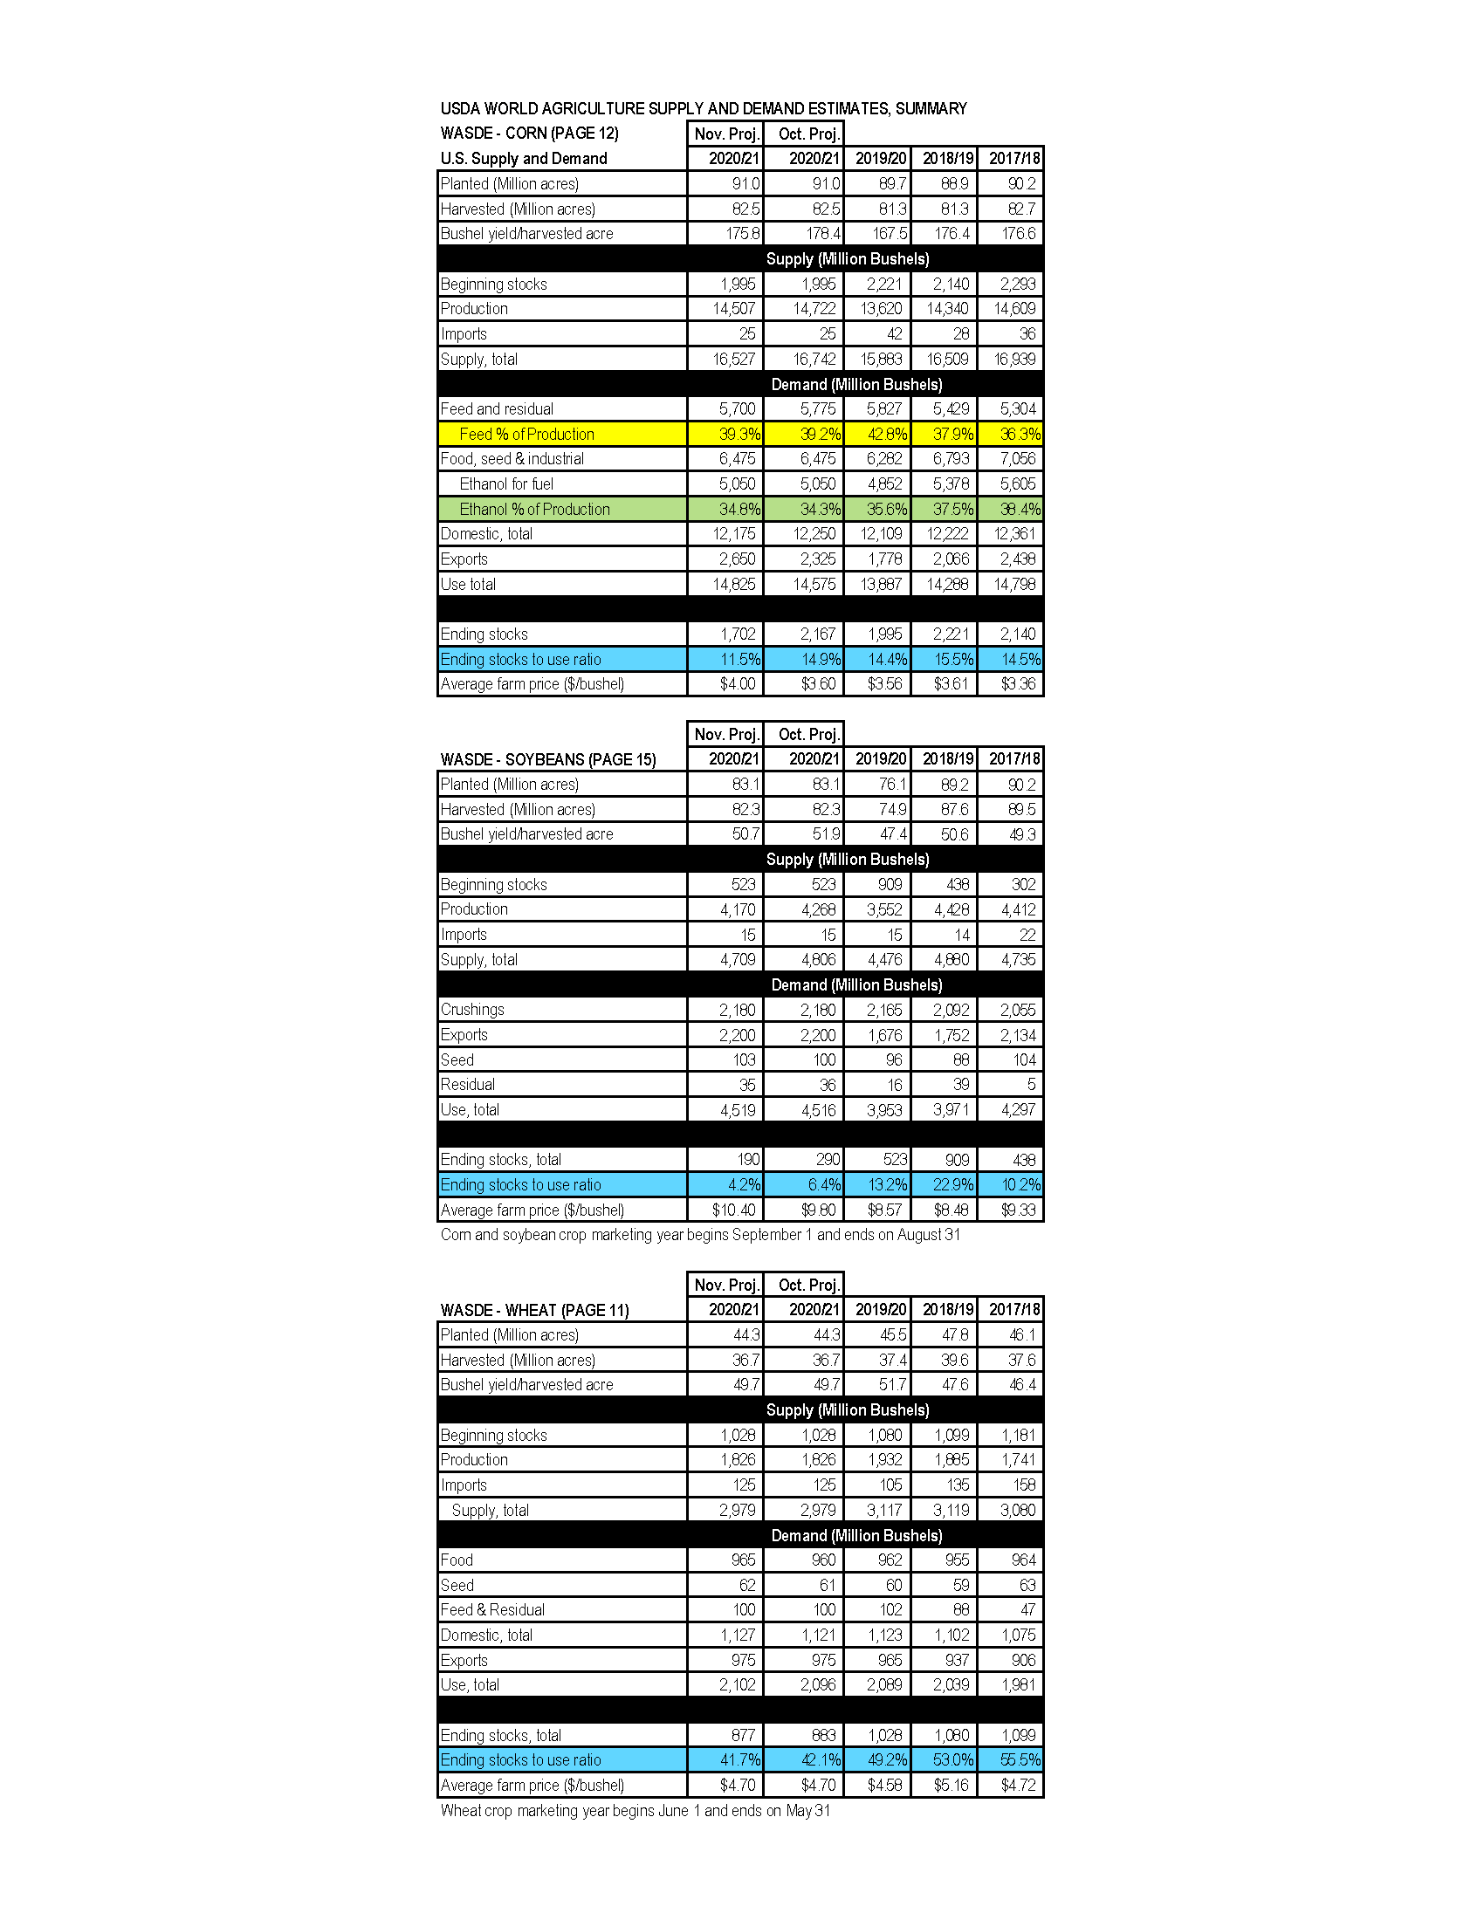
Corn

The 2022/23 U.S. corn outlook is for lower production, domestic use, exports, ending stocks, and higher prices. The corn crop is projected at 14.5 billion bushels, down 4.3 percent from last year. The corn yield is projected at 177.0 bushels per acre, 4.0 bushels below the weather adjusted trend presented at USDA’s Agricultural Outlook Forum in February. The very slow start to this year’s planting in the major corn producing States and the likelihood that progress by mid-May will remain well behind normal reduce yield prospects. Despite beginning stocks that are up relative to a year ago, total corn supplies are forecast to decline 2.7 percent to 15.9 billion bushels. Total U.S. corn use in 2022/23 is forecast to fall 2.5 percent on declines in domestic use and exports. Food, seed, and industrial (FSI) use is virtually unchanged at 6.8 billion bushels. Corn used for ethanol is unchanged relative to a year ago on expectations of flat U.S. motor gasoline consumption. Corn feed and residual use is down 4.9 percent relative to a year ago, reflecting a smaller crop, higher expected season-average farm prices received by producers, and a decline in grain consuming animal units. U.S. corn exports are forecast to decline 4.0 percent in 2022/23 as lower supplies and robust domestic demand limit prospects. Even with record exports projected for Argentina and Brazil, a 550-million-bushel drop in exports for Ukraine due to the ongoing conflict is the primary catalyst for a decline in world trade. With expectations of robust global demand in the face of high prices, the U.S. share of global corn trade is up slightly relative to a year ago. With total U.S. corn supply falling more than use, 2022/23 U.S. ending stocks are down 80 million bushels from last year. Stocks relative to use at 9.3 percent would be below a year ago and lower than the 14.4 percent average seen during 2015/16 to 2019/20. The season-average corn price received by producers is projected at $6.75 per bushel, up 85 cents from a year ago and if realized the highest since $6.89 reached during 2012/13.

Soybeans

The 2022/23 outlook for U.S. soybeans is for higher supplies, crush, exports, and ending stocks compared with 2021/22. The soybean crop is projected at 4.64 billion bushels, up 5 percent from last year’s crop mainly on higher harvested area. With slightly lower beginning stocks, soybean supplies are projected at 4.89 billion bushels, up 4 percent from 2021/22. The U.S. soybean crush for 2022/23 is projected at 2.26 billion bushels, up 40 million from the 2021/22 forecast. Domestic soybean meal disappearance is forecast to increase 2 percent from 2021/22 with low soybean meal prices relative to corn. U.S. soybean meal exports are forecast at 14.4 million short tons, leaving the U.S share of global trade near the prior 5-year average. With increased supplies, U.S. soybean exports are forecast at 2.2 billion bushels, up 60 million from the revised 2021/22 projection. Despite reduced soybean supplies available for export from South America for the first half of the 2022/23 marketing year, an anticipated record harvest and sharply higher exports beginning in early 2023 is expected to leave the U.S. with a lower share of global trade in 2022/23. U.S. ending stocks for 2022/23 are projected at 310 million bushels, up 75 million from the revised 2021/22 forecast. The 2022/23 U.S. season-average soybean price is forecast at $14.40 per bushel compared with $13.25 per bushel in 2021/22. Soybean meal prices are forecast down $20 per short ton from 2021/22 to $400 per short ton and soybean oil prices are forecast down 5 cents to average 70 cents per pound, as oilseed and product supplies rebound in foreign markets.

Wheat

The outlook for 2022/23 U.S. wheat is for reduced supplies, exports, domestic use stocks, and higher prices. U.S. 2022/23 wheat supplies are projected down 3 percent, as lower beginning stocks more than offset a larger harvest. All wheat production for 2022/23 is projected at 1,729 million bushels, up 83 million from last year, as higher yields more than offset a slight decrease in harvested area. The all wheat yield, projected at 46.6 bushels per acre, is up 2.3 bushels from last year. The first survey-based forecast for 2022/23 winter wheat production is down 8 percent from last year as lower Hard Red Winter and Soft Red Winter production more than offset an increase in White Wheat production. Abandonment for Winter Wheat is the highest since 2002 with the highest levels in Texas and Oklahoma. Spring Wheat production for 2022/23 is projected to rebound significantly from last year’s drought-reduced Hard Red Spring and Durum crops primarily on return-to-trend yields. Total 2022/23 domestic use is projected down 1 percent on lower feed and residual use more than offsetting higher food use. Exports are projected at 775 million bushels, down from revised 2021/22 exports and would be the lowest since 1971/72. Projected 2022/23 ending stocks are 6 percent lower than last year at 619 million bushels, the lowest level in nine years. The projected 2022/23 season-average farm price (SAFP) is a record $10.75 per bushel, up $3.05 from last year’s revised SAFP. Wheat cash and futures prices are expected to remain sharply elevated through the first part of the marketing year when the largest proportion of U.S. wheat is marketed.

March 2022 Grain Market Report

Dale Johnson, Farm Management Specialist
University of Maryland

Information from USDA WASDE report

Attached is the summary for the March 2022 WASDE.

Corn

There were no changes on the corn supply side from the February 9 WASDE estimates. On the demand side, ethanol estimates increased 25 million bushel and esports increased 75 million bushel for a total demand increase of 100 million bushel. Ending stocks are estimated to be 1,440 million bushel, decreasing the stocks-to-use ratio from 10.4% in February to 9.6% in March. March 2022 Corn futures increased from $6.47 on February 9 to peak at $8.00 on March 4 and settle back to $7.45 March 9 as extraordinary world events drive market prices up.

Soybeans

There were no changes on the soybean supply side from the February 9 WASDE estimates. On the demand side, export estimates were increased by 40 million bushel and the residual estimate was decreased by 1 million bushel. This resulted in a lower estimate of ending stocks at 285 million bushel and a decrease in the stocks-to-use ratio from 7.4% to 6.4%. March 2022 futures price increased dramatically from $15.95 on February 9 to peak at $17.65 on February 24 and settle back to $16.87 on February 9 as extraordinary world events drive market prices up.

Wheat

On the supply side, import estimates were decreased by 5 million bushel. On the demand side, export estimates were decreased 10 million bushel. These changes increased the ending stocks by 5 million bushel to 653 million bushel and the stocks to use ratio increased from 33.4% to 33.8%. However, extraordinary world events drove March futures from $7.85 on February 9 to peak at 14.25 on March 7. On March 3 & 7, the market was limit up as trading was halted on those days. The market then went limit down on March 8, 9 , & 10. On March 9 &10 there was no trading. The market went limit down at the opening. On March 11 the market closed at $10.90 after the wildest ride in history.

October 2021 Grain Market Report

Dale Johnson, Farm Management Specialist
University of Maryland

Information from USDA WASDE report

Attached is the summary for the September 2021 WASDE.

Corn

2021/22 yield estimate was increased by 0.2 bushel per acre. The beginning supply estimate was adjusted up 49 million bushel. The net effect of these adjustments on estimated supply was an increase of 72 million bushel. On the demand side there were minor adjustments with the net effect of a decrease of 20 million bushel. The result of these supply and demand estimates was an increase in ending stocks of 92 million bushels and an increase in the stocks to use ratio from 9.5% to 10.1%. December futures peaked at $5.49 on September 30 but settled back at $5.22 on October 12.

Soybeans

2021/22 yield estimate was increased by 0.9 bushel per acre . The beginning supply estimate was adjusted up by 80 million bushel. Imports were adjusted down 10 million bushel. The net effect of these adjustments on estimated supply was an increase of 145 million bushel. Crushings were adjusted up 10 million bushels and residual was adjusted up 1 million bushel. The Net effect of all adjustments was an increase of 135 million bushels in ending stocks and increase in the stocks to use ratio from 4.2% to 7.3 %. November futures prices on June 10 closed at $14.59. November futures peaked at $13.08 on September 16 and  trended down to settle at $11.98 on October 12.

Wheat

There were small adjustments and demand and supply categories resulting in a net effect of a 35 million bushel decrease in ending stocks decreasing the ending stocks-to-use ratio from 29.8% to 28.5%. December futures peaked at $7.64 on October 4 then declined to settle at $7.34 on October 12.

April 2021 Market Report

Dale Johnson, Farm Management Specialist
University of Maryland

Information from USDA WASDE report

Attached is the summary for the April 2021 WASDE.

Corn

Supply estimates were unchanged. Feed and residual estimate was increased 50 million bushel. Ethanol estimate was increased 25 million bushel. Exports estimate was increased 75 million bushel. The total increase in demand was 150 million bushel decreasing ending stocks the same amount and decreasing the stocks-to-use ratio from 10.3% to 9.2%, the lowest since the 2012/13 marketing year. The Prospective plantings report on March 31 estimated 2021 corn acres at 91.1 million acres which was below expectations. This sent corn prices limit up on March 21. They have continued to climb. Nearby futures are trading in the $5.70 per bushel range and December Corn hit a high of $5.04 per bushel on April 9.

Soybeans

Supply estimates were unchanged. Crushings estimate decreased 10 million bushel. Exports increased 30 million bushel. Seed & residual decreased 20 million bushel. Total demand and ending stocks remained unchanged. The 2.6% stocks-to-use ratio is the lowest since the 2012/13 marketing year. The Prospective plantings report on March 31 estimated 2021 soybean acres 87.6 million acres which was below expectations. This sent soybean prices limit up on March 21. Nearby futures are trading in the $14 per bushel range and November futures closed at $12.63 per bushel on April 9.

Wheat

Wheat import estimate was decreased 20 million bushel. Feed and residual estimate was decreased 25 million bushel. These changes resulted in an increase in ending stock estimates of 16 million bushel and an increase in the stocks-to-use ratio to 40.3%. Since last month wheat futures have declined but in the past few days they have recovered and are trading in the $6.40 per bushel range for nearby futures contracts.

MD Grain Marketing Site Updated for 2021: Field Crop Budgets and Custom Rates

Shannon Dill, Ag Extension Educator Talbot County

The University of Maryland Extension has updated www.extension.umd.edu/grainmarketing website with new input data and spray programs for the 2021 field crop budgets. This site also has the new custom rate survey and 2020 cash rental rates.

Crop Budgets

Cost of production is very important when making decisions related to your farm enterprise and grain marketing. Enterprise budgets provide valuable information regarding individual enterprises on the farm. This tool enables farm managers to make decisions regarding enterprises and plan for the coming production year. An enterprise budget uses farm revenue, variable cost, fixed cost and net income to provide a clear picture of the financial health of each farm enterprise.

The 2021 Maryland enterprise budgets were developed using average yields and estimated input cost based upon producer and farm supplier data. The figures presented are averages and vary greatly from one farm and region to the other. It is therefore crucial to input actual farm data when completing enterprise budgets for your farm.

The budgets are available electronically in PDF or Excel online at https://extension.umd.edu/grainmarketing/crop-budgets. Use this document as a start or reference to create your crop budgets. If you have problems downloading any of these budgets, contact information is located on the website.

Cost Per Acre 2021

Corn – No Till

Corn – Conventional

Soybeans

Wheat

Wheat/Beans

2021

$540

$592

$346

$401

$608

Increase

0%

0%

0%

-6%

-4%

Custom Rate Survey for 2021

A mail survey was conducted in the fall of 2020 to determine custom works charges in Maryland.  Rates were received from 55 custom operators and farmers, and summarized for the state. Respondents indicated the rates they charge for various field operations. The charges reported in this publication may serve as a guide in determining an acceptable rate for a particular job where other information is unavailable. Reported rates include charges for machines, power, fuel, lube and the labor/operator. These rates do not include the costs of chemicals, seeds, and other materials with the exception of hay baling materials and where noted (i.e. spreading lime). Visit https://extension.umd.edu/grainmarketing/custom-rates-0 for more information.

Cash Rental Rates for 2020

Cash rent lease agreements are the most popular type of lease agreement in Maryland. Cash rent is a fixed amount on a per acre basis. In this agreement the owner is relieved of operating and marketing decisions and income is known year to year. The tenant has the risk and returns from the crop and can make crop and livestock decisions.

The USDA, National Agriculture Statistics Service (NASS) provides the county data in response to requests from customers as well as a requirement of the Farm Bill. Estimates of average cash rental rates per acre for irrigated cropland, non-irrigated cropland and pastureland are published at the County, District and State level where possible. This is based on responses to annual farm level surveys. More information available at: https://extension.umd.edu/grainmarketing/lease-agreements.

January 2021 WASDE Report

Dale Johnson, Farm Management Specialist
University of Maryland

Information from USDA WASDE report

Attached is the summary for the January 2021 WASDE.

This is all good news for farmers who still have crops in storage.

Corn

Yield estimate was adjusted down 0.5 bushels per acre from 175.8 to 172. This decreased production estimate 325 million bushels. Beginning stocks were adjusted down 76 million bushels. The two combined for a decrease of 400 million bushel in the supply estimate. Domestic demand estimate was decreased by 150 million bushels and the export estimate was decreased 100 million bushels for a decrease in the total demand estimate of 250 million bushel. The net effect of supply and demand decreased ending stocks 150 million bushels and the stocks-to-use ratio from 11.5% to 10.6%. This is the lowest stock-to-use ratio since the 2013/14 marketing year. These anticipated changes have been reflected in the market as March futures price for corn has skyrocketed almost $1.00/bu. this past month from $4.20/bu. on December 8 to a high of $5.17/bu. on January 12.

Soybeans

Yield estimate was adjusted down 1.2 bushels per acre from 50.7 to 50.2. This resulted in a decrease of 35 million bushel in estimated 2020/21 supply. Beginning stocks were adjusted up 2 million bushel and imports were adjusted up 20 million bushel. On the demand side, crushings were adjusted up 5 million bushels, exports were adjusted up 30 million bushels, and residual was adjusted down 13 million bushels. These adjustments resulted in a 21 million bushels increase in the total demand estimate. The resulting estimate of ending stocks was decreased by 35 million bushels decreasing the stocks-to-use ratio to a very low 3.1%. This is the lowest stock-to-use ratio since the 2013/14 marketing year. The March futures price for soybeans has spiked $2.71/bu. in the past month from $11.72 on December 8 to $14.23 on January 12.

Wheat

There were no adjustments in the supply side estimates. The demand estimate was increased by 26 million bushel (seed & feed) so the ending stock estimate was adjusted down 26 million bushels and the stocks-to-use ratio decreased from 40.8% in December to 39.1% in January. March wheat futures prices increased from $5.70/bu. on December 8 to $6.65/bu. on January 12.

Grain Marketing Meeting

January 8, 2021

Virtual Winter Grain Marketing Update

Registration: https://go.umd.edu/grainmarketing2021

This meeting will be virtual including speakers on various topics in grain marketing.  Topics include local and national grain outlook for:

  • tax considerations,
  • crop insurance and agricultural law.

Agenda:

8:00 am Welcome— Shannon Dill, Extension Educator, Talbot County, University of Maryland Extension

8:15 am Agriculture Law and Crop Insurance Update–Paul Goeringer, University of Maryland Extension

8:40am Tax Update— Henry Leonard, Certified Public Accountant, BSC Group, LLC

9:10am Grain Marketing Outlook— Jay Pierce, Director of Risk Services, Nagel Farm Service

9:40am Basis Tables and Grain Marketing Resources–Dale Johnson, Farm Management Specialist, University of Maryland Extension

10:00am Announcements and Adjourn— Share link to resources and survey.

If you have any questions, please contact Shannon Dill at sdill@umd.edu.

November 2020 WASDE Report

Dale Johnson, Farm Management Specialist
University of Maryland

Information from USDA WASDE report

Attached is the summary for the November 10 WASDE.

Corn

Yield estimate was adjusted down a significant 2.6 bushels per acre from 178.4 to 175.8. This decreased production calculation and total supply 215 million bushel. Domestic demand estimate was decreased by 75 million bushels but the export estimate was increased 325 million bushels for an increase in the total demand estimate of 250 million bushel. The net effect of supply and demand decreased ending stocks 465 million bushels and the stocks-to-use ratio from 14.9% to 11.5%. This is the lowest stock-to-use ratio since the 2013/14 marketing year. These changes have been reflected in the market as December futures price for corn has increased $1.00/bu. from $3.23/bu. on August 11 to a high of $4.23/bu. on November 10.

Soybeans

Yield estimate was adjusted down 1.2 bushels per acre from 51.9 to 50.7. This resulted in a decrease of 97 million bushel in estimated 2020/21 supply. On the demand side, minor adjustment in seed and residual resulted in an increase of 3 million bushels in the total demand estimate. The resulting estimate of ending stocks was decreased by 100 million bushels decreasing the stocks-to-use ratio to a very low 4.2% from 10.4% two months ago. This is the lowest stock-to-use ratio since the 2013/14 marketing year. The November futures price for soybeans has spiked $2.55/bu. in the past three months from $8.83/bu. on August 11 to a high of $11.38/bu. on November 10.

Wheat

There were no adjustments in the supply side estimates. The demand estimate was increased by 6 million bushel so the ending stock estimate was adjusted down 6 million bushels and the stocks-to-use ratio decreased from 42.1% in October to 41.7.1% in October. Wheat futures prices (December) increased from $5.94/bu. on October 9 to $6.09/bu. on November 10.