Dr. Nicole Fiorellino – Extension Agronomist
Louis Thorne – Faculty Specialist
Joseph Crank – Agriculture Technician Supervisor
Click here to download a pdf copy
Dairy farmers are constantly looking for sources of forage to meet their feed needs. One source that many of our region’s dairy farmers utilize is the fall planting of cereal grains that are green-chop harvested the following spring. Among the cereal species used for this purpose are rye, triticale, barley, and wheat. Per the Maryland Cover Crop Program guidelines, cereal grains planted as a cover crop prior to November 5 and suppressed via green-chop in the spring are eligible for the grant payment for participation in the Cover Crop Program. In addition, per the Nutrient Management Regulations, a fall application of dairy manure is allowed to a field planted to a cereal cover crop.
Planting a cereal cover crop that will be green chop harvested fits well into the crop rotation used by many dairy farmers. The scenario that many follow is to plant the cereal cover crop following harvest of corn silage. Prior to planting the cover crop, an application of manure is made to the field. The subsequent planting of the cover crop provides incorporation of the manure into the soil. The fall and spring growth of the cover crop is supplied nutrients from the manure. At the same time, the cover crop provides protection to the soil from loss of nutrients via leaching and/or erosion. The objective of this study was to evaluate select varieties of cereal species for cover crop performance and forage production and quality.
Cereal varieties (26) representing three species (rye, triticale, wheat) were evaluated at Central Maryland Research and Education Center – Clarksville Facility. Three replications for each entry were planted using a randomized complete block experimental design. Planting date was November 5, 2020. Planting was delayed in 2020 due to multiple large rain events that kept equipment out of the field. The 3’ X 18’ plots were planted with a small plot planter with 6-inch spacing between each of the 7 rows. The germination percentage for each entry was used to calculate the seeding rate needed to establish 1.5 million seedlings. Good stands were established in most plots by late fall.
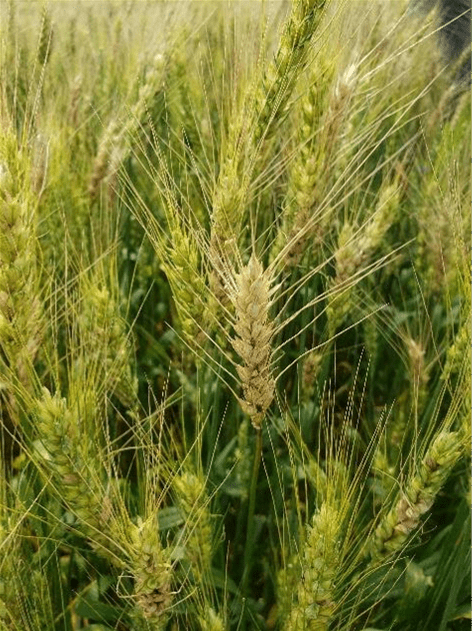
Our goal each year is to time spring biomass harvest with when entries reach late boot to early heading stage of development. We reached this growth stage from late April to mid May in 2021, with three harvest dates to capture the variation in maturity (April 20, May 4, May 14). Each harvest sample was collected by cutting the plants just above ground-level from three center rows of each plot from an area 2.5 feet in length and from two areas within the plot. The samples were placed into cloth bags and dried using a forced air dryer set at 60o C where they remained until sample water content was zero. Each sample was weighed and is reported as pounds of dry matter production per acre (Table 1). Each of the dried samples was ground through a 20-mesh screen using a large plant grinder and the ground biomass samples were sent to Cumberland Valley Analytical Laboratory for standard forage quality analysis.
Cover crop performance is measured by amount of biomass produced and the concentration of nitrogen (N) in the biomass. These two factors were used to estimate N uptake (Table 1). Despite late planting 2020, all varieties amassed good biomass during the growing season. Nitrogen uptake in 2021 was lower than in 2020, but still good, with only two varieties significantly different from the overall mean (one greater, one less). Several forage quality characteristics for these cereals were measured (Table 1). The descriptions of the various quality characteristics are described here and in the footnotes at the bottom of Table 1. Crude protein (CP) is the N content of the forage, with higher protein representing better feed quality. This value was used to calculate nitrogen uptake of each variety (Nitrogen content = % CP/6.25). Three rye varieties (Aroostook, TriCal Exp 19R01, and the check variety) had significantly greater CP than overall mean, with two triticale varieties (BCT 19004 and Hi Octane) having significantly less CP than the overall mean. Both Aroostook and TriCal Exp 19R01 also had soluble protein and rumen degradable protein (RDP) significantly greater than the overall mean.
Neutral and acid detergent fiber (NDF, ADF) are measures of feed value and represent the less digestible components of the plant, with NDF representing total fiber and ADF representing the least digestible plant components. Low NDF and ADF values representing increased digestibility; ideally NDF values should be <50% and ADF values should be <35%. Our plots were slightly more mature than ideal this year, with overall mean NDF of 60.2% and ADF of 36%. Despite this, one rye variety (KWS Propower) had ADF significantly less than the mean and both Aroostook and TriCal Exp 19R01 had ADF numerically less than 35%, although they likely would have ADF similar to the overall mean of 36%. Aroostook and TriCal Exp 19R01 also had total digestible nutrients (TDN), net energy for lactation (NEL) significantly greater than the overall mean, indicating good performing varieties. Some good performing wheat varieties included LW2068 and LW2958, which had lower ADF values, low NDF values, high TDN and NEL.
The characteristic that best captures the overall forage quality performance is Relative Feed Value (RFV). An RFV of 100 is defined as the forage value that full bloom alfalfa would have. Two triticale varieties (KWS Propower and Aroostook) had RFV significantly greater than the overall mean (95.0) and over 100. TriCal Exp 19R01 had RFV similar to the overall mean, but combined with the other forage quality factors indicate a good performing triticale variety. Three wheat varieties (LW2068, LW2958, Pioneer 25R25) had RFV significantly greater than the overall mean, and combined with other forage quality factors, indicate good performing wheat varieties.
Though none of these green-chop cereal forages are considered to be adequate as a stand-alone feed for a dairy operation, they can supply a source of forage used in a total mixed ration at the time of year when feed supply may be running short. When this forage benefit is added to the environmental benefit that is gained, planting winter cereal cover crops on a dairy farm can be a win-win decision.
Acknowledgements
This work could not be accomplished without the assistance and oversight of all field operations by Mr. Louis Thorne and Mr. Joseph Crank. We acknowledge the assistance of Ms. Shana Burke with seed packaging and harvested sample drying and weighing.
Table 1. Forage and cover crop performance of cereal species evaluated in Clarksville, MD during 2020-2021 growing season.
| Variety |
Species |
Brand |
Biomass Yield
lb DM/a |
Head
Date |
1Nitrogen
Uptake
lb N/a |
2Crude
Protein % |
3Soluble Protein
% DM |
4RDP
% DM |
5ADF
% DM |
6NDF
% DM |
7Ash
% DM |
8Total
Digestible
Nutrients
% DM |
9Net
Energy
Lactation
(Mcal/lb) |
10RFV |
| Wheeler |
Rye |
TriCal |
13241 |
May 9 |
266* |
12.5 |
6.0 |
9.3 |
38.5 |
60.7 |
6.2 |
60.1 |
0.61 |
90.0 |
| Hazlet |
Rye |
TriCal |
10736 |
May 6 |
202 |
11.5 |
4.9 |
8.2 |
36.4 |
61.3 |
6.8 |
60.1 |
0.61 |
92.2 |
| KWS Propower |
Rye |
TriCal |
9412 |
May 9 |
182 |
12.5 |
6.9* |
9.7* |
32.2 |
57.5 |
6.5 |
62.8* |
0.64* |
104.2* |
| Aroostook |
Rye |
TriCal |
8117# |
April 25 |
211 |
16.7* |
7.0* |
11.9* |
34.7 |
55.4 |
8.6* |
62.1 |
0.63 |
104.5* |
| TriCal Exp 19R01 |
Rye |
TriCal |
8251 |
April 25 |
197 |
14.8* |
6.8* |
10.8* |
34.2 |
57.4 |
7.3 |
62.0 |
0.63 |
101.0 |
| Rye VNS |
Rye |
check |
10065 |
May 4 |
240 |
15.1* |
5.5 |
10.3* |
35.4 |
55.8 |
7.9* |
61.8 |
0.63 |
102.5 |
| Rye Mean |
9970 |
May 3 |
216 |
13.9 |
6.2 |
10.0 |
35.2 |
58.0 |
7.2 |
61.5 |
0.63 |
99.1 |
| TriCal Gunner |
Triticale |
TriCal |
11936 |
May 14 |
176 |
9.2 |
4.2 |
6.7 |
39.1* |
63.6* |
7.2 |
58.2 |
0.59 |
85.7 |
| TriCal Exp 20T02 |
Triticale |
TriCal |
12531 |
May 14 |
186 |
9.3 |
3.1 |
6.2 |
37.2 |
62.1 |
6.1 |
59.4 |
0.60 |
90.0 |
| TriCal Flex 719 |
Triticale |
TriCal |
12329 |
May 14 |
205 |
10.4 |
5.4 |
7.9 |
41.7* |
65.8* |
7.0 |
56.2 |
0.57 |
80.0 |
| TriCal Merlin Max |
Triticale |
TriCal |
14641* |
May 14 |
233 |
9.9 |
5.7 |
7.8 |
41.4* |
65.5* |
6.4 |
56.0 |
0.57 |
81.0 |
| TriCal Surge |
Triticale |
TriCal |
10535 |
May 14 |
188 |
11.1 |
5.1 |
8.1 |
37.0 |
61.0 |
6.9 |
57.9 |
0.59 |
92.0 |
| TriCal Gainer 154 |
Triticale |
TriCal |
10458 |
May 6 |
176 |
10.4 |
4.2 |
7.3 |
32.7 |
58.0 |
6.9 |
61.8 |
0.63 |
101.7 |
| TriCal Thor |
Triticale |
TriCal |
12646 |
May 14 |
196 |
9.7 |
4.8 |
7.2 |
39.9* |
64.6* |
6.8 |
57.8 |
0.59 |
84.0 |
| BCT18001 |
Triticale |
SeedLink |
8817 |
May 6 |
172 |
12.4 |
4.6 |
8.5 |
33.0 |
55.6 |
7.3 |
63.6* |
0.65* |
106.0* |
| BCT18002 |
Triticale |
SeedLink |
11878 |
May 14 |
186 |
9.9 |
5.3 |
7.6 |
38.3 |
64.5* |
7.1 |
56.6 |
0.57 |
85.5 |
| BCT19003 |
Triticale |
SeedLink |
13001 |
May 14 |
204 |
9.8 |
3.5 |
6.6 |
36.3 |
61.5 |
5.5 |
60.1 |
0.61 |
92.0 |
| BCT19004 |
Triticale |
SeedLink |
15064* |
May 14 |
208 |
8.6 |
3.7 |
6.1 |
42.6* |
67.6* |
5.5 |
55.9 |
0.57 |
77.0 |
| BCT19005 |
Triticale |
SeedLink |
12406 |
May 14 |
209 |
10.7 |
5.5 |
8.1 |
35.5 |
61.9 |
5.9 |
60.2 |
0.61 |
92.2 |
| BCT19007 |
Triticale |
SeedLink |
13500 |
May 14 |
199 |
9.2 |
3.3 |
6.2 |
37.4 |
62.7 |
6.9 |
58.3 |
0.59 |
88.7 |
| MBX Tri-Cow Arcia |
Triticale |
Eddie Mercer |
11849 |
May 6 |
242 |
12.8 |
5.6 |
9.2 |
35.7 |
60.8 |
7.4 |
60.5 |
0.62 |
93.5 |
| Hi Octane |
Triticale |
check |
10957 |
May 14 |
139 |
8.1 |
4.1 |
6.1 |
40.2* |
63.5 |
6.5 |
57.0 |
0.58 |
85.2 |
| Triticale Mean |
12170 |
May 12 |
195 |
10.1 |
4.5 |
7.3 |
37.9 |
62.6 |
6.6 |
58.6 |
0.60 |
89.0 |
| LW2169 |
Wheat |
Local Seed |
10554 |
May 14 |
172 |
10.2 |
4.7 |
7.5 |
33.9 |
58.6 |
5.2 |
61.9 |
0.63 |
99.3 |
| LW2148 |
Wheat |
Local Seed |
10410 |
May 14 |
180 |
10.8 |
5.1 |
8.0 |
32.0 |
56.7 |
6.0 |
61.3 |
0.63 |
105.5* |
| LW2068 |
Wheat |
Local Seed |
12300 |
May 14 |
205 |
10.4 |
5.8 |
8.1 |
30.7 |
54.4 |
5.7 |
63.2* |
0.65* |
111.5* |
| LW2958 |
Wheat |
Local Seed |
10679 |
May 14 |
172 |
10.2 |
4.7 |
7.4 |
30.1 |
45.6 |
5.8 |
63.8* |
0.66* |
111.2* |
| P25R25 |
Wheat |
check |
11274 |
May 14 |
177 |
9.8 |
4.8 |
7.3 |
30.0 |
53.3 |
5.8 |
64.1 |
0.66* |
115.0* |
| Wheat Mean |
11069 |
May 14 |
182 |
10.3 |
5.0 |
7.7 |
31.2 |
55.4 |
5.7 |
62.9 |
0.64 |
109.0 |
| Overall Mean |
11454 |
May 10 |
197 |
11.0 |
5.0 |
8.0 |
36.0 |
60.2 |
6.6 |
60.1 |
0.61 |
95.0 |
| LSD0.1 |
2257 |
<1 day |
47 |
1.9 |
1.8 |
1.6 |
3.1 |
3.4 |
1.1 |
2.4 |
0.03 |
8.8 |
*,# Indicates the entry was either significantly greater (*) or significantly (#) less than the overall mean for that feed characteristic.
1Nitrogen uptake (lb N/acre) for each entry was estimated by multiplying the lb DM/ac X % nitrogen contained in the DM. The percent nitrogen for each entry was calculated by dividing crude protein by the conversion factor 6.25 which is the average amount of nitrogen (%) contained in protein.
2Crude Protein %: represents total nitrogen content of the forage; higher protein is usually associated with better feed quality.
3Soluble Protein %: non-protein N and portion of true proteins that are readily degraded to ammonia in the rumen.
4RDP (Rumen Degradable Protein): portion of crude protein that microbes can either digest or degrade to ammonia and amino acids in the rumen.
5ADF (Acid Detergent Fiber): represents the least digestible fiber portion of forage; the lower the ADF value the greater the digestibility.
6NDF (Neutral Detergent Fiber): insoluble fraction of forage used to estimate the total fiber constituents of a feedstock.
7Ash: mineral elements of the forage.
8TDN (Total Digestible Nutrients): measure of the energy value of the forage.
9Net Energy Lactation: estimate of the energy in a feed used for maintenance plus lactation during milk production.
10RFV (Relative Feed Value): indicates how well an animal will eat and digest a forage if it is fed as the only source of energy.